
Everywhere else in the valley, this month's reports read the same way: cut shares climbing, buyers negotiating, sellers conceding. Then there's North Las Vegas — where the median July sale closed at exactly 100% of asking price, in 18 days, and nearly a quarter of sellers got MORE than they asked.
Every figure below comes from a complete sweep our team ran on August 23, 2026 — all 985 active North Las Vegas listings examined individually, plus the 173 July closings that had posted to the GLVAR record by that date; July settled at 249 once the month finished posting (see the restatement below). If you want to understand where Southern Nevada's remaining competition lives, this is the report.
North Las Vegas in August 2026 is the valley's last competitive market: July's 249 closings (settled September 15) ran a $415,000 median ($425,000 single-family) at a 100% sale-to-list ratio and a 19-day market time — two-thirds of the metro's clock. 25.3% of sales closed OVER asking and only 39.3% of the 985 active listings carry a cut, both valley extremes. At $230 per square foot, the metro's entry point never cooled.
Restated September 15, 2026. The July closing figures in this report were counted on August 23, when about 70% of July's sales had posted to the MLS feed; closings keep posting for five to six weeks after a month ends. Fully posted, July shows 249 closings, not the 173 this report originally counted, at a $415,000 median ($425,000 single-family), 100% of list, 42.6% below asking, $230 per square foot and a 19-day median clock. The medians moved within a few percent and the conclusions stand; the active-listing figures, counted the same day, are unaffected. The Direct Answer and snapshot table above carry the settled figures; percentages elsewhere in the body reflect the August 23 count. The September 2026 edition carries the settled month in full, and this series now waits for a month to settle before counting it.
- July median sale-to-list: 100% — the only valley submarket where the median seller conceded nothing.
- 18-day median market time — roughly half of Henderson's 35 and Las Vegas proper's 29.
- 23% of July sales closed over asking, against 12–16% elsewhere in the valley.
- $419,900 July median ($425,000 single-family) at $234 per square foot — the metro's entry bench.
- Cut share 39.3% — still the valley's lowest, with the smallest median cut at $10,100.
What Are the North Las Vegas Numbers for August 2026?
| Metric | Value | Context |
|---|---|---|
| Active listings | 985 | Tightest inventory of the big-three cities |
| Listings with a price cut | 39.3% | Valley's lowest share |
| Median price cut | $10,100 | Valley's smallest — half of Henderson's |
| Median active list price | $424,900 | The metro's entry point |
| July closings | 249 (173 posted by Aug 23) | GLVAR records, city of North Las Vegas |
| July median sale — all types | $419,900 | Within 1.2% of the asking median |
| July median sale — single-family | $425,000 | In a 17-day median |
| Median sale-to-list | 100.0% | The valley's only full-ask median |
| Sold below list / over list | 47% / 23% | The most seller-favorable split in the metro |
| Median price per square foot | $234 | $18 under Las Vegas proper |
| Median days on market | 18 (17 single-family) | Half the metro's clock |
Read that middle column against any other city's report this month and the pattern inverts: everywhere else, the story is how much leverage buyers gained. Here, the story is how little.
Two framing notes before the rest of the report uses these figures. First, the windows: the active board, its 39.3% cut share, and the $424,900 asking median are as of the August 23, 2026 sweep; every closing statistic — $419,900, $234 a foot, 100.0% of list, 18 days — comes from the 173 sales recorded in July 2026. Second, the number that best explains this market is the gap between those two windows: $424,900 asked against $419,900 closed is a $5,000 spread, about 1.2%. Henderson's equivalent gap in the same month was $64,560 and the Summerlin corridor's was $114,000. In North Las Vegas the asking board and the closing record are effectively the same document, which is why the buyer tactics that work everywhere else in the valley — negotiate from the closings, ignore the asks — do nothing here. There is no spread to negotiate into; there is only the comp, and whether you can get to it first.
Why Is North Las Vegas Still Competitive When the Valley Isn't?
One word carries most of it: affordability — but the mechanics deserve spelling out, because they explain why this isn't fragile.
The $234-a-foot bench is the metro's entry price for a modern home. According to Las Vegas REALTORS, the metro's affordability squeeze has pushed an ever-larger share of first-time demand into the sub-$450,000 band — and North Las Vegas owns more sub-$450,000 modern housing stock than the rest of the valley combined. Every rate spike that prices a household out of Henderson makes them an NLV buyer, not a non-buyer. The city's demand pool is fed by everyone else's affordability problem.
Supply is structurally tighter. With 985 active listings against 173 monthly closings, NLV turns its inventory nearly twice as fast as Las Vegas proper. The master plans still delivering — Valley Vista, Villages at Tule Springs — sell much of their volume as new construction that never touches the resale board.
The buyer is a resident, not a speculator. According to the U.S. Census Bureau, North Las Vegas has been among Nevada's fastest-growing cities for a decade, driven by young families — and family buyers on school calendars don't "wait for the Fed." They buy when the lease ends.
The employment base moved north. The Apex Industrial Park buildout and the northern I-15 logistics corridor keep adding jobs closer to NLV than to anywhere else in the valley. According to the Bureau of Labor Statistics, metro employment sits near records — and an increasing share of it commutes north, not south.
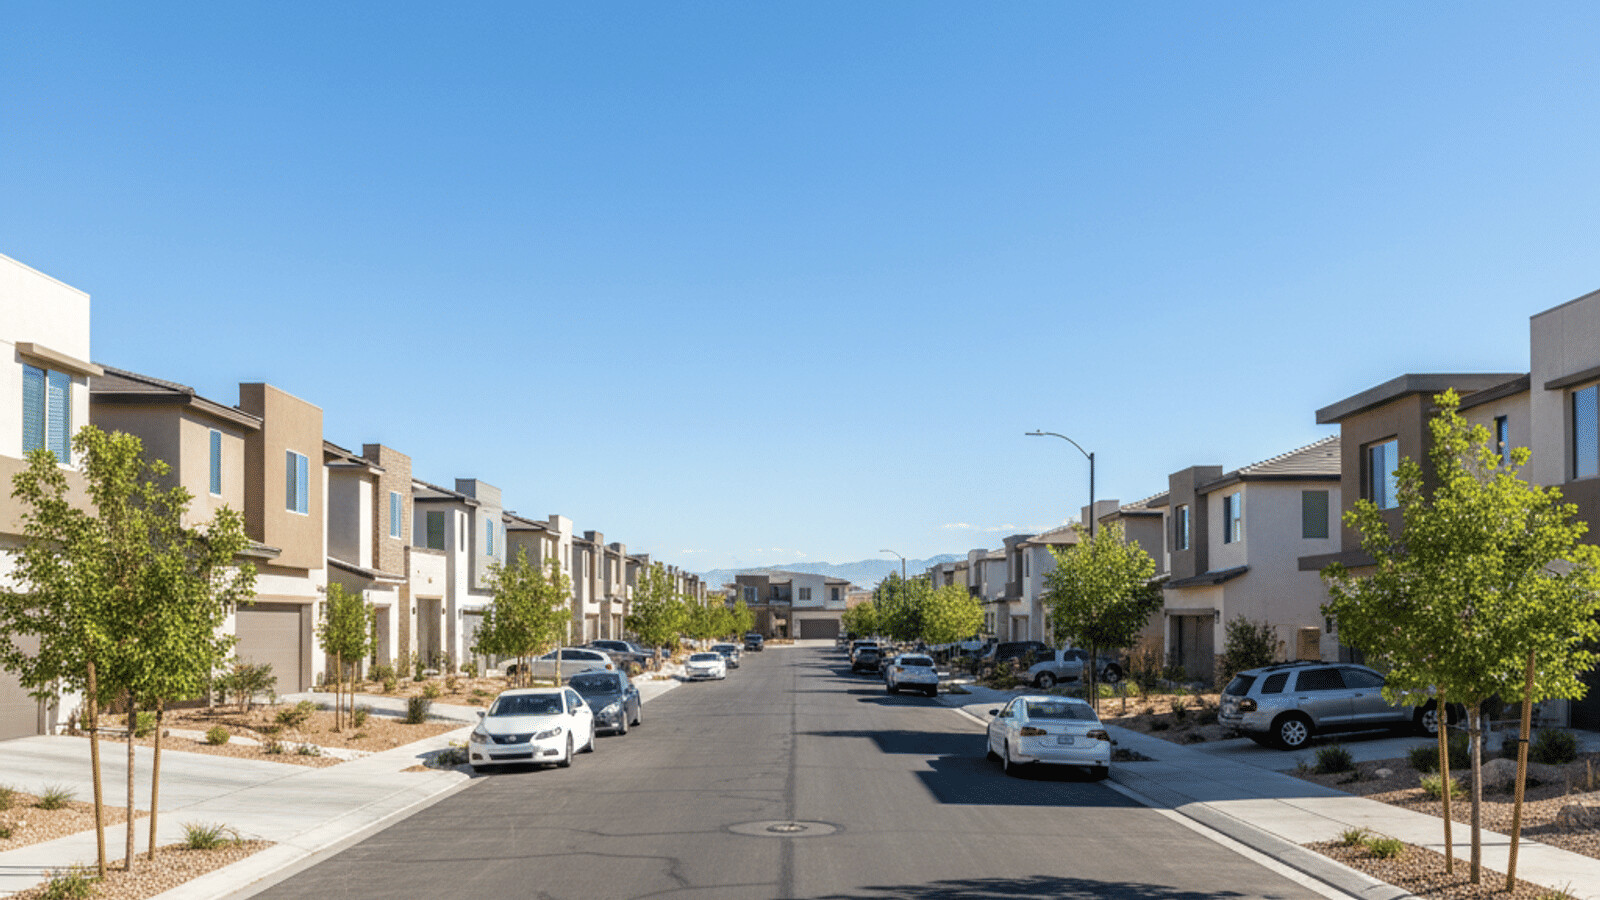
What Did North Las Vegas Homes Actually Sell For in July?
All 173 closings, examined individually:
- All-types median: $419,900 — landing within $5,000 of the median asking price, which is what a market in genuine equilibrium looks like.
- Single-family median: $425,000 in a 17-day median. For calibration, that price buys a townhome in Henderson and roughly nothing in the Summerlin core.
- $234 per square foot — the metro's entry bench. A 1,900-square-foot NLV home benches at about $445,000; anything asking meaningfully more is claiming lot, upgrades, or a Valley Vista address.
- The 47/23/30 split — 47% below list, 23% above, 30% at list. That over-ask share is nearly double Las Vegas proper's 16% and triple Summerlin's 12%. Multiple-offer situations remain a weekly event here, concentrated on turnkey homes between $380,000 and $450,000.
- 100.0% median sale-to-list. The middle seller in North Las Vegas gave up exactly nothing at the table. In August 2026, no other valley city can print that sentence.
The bench becomes a price test with one multiplication, and in an 18-day market it is the multiplication worth doing before the showing rather than after. At July's $234 a foot, a 1,500-square-foot Craig Ranch starter benches at about $351,000, a 1,900-square-foot Aliante two-story at roughly $444,600, and a 2,500-square-foot Valley Vista home near $585,000 — before the adjustments for lot, pool, and condition that, in our experience, move a specific North Las Vegas house 3–8% to either side of the bench, a narrower band than Henderson's or Summerlin's because the housing stock here is younger and more uniform. The 30% of July's closings that settled exactly at list are the market's center of gravity: sellers who opened at the comp and got the comp, with no cut and no counter. Add the 23% that closed over ask and more than half of North Las Vegas sales in July gave the seller at least everything they asked for. That is the number to picture when a listing agent says "priced to sell" here — it means priced to the bench, because the bench is where the offers are.
Which Parts of North Las Vegas Are Hottest?
The city's internal map matters as much as the headline:
| Dimension | Valley Vista / Villages at Tule Springs | Aliante / Eldorado | Craig Ranch corridor | Older core (east of I-15) |
|---|---|---|---|---|
| Typical band | $400K–$600K | $380K–$550K | $350K–$480K | $280K–$400K |
| August speed | Fast — but competing with builders | Fastest resale demand | Steady family volume | Investor-heavy, condition-driven |
| Over-ask frequency | Moderate | Highest | High on turnkey | Low — inspection leverage lives here |
| Buyer profile | New-build families | Move-up + relocation | First-time families | Investors + value hunters |
Aliante is the resale heartbeat — established master plan, golf corridor, the strongest over-ask frequency in the city. Valley Vista and Tule Springs carry the new-construction dynamic: resales there compete with builder incentive sheets, which is why the correctly-priced ones lean on completed landscaping and no-wait move-ins. The older core east of I-15 is the last true value play in the metro — sub-$350,000 entry with real renovation spread — and it behaves like it: investors, cash, and inspection-contingency negotiations.
The 90-day ZIP record further down puts numbers under that map. In the 90 days ending September 6, 2026, according to our analysis of Las Vegas REALTORS MLS data via Repliers, 89031 — the Eldorado master plan and central North Las Vegas — closed 166 sales at a $415,000 median in 18 days, the deepest closing count of any ZIP in the city; 89084, Aliante, closed 126 at $471,000 in 21 days, the highest median of the six main ZIPs; and 89030, the older core east of I-15, closed 43 at $325,000 in 34 days — the cheapest entry and the slowest clock, which is exactly what a renovation-and-inspection market should look like. The heat in the table above is not evenly spread: the two ZIPs that hold Eldorado and Aliante produced more closings in 90 days than the other four combined.
Is North Las Vegas Still a Bargain, or Has the Gap Closed?
Both, depending on the ruler. Against the valley: yes — $18 a foot under Las Vegas proper, $23 under Henderson, $52 under the Summerlin corridor, and the only market where the median seller concedes nothing precisely because it's the affordable one. Against its own history: the gap has narrowed dramatically — a decade ago NLV traded at a steep discount born of the foreclosure era; today's discount is a rational entry-tier spread, not a distress markdown.
What closed the reputational gap is visible on any drive through the northern master plans: a decade of new schools, the Craig Ranch Regional Park buildout, the VA hospital corridor, and city investment that, according to the City of North Las Vegas, has run at record levels through the Apex-era budget expansions. The market noticed before the commentary did — 18-day closings are what noticing looks like.
Translate the remaining discount into a payment and the "bargain" question answers itself. At $18 a foot under Las Vegas proper, a 1,900-square-foot home costs about $34,200 less in North Las Vegas than the same square footage across the city line — which, at the 6.65% rate in force the week of August 21, 2026 with 10% down, is roughly $198 a month in principal and interest. Against Henderson's $23-a-foot gap the same house saves about $43,700, or roughly $253 a month. Those are real savings, but they are savings on an equivalent house, not a distressed one, and the gap inside the city is now larger than the gap to its neighbors: the 90-day ZIP record shows 89030 closing at $325,000 while 89084 closes at $471,000 — a $146,000 spread that says "North Las Vegas is cheap" has become as imprecise as "Henderson is expensive." The bargain is a specific ZIP and a specific decade of construction, not the city.
What Should North Las Vegas Buyers Do in This Market?
Forget everything the other valley reports advise — this market punishes that playbook:
- Get fully underwritten, not pre-qualified, before you tour. At 18-day medians, the home you see Saturday is gone by the second weekend. Underwritten offers win ties, and ties are common at 23% over-ask.
- Bid to the comp, not to the leverage fantasy. The $234 bench and the last 60 days of the specific subdivision are your ceiling logic. Lowballing an Aliante turnkey is how you spend a summer losing.
- Escalate smart on the competitive stock. Where multiple offers are likely ($380,000–$450,000 turnkey), an escalation clause capped at your bench-tested number beats a nervous overbid.
- Keep the inspection everywhere except the bidding wars you choose deliberately. The east-of-I-15 value plays absolutely require it; waiving there is how a $320,000 bargain becomes a $370,000 project.
- Check the builder math before paying resale premiums in Valley Vista. A new-construction quick move-in with incentive financing can beat a resale at the same sticker — compare nets, then decide.
And one leverage note that survives even here: the 39.3% of listings that HAVE cut price skew heavily toward the over-$500,000 tier and dated inventory. NLV's negotiable tail is small, but it exists — and almost nobody hunts it, because everyone assumes this market has none.
What Should North Las Vegas Sellers Do in September?
You hold the valley's best hand — play it precisely rather than greedily:
- Price AT the bench, not above it. NLV's 100% sale-to-list median is earned by accurate pricing meeting deep demand — not by overreach. The 39.3% who cut priced like it was Henderson; don't join them.
- Prep for the first weekend like it decides everything, because it does. At 18-day medians, your buyer sees the home in week one. The $2,500 of paint, mulch, and deep-clean returns multiples here faster than anywhere in the valley.
- Set an offer-review date on turnkey stock under $450,000. With 23% of sales closing over ask, a stated review date converts weekend traffic into competing offers instead of a first-come sprint.
- If you're in Valley Vista, sell against the builder honestly — completed yard, window coverings, no six-month wait — and price with the incentive sheet in view, because your buyer will have it in hand.
Put numbers on what mispricing costs here, because the arithmetic runs differently from Henderson's. On the $419,900 median, the at-table concession for the median seller is $0 — the market's 100% sale-to-list ratio means the price you print is the price you get, provided you printed the right one. The cost of overreach is therefore all calendar and public cut: a listing that opens 8% above the bench is asking roughly $33,600 more than the comps support, sits through the 18-day window in which this market delivers its buyers, takes the $10,100 median cut, and then reenters a market that has already seen it once. The seller who priced at the bench on day one collected 100% of it inside three weeks and, roughly one time in four, collected more. In a market with a 30% at-list share and a 23% over-ask share, the offer-review date is the tool that converts a correct price into a competitive one — set it for the Monday after the first weekend and let the depth of demand do the negotiating for you.
How Does NLV Compare to the Rest of the Valley This Month?
The August scoreboard, side by side: Las Vegas proper runs 29-day medians at 98.8% of list with 43% cutting; Henderson runs 35 days at 98.9% with 45.4% cutting; the Summerlin corridor runs 27 days at 98.2% with the valley-high 47.5% cutting — and North Las Vegas runs 18 days at 100.0% with 39.3% cutting. Same metro, same month, same rates. The difference is the price point: NLV sits where the demand actually is. For buyers, that makes it the one market where speed still beats patience; for sellers, the one market where the clock is still your friend; for investors, the strongest rent-demand fundamentals in the valley at the lowest entry bench.
The rest of the scoreboard, from the same-day sweeps across this series, sharpens the contrast. Las Vegas proper carried 8,170 active listings on August 23 with a $19,901 median cut, and its 991 July closings ran a $430,000 all-types median with 59% below asking. Henderson carried 2,288 actives with a $20,000 median cut; its 334 July closings ran $480,000 with 60% below list. The Summerlin corridor's 1,673 actives cut a $25,000 median, and its 240 closings ran $525,000 with 69% below list. Boulder City's 141 listings and twelve July closings at $425,000 and $325 a foot are the scarcity outlier. North Las Vegas's 985 actives, $10,100 median cut, and 47% below-list share are the lowest figures on every one of those lines — and its 23% over-ask share is the highest by a wide margin. According to Las Vegas REALTORS, the association's monthly statistics blend every GLVAR closing in the metro into one headline, which is precisely why a North Las Vegas decision needs the city-level count: the valley average is made of three cities that negotiate and one that does not, and the average erases exactly the signal a buyer or seller here needs.

How Do the ZIP Codes Inside North Las Vegas Compare?
The city median sits closer to its asking board than any other in the valley, but the ZIPs underneath it are not interchangeable. To separate them, we pulled each ZIP's active board and its closings for the 90 days ending September 6, 2026, according to our analysis of Las Vegas REALTORS MLS data via Repliers. All property types are included, ZIP boundaries do not match city limits exactly, and the window is a rolling 90 days rather than July alone — so read the rows against each other, not against the July table above. The North Las Vegas ZIP code guide maps each one to its neighborhoods.
| ZIP | Area | Active listings | Median ask | Closed (90 days) | Median closed | Median DOM |
|---|---|---|---|---|---|---|
| 89031 | Eldorado / central North Las Vegas | 268 | $430,000 | 166 | $415,000 | 18 |
| 89084 | Aliante | 282 | $465,495 | 126 | $471,000 | 21 |
| 89081 | North-central, east of I-15 (Losee / Ann corridor) | 160 | $429,950 | 76 | $415,000 | 21 |
| 89032 | Craig Ranch corridor | 174 | $425,000 | 62 | $406,500 | 19 |
| 89086 | Villages at Tule Springs / far north | 75 | $399,980 | 22 | $411,250 | 29 |
| 89030 | Older core, east of I-15 | 157 | $221,000 | 43 | $325,000 | 34 |
Three readings. First, the two master-plan ZIPs are the market: 89031 and 89084 together closed 292 of the 495 sales across the six rows, and both did it at or under three weeks. Second, 89030 is the only row in the valley's ZIP tables this month where the median ask ($221,000) sits far below the median closing ($325,000) — the reverse of every other ZIP in the metro. That inversion is consistent with an active board stacked with the ZIP's cheapest stock — smaller and older homes, lots, and listings the market has already passed over — while what actually closes is the renovated house at the top of the ZIP's range. It is the statistical signature of a value-add market: buy off the $221,000 board, sell into the $325,000 record, and budget the difference for the work in between. Third, 89086, the far-north ZIP that holds the Villages at Tule Springs, carries the slowest clock of the six at 29 days and the thinnest closing count, which is the resale-versus-builder competition described earlier showing up in the record: a resale in a ZIP where the builder is still releasing has to wait for the buyer who has already priced the incentive sheet. The seventh ZIP, 89085, closed only 9 sales at a $485,000 median in 17 days — too few to read as anything more than a sign that the newest sections trade at the top of the city's range. For an investor, the table is the spread map; for a first-time buyer, it is the reason to search by ZIP before searching by house.
What Does the Median North Las Vegas Home Cost Per Month?
The $419,900 median, translated at the current 6.65% thirty-year rate (Freddie Mac PMMS, August 21):
| Down payment | Loan amount | P&I / month | Note |
|---|---|---|---|
| 3.5% FHA ($14,697) | $405,203 | $2,601 | Plus FHA mortgage insurance |
| 5% ($20,995) | $398,905 | $2,561 | Conventional entry |
| 10% ($41,990) | $377,910 | $2,426 | The common first-family path |
| 20% ($83,980) | $335,920 | $2,156 | No mortgage insurance |
Two NLV-specific notes on that table. First, this is the only big-city median in the valley where an FHA buyer's 3.5% down payment fits under $15,000 — which is why entry demand concentrates here and why the market stays competitive. Second, the seller-funded buydown play that dominates the rest of the valley's reports mostly DOESN'T work here — at 100% sale-to-list and 18-day clocks, NLV sellers aren't funding concessions on competitive stock. The buydown conversation lives only in the small negotiable tail above $500,000. Different market, different tools.
Two more facts make the FHA row more than a curiosity. According to HUD, FHA's minimum down payment is 3.5% for borrowers who meet its credit floor, and at that down payment the annual mortgage insurance premium stays on the loan for its full term — which is why the $2,601 in the table understates the true FHA payment by the insurance line, and why the 5% conventional row, only $40 a month cheaper before insurance, is often the better long-run choice for a buyer who can stretch the extra $6,300 of down payment and qualify conventionally. And because the median seller here concedes nothing at the table, the FHA buyer's edge in North Las Vegas is not price; it is acceptance. At 100% sale-to-list, sellers take FHA offers routinely rather than holding out for cash, because the market's depth makes the financing type a non-issue in a way it plainly is not in Henderson's or Summerlin's premium bands. The practical sequence for a first-time buyer is therefore: full underwriting first, the ZIP table second, the showing third — in that order, because the 18-day clock does not wait for a pre-approval letter to become a real one.
How Has North Las Vegas Shifted Since the June Report?
Our June NLV report already flagged this market as the valley's outlier; August's sweep shows the outlier status hardening rather than fading. Through a summer in which every neighboring submarket's cut share climbed and clocks stretched, North Las Vegas held its 18-day median and its full-ask closing ratio — the only big market in Southern Nevada whose seller position did not erode between the two reports.
The June figures make the movement concrete. June's report printed a $395,000 median sold price, 1,077 active listings, a 19-day median market time, and $233 per square foot. August's sweep prints $419,900 for July, 985 actives, 18 days, and $234 a foot. The board thinned by roughly 9%, the clock held, and the per-foot bench held to the dollar — while the price median rose 6.3%, which is mix rather than appreciation: June's closings skewed toward smaller entry-level homes, as that report noted at the time, and July's skewed back toward the master plans. Read together, the two months say the same thing from different angles: the bench is flat, the inventory is shrinking, and the buyers are not going anywhere.
According to Las Vegas REALTORS, metro-wide inventory kept building through July — and NLV's share of it kept shrinking relative to demand, which is the whole mechanism in one line: the affordability tier is absorbing the demand the premium tiers are shedding. Every Henderson household that steps down $100,000 in budget, every Summerlin renter who runs the payment math, every California arrival targeting a sub-$450,000 landing — they converge here, and the 985-listing board cannot deepen fast enough to soften the competition.
According to the National Association of REALTORS, first-time buyers nationally have been squeezed to historic-low shares of the market — which makes NLV's persistence remarkable in the other direction: this is one of the few submarkets in the country where the first-time buyer still wins routinely, because the stock matches their budget and the FHA math still closes. That is not a market anomaly; it is what happens when a city spends a decade building exactly the housing the decade would demand.
What September should tell us: whether the negotiable tail grows. If NLV's cut share pushes past the low forties while the neighbors' shares plateau, the affordability tier is finally feeling the same gravity — and the valley's last sprint market starts jogging. Nothing in July's data suggests it yet. The 100% sale-to-list median is the number to watch; it has no room above it, only below.

How Was This Report Built?
Counted, not sampled — and in this market the difference was the entire story. A four-page sample of the NLV board sorted oldest-first read a 53% cut share this week; the complete 985-listing count reads 39.3%. Fourteen points of error, all in the direction of making the valley's most competitive market look like its neighbors. The sales side: the 173 July closings that had posted by August 23 (249 once the month settled), each sale price ratioed against its final list — that is where the 100.0% median and the 23%-over-ask figure come from, and neither number survives sampling either. When a headline tells you "Las Vegas is a buyer's market," remember it is averaging three cities that negotiate with one that doesn't — the metro mean erases exactly the signal a North Las Vegas decision needs. Across the 9,600-plus closings Nevada Real Estate Group has represented, no submarket has punished valley-average thinking more consistently than this one.
The ZIP-level table is this month's one addition to the method, and it deliberately uses a different window: active counts as of September 6, 2026, and closings for the 90 days ending that date, pulled ZIP by ZIP through the same Repliers MLS access and including every property type. A rolling 90 days gives each ZIP enough closings — 22 to 166 — to print a median worth reading, which a single month at ZIP level would not; the 89086 row at 22 closings and the 89085 figure at 9 are the thin ones, and they are labeled as such. Where the ZIP figures and the July city-wide figures disagree, the window and the boundary are the reasons, and both are stated so you can tell which is which.
What Does This Mean for Your North Las Vegas Move?
Buying: come prepared for the valley's one remaining sprint — underwritten, bench-calibrated, decisive — and hunt the ignored negotiable tail if you want leverage. Selling: price at the bench and let the market's depth work; you're operating the last seller's market in Southern Nevada. Investing: the fundamentals — lowest entry, tightest turn, strongest rent-demand growth — remain the metro's cleanest, which our NLV investment outlook covers through the Apex lens. The ZIP table is the investor's version of this report in one glance: 89030's $325,000 closed median against its $221,000 asking board is the last visible spread in the metro, and 89084's $471,000 in 21 days is the exit that spread gets measured against.
One renter's footnote before the FAQ, because NLV's rent math is the sharpest in the valley: the typical three-bedroom rental here runs $1,900–$2,200 a month against the $2,426 principal-and-interest on the median at 10% down. A $300-a-month gap to ownership — before principal paydown of roughly $4,300 in year one — is the narrowest rent-to-own spread in Southern Nevada, and it is the quiet engine behind the 18-day clock: every month, another cohort of NLV renters finishes this arithmetic and joins the buyer pool. In a market this tight, your competition isn't just other buyers relocating in; it's your own neighbors deciding to stop renting.
Street-level specifics: (702) 637-1759 · current North Las Vegas inventory · what your home would bring.
Frequently Asked Questions
What is the median home price in North Las Vegas in August 2026?
July closings ran a $419,900 median across all property types and $425,000 for single-family homes, at $234 per square foot — the metro's entry bench, sitting $18 a foot under Las Vegas proper and $52 under the Summerlin corridor. The median asking price is $424,900, essentially at parity with closings — the valley's only equilibrium.
Is North Las Vegas a seller's market right now?
It is the closest thing Southern Nevada has to one: 100% median sale-to-list, 18-day median market time, 23% of July sales over asking, and the valley's lowest cut share at 39.3%. It is not 2021 — 47% of sales still closed below list — but relative to every neighboring market, sellers here hold the strongest hand in the valley.
Why is North Las Vegas selling faster than Las Vegas and Henderson?
Affordability concentration. NLV owns most of the metro's modern sub-$450,000 housing, which is exactly where demand pooled as rates priced households out of pricier submarkets. Add structurally tighter inventory (985 actives turning nearly twice as fast as Las Vegas proper) and family buyers on lease-end and school-calendar timelines, and the 18-day clock explains itself.
Do buyers have any leverage in North Las Vegas?
In the tail, yes. The 39.3% of listings with cuts skew toward over-$500,000 and dated stock — a negotiable minority almost nobody hunts because the market's reputation says it doesn't exist. On turnkey homes between $380,000 and $450,000, leverage is minimal: 23% of sales close over ask, and clean, fast offers beat clever ones.
Is North Las Vegas a good investment in 2026?
The fundamentals are the valley's cleanest: lowest entry bench, fastest inventory turn, and rent demand fed by the Apex corridor's job growth. The trade-off is competition on acquisition — investors here compete with owner-occupants who pay full ask in 18 days. The east-of-I-15 value stock remains the last genuine spread play in the metro.
Should I use FHA financing in North Las Vegas?
It's the metro's most FHA-workable big market — 3.5% down on the median fits under $15,000, and at 100% sale-to-list, sellers here accept FHA offers routinely because they don't need to chase cash. Get fully underwritten first; in an 18-day market, FHA pre-qualification alone loses ties.
How much did the typical North Las Vegas price cut run in July?
For the minority of listings that cut at all, the median reduction was $10,100 — the valley's smallest, roughly half of Henderson's $20,000 and well under the Summerlin corridor's $25,000. Small cuts and few of them: the statistical signature of a market that mostly priced right the first time.
Which Sources Inform This North Las Vegas Market Report?
- Full GLVAR feed sweep, August 23, 2026 — all 985 active North Las Vegas listings and all 173 July closings, examined individually via NREG's Repliers MLS access
- ZIP-level pull, September 6, 2026 — active counts and 90-day closings for North Las Vegas ZIPs 89030 through 89086, via NREG's Repliers access to Las Vegas REALTORS MLS data
- Las Vegas REALTORS — metro affordability and demand context
- City of North Las Vegas — municipal investment and growth
- U.S. Census Bureau — population and household growth
- Bureau of Labor Statistics — the employment base behind demand
- Freddie Mac PMMS — the 6.65% rate environment
- HUD — FHA loan framework
- Clark County Assessor — parcel context
- NAR — national benchmarks
- National Association of Home Builders — builder dynamics in the master plans
Methodology: cut share measured on the complete 985-listing active board (original vs current list price); sales measured on all 173 GLVAR-recorded July closings in the city of North Las Vegas. Counted, not sampled — a sampled version of this market's cut share read 14 points high. Not an appraisal of any individual home.