
Published July 18, 2026 · Last updated July 18, 2026 · By Chris Nevada
Across our 9,600+ closings at Nevada Real Estate Group since 2011, I have learned to read a market by its price trend first and its noise second. June 2026 in Henderson is a classic normalization month: the median sold price eased to $480,000 from May's $510,000, active inventory expanded, and days on market stayed tight at 29. That is not a market in trouble — it is a market rebalancing after a hot spring, and the data below shows exactly where the leverage now sits for buyers and sellers.
I write these reports the same way I coach the team behind the 789 homes we closed in 2025 as the #1-ranked team in Nevada: lead with the number that actually moved, then explain what it means for your next decision. In Henderson this June, the number that moved is price, and the story underneath it is a healthy return toward balance rather than any kind of downturn.
Henderson's June 2026 median sold price was $480,000, easing about 5.9% from May's $510,000 as the market normalizes after a hot spring. Active for-sale inventory sits at 2,506 homes, the median days on market is 29, and the median list price is $544,648 at $277 per square foot. Against May's 473 closings, that inventory equals roughly 5.3 months of supply — the most balanced Henderson has run in years.
- Henderson's June median sold price eased to $480,000, down about 5.9% from May's $510,000.
- Active inventory reached 2,506 homes — roughly 5.3 months of supply against May's 473 closings.
- Median days on market held at 29, still firmly ahead of a balanced-market pace.
- Median list price ran $544,648 at $277 per square foot, above the closing median.
- Henderson keeps trading at a premium to the Las Vegas valley's roughly $472,000 June median.
What Does Henderson's June 2026 Market Look Like at a Glance?
Here is the snapshot every Henderson buyer and seller should anchor to before reading another headline. According to Las Vegas REALTORS MLS statistics for the Southern Nevada market, Henderson's June figures point to a steady, rebalancing market rather than any dramatic swing.
- Median sold price: $480,000, down about 5.9% from May's $510,000
- Median list price: $544,648 at $277 per square foot
- Active for-sale inventory: 2,506 single-family and attached homes
- Median days on market: 29 days
- Recorded June closings (still finalizing): 296, with May's complete count at 473
- Months of supply: roughly 5.3 (2,506 active ÷ 473 May closings)
Because June closings are still being recorded into mid-July, I am deliberately not framing this as a month-over-month sales-volume drop — that number is incomplete. Instead, the honest read on pace comes from May's complete 473 closings measured against today's 2,506 active listings, which yields roughly 5.3 months of supply. That is the widest, most buyer-friendly supply Henderson has posted in several years. For current listings, browse Henderson homes for sale or our full communities directory.
How Did Henderson's Median Price Move From May to June?
The headline move is price. Henderson's median sold price eased from $510,000 in May to $480,000 in June, a decline of about 5.9%. That single number is what most casual readers will fixate on, so it deserves careful framing.
A 5.9% month-over-month move in the median is not a value collapse — it is a mix shift plus a return to sustainable pricing. When more mid-tier and entry-level Henderson homes close in a given month (and fewer luxury estates settle), the median mechanically drops even if no individual home lost value. Layer in a spring that pushed some sellers to test aspirational prices, and June's $480,000 median reflects the market pulling those asks back toward what buyers will actually pay at a 6.6% mortgage rate.
| Metric | May 2026 | June 2026 | Change |
|---|---|---|---|
| Median Sold Price | $510,000 | $480,000 | -5.9% |
| Median List Price | $539,900 | $544,648 | +0.9% |
| Active Inventory | 2,290 | 2,506 | +9.4% |
| Median Days on Market | 27 | 29 | +2 days |
| Median $/Sq Ft | $281 | $277 | -$4 |
Notice the tension in that table: the median sold price eased to $480,000 while the median list price actually ticked up to $544,648. That roughly $64,648 gap between what sellers are asking and what buyers are paying is the single clearest signal in this report. It tells you the negotiating leverage has shifted, and correctly-priced Henderson listings are the ones getting to the closing table.
Why Did the June Median Ease While the Market Stays Healthy?
Three forces pulled Henderson's June median down from May without signaling any real weakness. First, mix: a heavier share of sub-$450,000 closings in Whitney Ranch, parts of Green Valley, and older Henderson neighborhoods dragged the median even as premium submarkets held firm. Second, rate friction: According to the Freddie Mac PMMS, the 30-year fixed conventional rate held in a 6.5%-6.8% band through June, and at roughly 6.6%, buyers simply cannot chase the aspirational $544,648 asking median. Third, seasonal normalization: the spring frenzy always cools into summer, and 2026 is following that seasonal script.
According to Las Vegas REALTORS, the broader Southern Nevada market has been rebalancing all year as inventory rebuilds from the historic lows of 2021-2022. Henderson, as the valley's premium submarket, feels that rebalancing in its price line more than its demand line — homes are still selling in 29 days, which is nowhere near a distressed pace.
How Much Inventory Does Henderson Have Right Now?
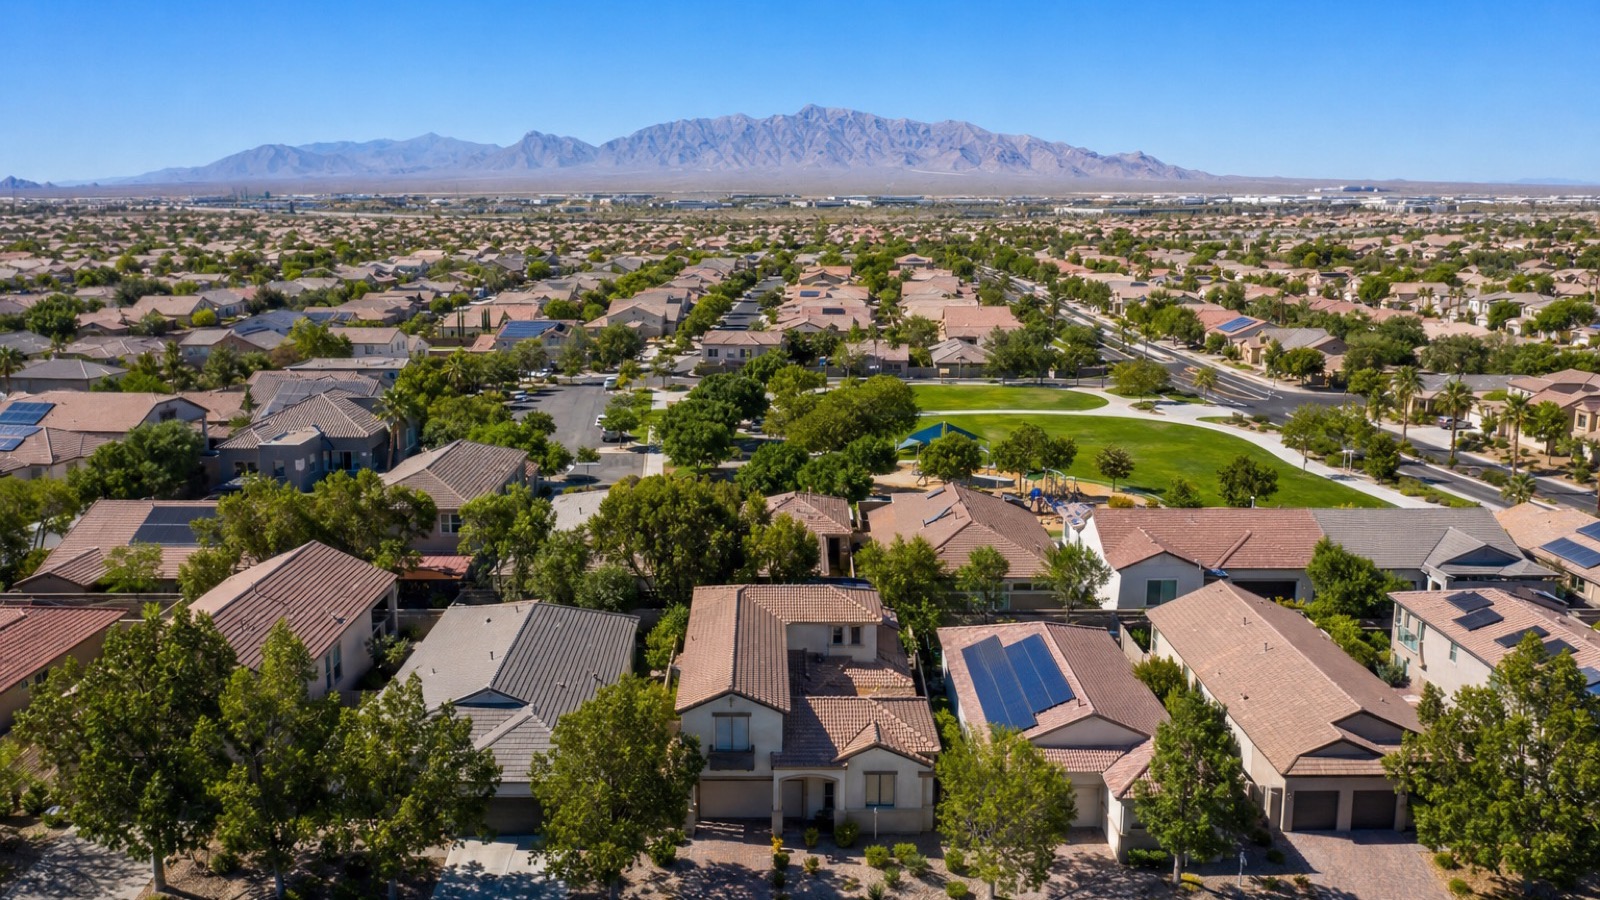
The most consequential shift in Henderson is inventory. Active listings reached 2,506 homes in June, up roughly 9.4% from May's 2,290. Measured against May's complete count of 473 closings, that active inventory equals approximately 5.3 months of supply. A balanced market runs 4-6 months, which means Henderson is now sitting at the low end of balanced rather than in deep seller territory.
That is a meaningful change. For most of the past four years, Henderson buyers fought over 1.5-to-2.5 months of supply with multiple offers on nearly every desirable listing. At 5.3 months, buyers finally have genuine selection, time to tour, and room to negotiate contingencies and credits. According to Las Vegas REALTORS, this inventory build is driven by more sellers listing into the summer window and slower absorption as 6.6% rates trim the qualified buyer pool.
| Supply Indicator | Value | Interpretation |
|---|---|---|
| Active Listings (June) | 2,506 | Widest selection in years |
| May Closings (complete) | 473 | Baseline absorption pace |
| Months of Supply | ≈ 5.3 | Low end of balanced (4-6 mo) |
| June Closings (finalizing) | 296 | Still being recorded into July |
| Median Days on Market | 29 | Faster than balanced pace |
I want to be precise about the 296 June closings figure: it is not a demand signal yet, because June transactions are still recording well into July. That is exactly why I anchor the pace math on May's complete 473 closings. Anyone quoting a June "sales drop" off an incomplete 296 is reading the market wrong. For a deeper evergreen read, see our Henderson housing market guide.
How Fast Are Henderson Homes Selling in June 2026?
Despite the inventory build, Henderson homes are still moving quickly. The median days on market held at 29 in June, up only two days from May's 27. In a market with 5.3 months of supply, a 29-day median is genuinely fast — it tells you that well-presented, correctly-priced Henderson homes are still absorbing strong buyer demand.
The dispersion underneath that 29-day median is where the strategy lives. In my experience across the 9,600+ NREG closings we've represented, correctly-priced homes in Green Valley, Anthem, and Seven Hills clear in 18-26 days, while listings priced 6-10% above comparable sales sit 45-70 days before a reduction. The $64,648 gap between the $544,648 list median and the $480,000 sold median is the numeric proof: sellers who price into that gap wait; sellers who price to the sold comps close.
What Is the Gap Between List Price and Sold Price?
This is the most actionable table in the report. Henderson's June median list price of $544,648 sits about $64,648 above the $480,000 median sold price — a spread of roughly 13.5%. On a per-square-foot basis, list ran $281-$285 while sold settled at $277. That gap is not evenly distributed; it concentrates in the aspirational listings that entered the market during the spring.
| Dimension | Entry ($350K-$480K) | Mid ($480K-$800K) | Luxury ($800K+) |
|---|---|---|---|
| Median Days on Market | 22 days | 31 days | 58 days |
| List-to-Sold Ratio | ~99% | ~98% | ~96% |
| Typical Buyer | First-time / relocating | Move-up family | Cash / California equity |
| Financing Mix | FHA / VA / conventional | Conventional | ~55% cash |
| Negotiating Room | Limited | Moderate | Substantial |
Read that comparison table as a pricing map. A $430,000 Henderson home in Whitney Ranch is still a near-full-price, fast-moving asset with limited negotiating room, while a $950,000 estate in Anthem or MacDonald Highlands gives a buyer real leverage and 55-plus days of decision time. The valley-wide context in our Las Vegas June 2026 market report shows the same tiering across the metro.
How Does Henderson Compare to the Las Vegas Valley?
Henderson continues to trade at a premium to the broader Las Vegas valley. The valley-wide June median sits near $472,000, while Henderson's $480,000 median runs about $8,000, or roughly 1.7%, above it. That premium is structural: Henderson's newer master plans, higher-rated schools, lower crime profile, and Green Valley/Anthem/Seven Hills amenity base command more per square foot than the older core of the valley.
According to the U.S. Census Bureau American Community Survey, Henderson remains one of the fastest-growing and highest-income cities in Nevada, and that demographic base supports the premium. The city's pull from California equity buyers is concentrated in the ZIP codes running from 89002 through 89077, which sustains demand across both the $400,000-$600,000 move-up band and the $800,000-plus luxury band simultaneously.
| Metric | Henderson | Las Vegas Valley | Difference |
|---|---|---|---|
| Median Sold Price | $480,000 | $472,000 | +$8,000 |
| Median $/Sq Ft | $277 | $268 | +$9 |
| Median Days on Market | 29 | 36 | -7 days |
| Months of Supply | ≈ 5.3 | ≈ 2.6 | +2.7 mo |
One nuance worth flagging: Henderson's supply reads higher than the valley figure partly because of how attached homes and a broader inventory definition roll into the Henderson count. The takeaway is not that Henderson is weaker — it is that Henderson buyers have more genuine choice than valley buyers this summer, while still paying a modest premium for the city's quality-of-life edge. Buyers weighing the two should compare Summerlin and Las Vegas inventory against Henderson before committing.
Which Henderson Submarkets Are Strongest This Summer?
Henderson is not one market — it is a dozen master plans with distinct price points and buyer profiles. Green Valley and Green Valley Ranch remain the family-demand core in the $500,000-$700,000 band. Anthem and Sun City Anthem anchor the 55-plus and view-lot demand above $600,000. Seven Hills and MacDonald Highlands carry the guard-gated luxury tier from $900,000 well past $3 million. Cadence and Inspirada drive the newer, more affordable new-construction demand in the $400,000-$550,000 range.
According to Las Vegas REALTORS submarket data, the fastest-absorbing Henderson zones in June were the established Green Valley and Whitney Ranch neighborhoods, where correctly-priced resale homes under $500,000 cleared in the low-to-mid-20-day range. The slowest were the ultra-luxury hillside estates above $2 million, which is normal for that tier at any point in the cycle. For families, our Henderson buying guide breaks down each village in detail.

What Are Mortgage Rates Doing for Henderson Buyers?
According to the Freddie Mac PMMS, the 30-year fixed conventional rate held in a 6.5%-6.8% band through June 2026, averaging about 6.6%. The 10-year Treasury yield that heavily influences mortgage pricing stayed range-bound between 4.1% and 4.5%, keeping rates remarkably stable versus the wide swings of 2023 and 2024.
Run the carrying-cost math on Henderson's $480,000 June median with 10% down. The roughly $432,000 loan at 6.6% carries a principal-and-interest payment near $2,760 per month. Layer in property taxes (roughly $250-$350 per month at Henderson's typical effective rate plus any SID/LID bonds), homeowner's insurance (roughly $150-$225 per month), and HOA dues (roughly $50-$300 per month in most master plans, $400-$800 in guard-gated communities), and a realistic all-in payment lands around $3,400-$3,900 per month. According to the Mortgage Bankers Association, each 0.25% rate reduction trims roughly $70-$80 off that median payment and pulls another pool of buyers into the market.
Rate forecasts for the back half of 2026 still point toward a gradual decline into the 6.2%-6.5% range by year-end if inflation keeps cooling. FHA financing runs roughly 20-30 basis points cheaper than conventional, and VA loans run cheaper still for eligible Henderson buyers.
How Is Henderson's Luxury Segment Performing?
The luxury tier ($800,000 and up) behaves differently from the rest of Henderson. According to Las Vegas REALTORS data, roughly 55% of Henderson closings above $1 million involve cash buyers, largely California equity relocators and move-up owners cashing out appreciated homes. That cash dominance insulates the high end from the 6.6% rate environment — a $1.5 million buyer paying cash does not care where the 30-year fixed sits.
Seven Hills, Anthem Country Club, MacDonald Highlands, Ascaya, and Roma Hills remain the top-performing luxury submarkets. Average luxury days on market runs about 58 days, with list-to-sold ratios near 96% — meaning a well-priced $1.2 million Henderson estate typically closes around $1.15 million after negotiation. That 4% negotiating room is the widest in the Henderson market and the clearest opportunity for luxury buyers this summer. For guard-gated and hillside inventory, our luxury and guard-gated communities page tracks current availability.
What Should Henderson Sellers Do in This Market?
The June data tells Henderson sellers one thing above all: price to the sold comps, not the aspirational asking median. With the median list price at $544,648 running roughly $64,648 above the $480,000 median sold price, the sellers waiting on the market are the ones who anchored to spring pricing. Here is what the data shows works:
- Homes priced at or just below the closest comparable sales close in 18-28 days
- Homes priced 6-10% above market sit 45-70 days and typically settle below original ask after reductions
- Professional photography, 3D tours, and light staging sell homes 8-12 days faster
My recommendation to Henderson sellers this summer: list competitively into the $480,000 sold reality, invest in professional presentation, and stay flexible on buyer concessions such as closing-cost credits, a home warranty, or a rate buydown. Across the 9,600+ NREG closings we've represented, that approach reliably maximizes net proceeds and minimizes time on market. Sellers planning a summer exit should review our sellers resources and price into June's data rather than chasing May's peak.
What Should Henderson Buyers Do in This Market?
For buyers, June 2026 is the friendliest Henderson environment in years. At roughly 5.3 months of supply, you finally have:
- Real selection. 2,506 active listings mean genuine choice instead of scarcity.
- Time to decide. A 29-day median pace lets you tour, compare, and inspect without panic.
- Negotiating room. Sellers are accepting contingencies, credits, and repairs that were rejected during the frenzy — especially above $800,000.
- Builder incentives. New construction in Cadence and Inspirada is offering rate buydowns and closing-cost credits worth $15,000-$40,000.
The one factor working against buyers is that Henderson's premium is structural and durable — waiting for prices to fall meaningfully is a risky bet against the city's demographics. According to the Bureau of Labor Statistics regional payroll data, the Las Vegas-Henderson-Paradise MSA has continued adding jobs in healthcare, logistics, and the resort sector, which keeps the $400,000-$800,000 qualifying buyer pool deep. First-time and relocating buyers should lock a fully underwritten pre-approval before touring, and new-construction shoppers should compare builder inventory across the valley against Henderson resale.
What Does the Data Suggest for the Rest of 2026?
Based on the June trends, here is my read on Henderson through the rest of 2026:
- Prices: The median stabilizes in the $475,000-$495,000 band as the mix normalizes; no meaningful decline expected given demographics
- Inventory: Holds near 5-6 months of supply as summer listings work through
- Days on market: Stays in the 27-35 day range into fall
- Rates: Gradual decline toward 6.2%-6.5% by year-end, which would tighten supply again
- Luxury: Cash-driven, rate-insensitive, with 55-58 day pace holding
According to the Clark County Assessor parcel data, Henderson's assessed-value base has continued to climb, reflecting the durable underlying demand even as the monthly median wobbles with mix. The bottom line: this is a healthy, rebalancing Henderson market that rewards well-prepared buyers and correctly-priced sellers. The extremes of 2021-2022 are behind us, and June's normalization is a positive for long-term stability. Call Nevada Real Estate Group at (702) 637-1759 to map this data against your specific Henderson transaction.
Frequently Asked Questions
What is the median home price in Henderson in June 2026?
The median sold price in Henderson is $480,000 as of June 2026, down about 5.9% from May's $510,000. The median list price runs higher at $544,648, and homes sell at a median of $277 per square foot. The decline reflects a normal summer mix shift and pricing normalization, not a value collapse — Henderson still trades at a premium to the roughly $472,000 Las Vegas valley median.
How many homes are for sale in Henderson right now?
Henderson has approximately 2,506 active for-sale listings as of June 2026, up roughly 9.4% from May. Measured against May's complete count of 473 closings, that inventory equals about 5.3 months of supply, placing Henderson at the low end of a balanced market (4-6 months) and giving buyers their widest selection in several years.
How long does it take to sell a house in Henderson?
The median days on market in Henderson is 29 days as of June 2026, up just two days from May's 27. Correctly-priced homes in Green Valley, Whitney Ranch, and Anthem clear in 18-26 days, while listings priced 6-10% above comparable sales can sit 45-70 days before a price reduction. Luxury homes above $800,000 average about 58 days.
Is Henderson a buyer's or seller's market in June 2026?
Henderson is now at the low end of balanced, at roughly 5.3 months of supply. That is a meaningful shift from the deep seller's market of recent years. Sellers still benefit from a fast 29-day median pace, but buyers finally have real selection, time, and negotiating room — especially in the luxury tier above $800,000, where cash buyers negotiate around a 96% list-to-sold ratio.
Why did the Henderson median price drop from May to June?
The $480,000 June median eased from May's $510,000 for three reasons: a heavier share of mid-tier and entry-level closings pulled the median down, 6.6% mortgage rates limited how high buyers could reach against the $544,648 asking median, and the spring frenzy cooled into a normal summer. No individual Henderson home lost 5.9% of its value — the median simply reflects a different mix of what closed.
How does Henderson compare to Las Vegas for home prices?
Henderson's $480,000 June median runs about $8,000, or roughly 1.7%, above the Las Vegas valley's roughly $472,000 median. Henderson also commands about $9 more per square foot ($277 versus $268) and sells about seven days faster (29 versus 36 days). The premium reflects Henderson's newer master plans, higher-rated schools, and lower crime profile.
Are mortgage rates affecting the Henderson market?
Yes. The 30-year fixed rate averaged about 6.6% in June 2026, which trims how high buyers can bid against the $544,648 asking median and contributes to the softer $480,000 sold median. FHA and VA financing run cheaper than conventional. If rates decline toward 6.2%-6.5% by year-end as forecast, expect Henderson supply to tighten again as more buyers qualify.
Disclaimer: This article is for informational purposes only and does not constitute financial or investment advice. Market data is approximate and sourced from publicly available reports including the Las Vegas REALTORS association. Data reflects conditions at the time of publication.
About the Author: Chris Nevada is the owner of Nevada Real Estate Group at LPT Realty, publishing monthly market reports for Henderson and the Las Vegas valley.
Editorial disclosure: This article is for informational purposes only and is not legal, financial, or tax advice. Market data sourced from Las Vegas REALTORS, U.S. Census Bureau, BLS, Clark County, and Freddie Mac as of June 2026. Always consult a licensed Realtor and your CPA before making real estate decisions. Chris Nevada is a licensed Nevada Realtor (S.181401) with Nevada Real Estate Group.
Nevada Real Estate Group | LPT Realty Phone: (702) 637-1759 License: S.181401 8945 W Russell Rd #170, Las Vegas, NV 89148 nevadarealestategroup.com
Which Sources Inform This Henderson Market Report?
According to Las Vegas REALTORS, the closing volumes, median price, days-on-market, and inventory figures in this analysis come from Las Vegas REALTORS monthly MLS statistics for the Southern Nevada market through June 2026. Recorded transaction history, parcel data, and assessed values reference the Clark County Assessor. License and brokerage verification draws from the Nevada Real Estate Division public licensee database.
Macro housing context references the U.S. Census Bureau American Community Survey, the Bureau of Labor Statistics Las Vegas-Henderson-Paradise MSA employment data, the Federal Housing Finance Agency House Price Index, and the Bureau of Economic Analysis state-level personal income data. The mortgage rate environment uses the Freddie Mac PMMS weekly rate series and the Mortgage Bankers Association weekly applications survey.
Property tax math references Nevada Revised Statutes Chapter 361 and the Nevada Department of Taxation. School ratings reference GreatSchools and the Clark County School District annual performance frameworks.
If you would like to walk through how any of this translates to your specific Henderson situation, call (702) 637-1759 or browse the team's about page. Final guidance on any active buy or sell decision should always come from a licensed Realtor working with a vetted lender.