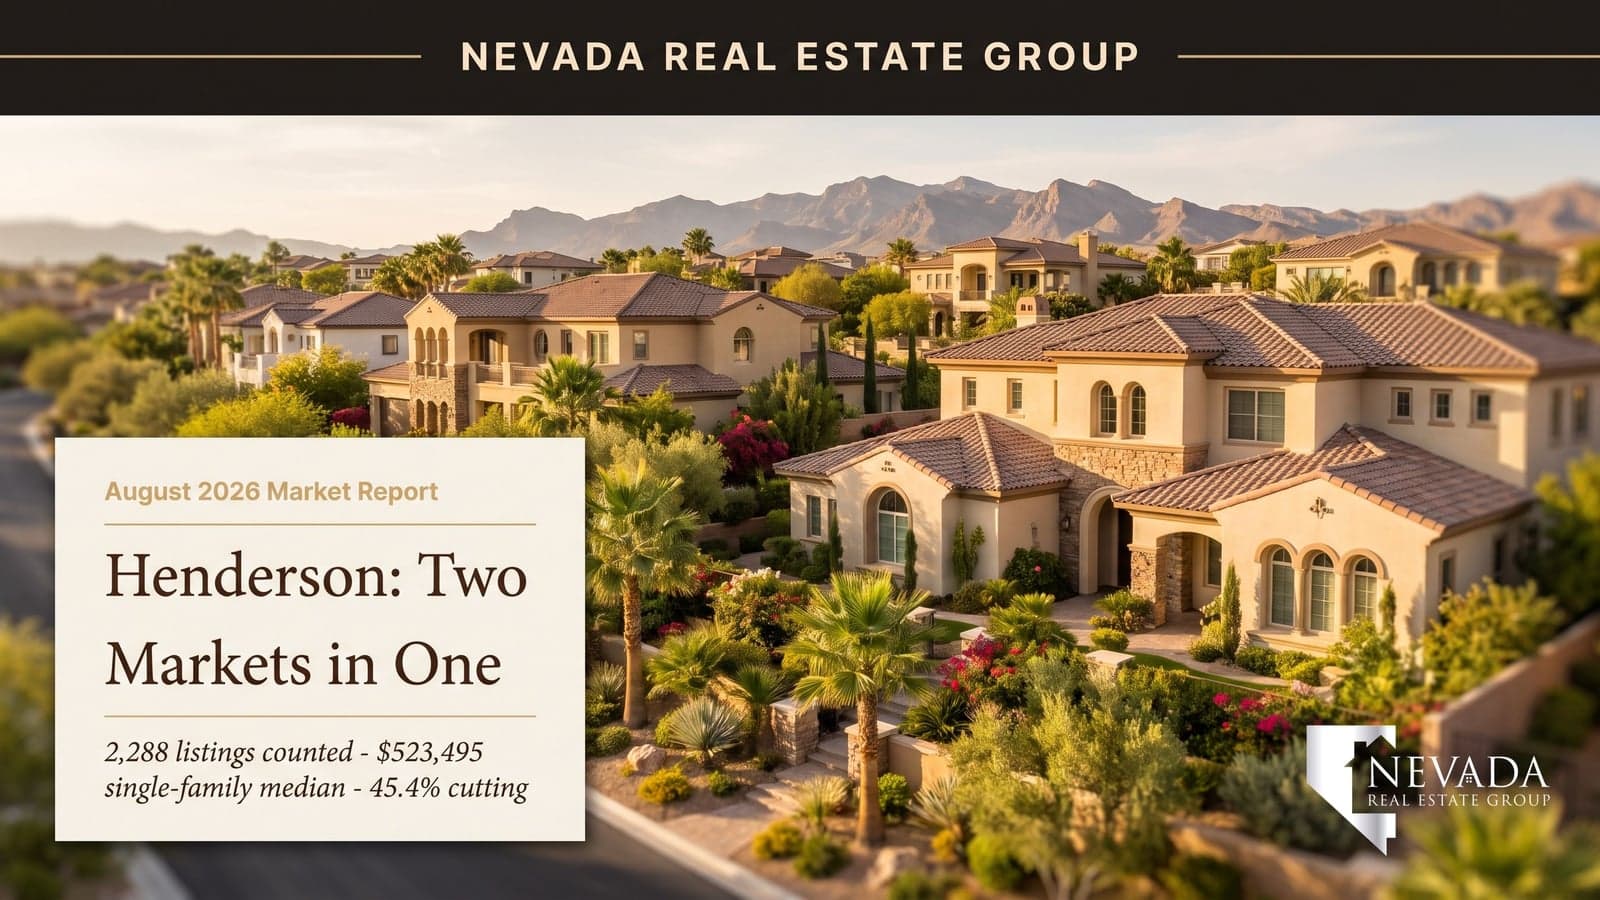

Henderson is running the strangest experiment in Southern Nevada this summer: nearly half its listings are publicly cutting price while its single-family median refuses to fall. Both things are true at once, and the explanation decides how you should buy or sell here this fall.
Every figure below comes from a complete sweep our team ran on August 23, 2026 — all 2,288 active Henderson listings examined individually, plus the 334 July closings that had posted to the GLVAR record by that date; July settled at 476 once the month finished posting (see the restatement below). The whole active board, counted, not sampled.
Henderson in August 2026: 2,288 active listings, 45.4% with at least one price cut (median cut $20,000), yet July's 476 closings (settled September 15) held a $490,000 all-types median and $525,000 for single-family — the valley's stickiest premium. Sales ran 98.8% of list at $256 per square foot with a 38-day median market time, and 60.5% closed below asking. Translation: priced-right Henderson still commands its premium; overpriced Henderson funds it.
Restated September 15, 2026. The July closing figures in this report were counted on August 23, when about 70% of July's sales had posted to the MLS feed; closings keep posting for five to six weeks after a month ends. Fully posted, July shows 476 closings, not the 334 this report originally counted, at a $490,000 median ($525,000 single-family), 98.8% of list, 60.5% below asking, $256 per square foot and a 38-day median clock. The medians moved within a few percent and the conclusions stand; the active-listing figures, counted the same day, are unaffected. The Direct Answer and snapshot table above carry the settled figures; percentages elsewhere in the body reflect the August 23 count. The September 2026 edition of this report carries the settled month in full, and this series now waits for a month to settle before counting it.
- 45.4% of 2,288 active listings have cut price — median reduction $20,000.
- July single-family median: $523,495 — roughly $43,000 above Las Vegas proper.
- 60% of July's 334 closings settled below list; median sale ran 98.9% of asking.
- $257 per square foot — the valley's premium bench outside the Summerlin area.
- 35-day median market time: a week slower than Las Vegas, a reflection of higher price points.
What Are Henderson's Key Housing Numbers for August 2026?
| Metric | Value | Context |
|---|---|---|
| Active listings | 2,288 | Deep selection across every master plan |
| Listings with a price cut | 45.4% | Above Las Vegas proper's 43% |
| Median price cut | $20,000 | The public concession before offers |
| Median active list price | $544,560 | What sellers are asking |
| July closings | 476 (334 posted by Aug 23) | GLVAR records, city of Henderson |
| July median sale — all types | $480,000 | $50,000 above Las Vegas proper |
| July median sale — single-family | $523,495 | The premium that keeps holding |
| Median sale-to-list | 98.9% | Sellers concede about 1.1% at the table |
| Sold below list | 60% | vs 13% above |
| Median price per square foot | $257 | July closings |
| Median days on market | 35 (34 single-family) | A week slower than Las Vegas |
Hold the two headline numbers next to each other: 45.4% cutting, median not budging. In most markets those can't coexist for long. In Henderson they can, because the cuts and the closings are happening to two different sets of homes.
Two framing notes before the sections below lean on these figures. First, every number in the table carries the same window: the active board and its cut share are as of the August 23, 2026 sweep, and the closing statistics cover the 334 sales recorded in July 2026 — so when a later section says "the bench," it means July's $257 per square foot, not a rolling average. Second, the $544,560 median ask against the $480,000 all-types closing median is a $64,560 spread. That is narrower than the Summerlin corridor's $114,000 gap in the same month, but it is wide enough that a buyer who negotiates from the asking board rather than the closing record starts roughly 13% too high before the first counter — and a seller who prices to the asking board is pricing to the tail, not to the money.
Why Are Nearly Half of Henderson Listings Cutting Price While the Median Holds?
Because Henderson has become two markets wearing one ZIP map.
Market one: the priced-right core. Homes in Green Valley, Cadence, and Inspirada that open within sight of the $257-a-foot bench draw their buyer inside five weeks and close at 98.9% of ask. This market sets the median — and it hasn't blinked: bench-priced homes in these three master plans keep closing near asking price, and the 13% of July sales that closed over ask were concentrated in this under-$500,000 turnkey band. If you are pricing a Henderson home, this is the segment to price against first.
Market two: the aspirational tail. Homes priced to 2022 memories or to Summerlin comps that don't transfer. This market produces the 45.4% cut share, the $20,000 median concession, and most of the 60%-below-list closings — and its inventory sits long enough that it never pulls the median down; it simply converges to it, one cut at a time.
In our experience the line between the two markets is about 5% of list price. Open within 5% of the comp bench and you're in market one. Open above it and you've enrolled in market two, where the exit fee currently averages $20,000 plus the weeks.
What Did Henderson Homes Actually Sell For in July?
The 334 closings, examined individually:
- All-types median: $480,000 — exactly $50,000 above Las Vegas proper's July figure, the premium buyers pay for the Henderson package.
- Single-family median: $523,495 in a median 34 days — the number that defines the market. It has drifted only within noise all summer while the cut share climbed, the clearest sign that the premium is demand-backed rather than seller-imagined.
- $257 per square foot median — a 2,200-square-foot Green Valley home "worth" $565,000 by the bench. What the asking price claims above that is condition, lot, or hope.
- 98.9% sale-to-list, 60% below asking, 13% above. The above-list slice concentrates in turnkey sub-$500,000 homes — still genuinely competitive — while nearly everything over $700,000 negotiates.
According to Las Vegas REALTORS, Henderson has carried the metro's most stable pricing through every phase of the 2024–2026 cooldown, and July extended the streak.
The bench turns into a price test with one multiplication. At July's $257 a foot, a 1,800-square-foot Green Valley ranch benches at about $462,600, a 2,200-square-foot two-story at roughly $565,400, and a 3,000-square-foot Anthem home near $771,000 — before the adjustments for lot, view, pool, and condition that, in our experience, move a specific Henderson house 5–10% to either side of the bench. The remaining 27% of July's closings — the ones that settled exactly at list — are the quiet majority of the priced-right core: sellers who opened at the comp and got the comp. That at-list slice is the best evidence in the data that the bench is settled money rather than an average of hopes, and it is the number a seller should picture when deciding where to open.
How Do Henderson's Master Plans Compare Right Now?
The city's market is really a federation of master plans, each behaving differently in August:
| Dimension | Green Valley / GV Ranch | Anthem / Seven Hills | Cadence / Inspirada | Lake Las Vegas / MacDonald Highlands |
|---|---|---|---|---|
| Typical band | $450K–$700K | $550K–$1.5M | $400K–$650K | $700K–$10M+ |
| August speed | Steady — established demand | Selective — view lots move, interiors sit | Fastest — new-construction volume | Slowest — luxury negotiates hard |
| Competition vs builders | None — built out | Minimal | Direct — resale vs incentive sheet | Custom-lot dynamic |
| Buyer leverage | Moderate | Moderate-high above $800K | Lowest under $500K | Highest |
Cadence and Inspirada carry a wrinkle the table understates: resale sellers there compete directly with new construction incentive financing. A resale asking $525,000 sits next to a builder quick move-in advertising a bought-down rate — which is why correctly-priced Cadence resales lean on the things builders can't offer: mature landscaping, window treatments and no six-month wait. Cadence homes carry no SID or LID at all, according to the Cadence FAQ; in Inspirada, a seller who has prepaid the parcel's LID T-18 balance can market that as one less cost for the buyer.
The right-hand column deserves its own paragraph, because above $1 million Henderson negotiates like a different city. Lake Las Vegas, MacDonald Highlands, Ascaya, and Anthem Country Club carry the market's longest timelines and deepest concessions — the 5%-plus-under-ask closings in July concentrated here, and marketing time is measured in months, not weeks. The buyers are real: Henderson's luxury tier keeps drawing California relocation capital, the migration pattern the Nevada State Demographer tracks. But they are scarce, unhurried, and frequently paying cash, which means they answer to no lender's clock. Sellers in this tier should price to the last six months of closed luxury comps rather than the last ninety days, because six months is roughly how long it takes this tier to produce enough closings to read. Buyers get the rare Nevada experience of holding every card — and the discipline that matters is not overplaying them, because the estate that fits is still a scarce object even in a slow month.
Is the Henderson Premium Over Las Vegas Still Justified?
The premium is now roughly $43,000 on the single-family median ($523,495 vs $480,000) and $5 a square foot ($257 vs $252). What it buys is a different city government with its own services and, in the master plans, association rules on design and maintenance. Whether that is worth $43,000 depends on the specific neighborhood, so compare the homes, the dues, any improvement-district assessment and the commute rather than the city label.
Whether that's "worth it" is a household question, not a market one — but the market keeps answering yes: the premium has persisted through rate spikes, inventory surges, and now a 45.4% cut share. Premiums that survive three different stress tests are structural. Our Las Vegas vs Henderson comparison runs the full trade-off, monthly costs included.
The premium is also not uniform, which the ZIP table further down makes plain. In the 90 days ending September 6, 2026, closed medians ran $640,000 in 89052 (Anthem and Seven Hills) and $596,000 in 89012 (MacDonald Highlands and MacDonald Ranch) against $415,000 in 89015 (downtown Henderson and the east side), according to our analysis of Las Vegas REALTORS MLS data via Repliers. A buyer paying "the Henderson premium" is really paying a specific master plan's premium — and the older east side closes under the Las Vegas proper median entirely. Translating the city-wide $43,000 into a payment: at the 6.65% rate in force the week of August 21, 2026, with 10% down, the single-family premium over Las Vegas costs about $248 a month in principal and interest. That is roughly what the two-tier HOA in the master plans charges, which is a fair way to think about what the premium buys — the package, twice.
What Should Henderson Buyers Do With This Market?
The two-market structure hands buyers a clean playbook:
- Decide which Henderson you're shopping. Under $500,000 turnkey: move fast, bid clean — 13% of July sales still closed over ask, concentrated exactly here. Over $600,000: slow down — the leverage is yours.
- Hunt the 45-day tail in the premium bands. Anthem and Seven Hills listings past six weeks with a cut on record are where $20,000-plus negotiations and seller-funded rate buydowns are landing.
- Test asking prices against $257 a foot — then adjust for the specific master plan, because the bench runs higher in Anthem and lower in the older eastern neighborhoods.
- Mind the HOA stack and SID/LID balances. Many Henderson master plans carry two-tier associations, and some, such as Inspirada with LID T-18, add an improvement-district assessment billed separately from property tax; Cadence has none. Both change your real monthly cost; our SID/LID guide covers the map.
- Use the builder incentive sheet as leverage on resales in Cadence and Inspirada — sellers there know exactly what they're competing against.
- Pick the ZIP before the house. The 90-day closed medians in the table below run from $415,000 in 89015 to $640,000 in 89052 — a $225,000 spread inside one city. A buyer with a $500,000 ceiling is realistically shopping three or four ZIPs, not eight; knowing which ones before the first showing is the difference between a focused month and a summer of Saturdays. The Henderson ZIP code guide maps each one to its master plans.
What Should Henderson Sellers Do in September?
One decision dominates: which of the two Hendersons your listing joins on day one.
- Price to the last 90 days of your own master plan's closings — not to the neighbor still sitting from May. The 34-day sales this summer share a single trait: they opened within sight of the bench.
- Lead with what holds the premium — condition, HOA standing, location and any paid-down SID/LID. Henderson buyers are buying the package; sell the package.
- If you're in Cadence or Inspirada, answer the builder up front: your landscaping, your upgrades, your no-wait move-in, priced honestly against their incentive math.
- Budget the concession before you list. With 60% of sales closing below ask, the median seller is giving about 1.1% at the table. Plan it, or improve on it with sharper opening pricing — the sellers who concede nothing are the ones who priced right first.
Put actual numbers on that concession budget, because Henderson sellers keep discovering it too late. On the $523,495 single-family median, the 1.1% at-table concession is about $5,760. A listing that opens 8% above the bench and takes the median $20,000 public cut before it draws an offer gives up that $20,000 plus the same $5,760 at the table — and then, past the 45-day mark, faces the $13,000–$15,000 buydown request that has become routine on aged listings this summer. The sum is roughly $40,000 of concessions that the correctly priced neighbor never paid, on a house that closes at the same bench either way. September's calendar leaves room to get this right once; it does not leave room to get it wrong twice before the holiday slowdown.
How Does Henderson Compare to Its Neighbors This Month?
The regional picture puts Henderson's numbers in relief. Las Vegas proper runs faster (29 days) and cheaper ($252 a foot) with a slightly lower cut share; North Las Vegas is the valley's sprint market — 100% median sale-to-list in 18 days at $234; the Summerlin area is Henderson's premium rival at $286 a foot but with a heavier 47.5% cut share as its luxury tier corrects; and Boulder City, Henderson's small neighbor, runs on scarcity — 141 total listings and a dozen closings a month at $325 a foot. Henderson's position in the set is distinctive: the highest-stability premium and the most two-speed internal market.
The full August scoreboard, from the same-day sweeps across this series: Las Vegas proper carried 8,170 active listings on August 23 with 43% cut at a $19,901 median, and its 991 July closings ran a $430,000 all-types median at 98.8% of list with 59% below asking. North Las Vegas carried 985 actives with 39.3% cut at a $10,100 median — the valley's smallest — and its 173 July closings ran $419,900 with 23% of sales over ask. The Summerlin corridor's 1,673 actives ran a 47.5% cut share at a $25,000 median, with 240 July closings at $525,000 and 69% below list. Boulder City's 141 listings and twelve July closings at $425,000 round out the set. Against all of that, Henderson's 45.4% cut share sits second-highest in the valley, but its 60% below-list share is mid-pack and its $20,000 median cut is ordinary — the statistical fingerprint of a market where the cutting is concentrated in a tail rather than spread across the board. According to Las Vegas REALTORS, the association's monthly statistics blend every GLVAR closing in the metro into one headline, which is exactly why a Henderson decision needs the city-level count rather than the valley average: the average is made of four cities that behave differently, and Henderson is the one whose median refuses to follow its cut share.

How Do the ZIP Codes Inside Henderson Compare?
City-wide medians hide the fact that Henderson's eight residential ZIP codes run three different markets. To put numbers on the split, we pulled each ZIP's active board and its closings for the 90 days ending September 6, 2026, according to our analysis of Las Vegas REALTORS MLS data via Repliers. All property types are included, ZIP boundaries do not match city limits exactly (89011 and 89012 reach into unincorporated Clark County), and the closing window is a rolling 90 days rather than July alone — so read these rows against each other, not against the July table above.
| ZIP | Area | Active listings | Median ask | Closed (90 days) | Median closed | Median DOM |
|---|---|---|---|---|---|---|
| 89052 | Anthem / Seven Hills | 381 | $675,000 | 132 | $640,000 | 34 |
| 89012 | MacDonald Highlands / MacDonald Ranch | 342 | $797,000 | 111 | $596,000 | 35 |
| 89044 | Inspirada / south Henderson | 267 | $555,000 | 159 | $525,000 | 36 |
| 89011 | Lake Las Vegas / Cadence / Tuscany | 714 | $530,735 | 209 | $464,990 | 35 |
| 89014 | Green Valley / Whitney Ranch | 169 | $445,000 | 62 | $450,000 | 45 |
| 89074 | Green Valley Ranch | 257 | $499,000 | 109 | $441,500 | 30 |
Three readings. First, 89012 carries the widest ask-to-close gap in the city — a $797,000 median ask against a $596,000 median closing — because MacDonald Highlands' custom lots and estate listings stack the active board while the more modest MacDonald Ranch tract homes do most of the closing; it is the Henderson two-market split inside a single ZIP. Second, 89011 is the deepest board by far at 714 actives, and its $464,990 closed median sits well under its $530,735 ask: the ZIP holds both Lake Las Vegas and Cadence, so its active side carries the resort tier and the builder releases while its closings skew to Cadence and Tuscany resales — the builder-incentive competition described earlier, visible in the numbers. Third, the two older ZIPs left off the table tell the affordability story: 89015, downtown Henderson and the east side, closed 115 sales at a $415,000 median in 31 days from a 307-listing board, and 89002 in the Black Mountain foothills closed 85 at $474,000 in 35 days — both under the city's single-family bench, both moving at or faster than the city clock. The slowest ZIP is a surprise only until you look at the stock: 89014's 45-day median is consistent with Green Valley's original 1980s and 1990s homes, where condition varies house to house and buyers inspect accordingly. For a buyer, the table is a budget map; for a seller, it is the comp set your buyer already has open on their phone.
What Does the Median Henderson Home Cost Per Month?
According to the Freddie Mac PMMS, the thirty-year fixed averaged 6.65% the week of August 21. The $523,495 single-family median, translated to a monthly payment at that rate:
| Down payment | Loan amount | P&I / month | With a seller-funded buydown to 5.9% |
|---|---|---|---|
| 5% ($26,175) | $497,320 | $3,192 | $2,950 |
| 10% ($52,350) | $471,146 | $3,024 | $2,795 |
| 20% ($104,699) | $418,796 | $2,688 | $2,484 |
Add roughly $400–$550 monthly for taxes, insurance, and the typical two-tier master-plan HOA, and the honest all-in on the median Henderson house runs about $3,100–$3,600 at 10% down. The right-hand column is the August-specific opportunity: with 45.4% of the board already cutting, the $13,000–$15,000 credit that funds a rate buydown is a live negotiation on any listing past six weeks — and it moves the payment more than a same-sized price cut would. According to the U.S. Census Bureau, Henderson's median household income leads the metro, which is precisely why its payment ceiling — and therefore its price floor — sits where it does.
Two ownership-cost facts round out the table. According to the Nevada Department of Taxation, the property-tax bill on an owner-occupied primary residence in Nevada cannot rise more than 3% a year under the state's partial abatement — so the tax line inside that $400–$550 estimate is the one housing cost in Henderson that is effectively capped, which matters over a ten-year hold in a way the first-year number understates. And the 5%-down row is in the table because it is the row most first-time Henderson buyers actually use: the $26,175 down payment is within reach of a household that has been renting at $2,300–$2,600, while the $3,192 payment it produces is precisely the gap the seller-funded buydown was designed to close — $242 a month, on the median house, paid for by the 45.4% of sellers who are already conceding.

How Has Henderson Shifted Since the June Report?
Two months ago, our June Henderson report described a market drifting toward balance. August's full-board sweep shows the drift has become a settled state. The June report's own figures make the comparison concrete: it printed 2,506 active listings, a 29-day median market time, a $544,648 median list price, and a $480,000 median sold price. Against August's sweep — 2,288 actives, 35 days, a $544,560 ask, and a $480,000 all-types July median — the board thinned by roughly 9%, the clock stretched six days, and both the asking median and the closing median held to within a rounding error. Fewer listings, slower sales, flat prices: that is a market clearing its overpriced tail rather than repricing its core, and three dials moved inside it:
The cut share climbed into the mid-forties. What was an emerging pattern in early summer is now the market's defining statistic — 45.4% of the entire board has conceded at least once. According to Las Vegas REALTORS, metro-wide reductions followed the same arc, but Henderson's version comes with a twist no other submarket shows: the closing median didn't move with it.
Market time stretched a week. The July median of 35 days sits noticeably above the low-twenties clip of spring. That extra week is not weakness spread evenly — it is the aspirational tail sitting longer while bench-priced homes still clear in five weeks. Averages blur; the split is the story.
Buyer concessions became the norm above $600,000. According to the National Association of REALTORS, concession frequency has risen nationally through 2026, and Henderson's premium bands now mirror it: closing-cost credits and rate buydowns appear in a majority of the over-$600,000 contracts our team has seen this summer.
What did NOT move is the number that matters most: the single-family closing median. Three months of rising cut share, flat median. Markets do not hold that pattern forever — eventually the cut share retreats (sellers wise up) or the median follows (demand thins). September's report will say which way Henderson broke; if you are timing a move, that is the single number to watch.
The seller timeline this creates, concretely: list in early September priced to your master plan's trailing-90-day closings, expect first-weekend traffic if you're within 5% of the bench, field an offer at 98–99% of ask inside five weeks, and close by mid-October — before the holiday slowdown thins the buyer pool. Miss the bench by 8% and the same calendar reads: cut $20,000 in early October, re-enter a colder market, and close in December at the price September offered. According to the seasonal patterns in FHFA's price data, the fourth quarter rarely rescues an overpriced fall listing — the market you list into in September is the best one left this year.
What Does This Mean for Your Henderson Move?
Buying: know which Henderson you're in before you write — speed under $500K, patience and leverage above $600K, and always the $257 bench test. Selling: the market is still paying the premium, but only for day-one honesty; the $20,000 median cut is the price of finding out slowly. Watching: if the single-family median ever starts following the cut share downward, that's the regime change — it hasn't yet, and we'll flag it here the month it does.
One more August-specific note for anyone weighing Henderson against renting: at the $2,300–$2,600 the typical three-bedroom Henderson rental now commands, the gap to the $3,024 median-home payment is the narrowest it has been since rates spiked — and unlike the rent, the payment buys roughly $4,700 of first-year principal, the 3%-capped property-tax trajectory Nevada owners enjoy, and a seller-funded buydown away from closing under $2,800. Renting still wins short timelines; past three years, the arithmetic has quietly flipped back. And for sellers reading the same comparison from the other side: every month the rent-vs-buy gap narrows, another slice of Henderson's renter households converts to buyer demand at the entry bands — which is a large part of why sub-$500,000 turnkey listings keep drawing 13% of sales over asking while the rest of the market negotiates. The demand floor under this market is not speculative money; it is households doing this exact monthly math and picking the mortgage.
Henderson specifics, street by street: (702) 637-1759 · current Henderson inventory · what your home would bring.
Frequently Asked Questions
What is the median home price in Henderson in August 2026?
July closings ran $480,000 across all property types and $523,495 for single-family homes — the latter roughly $43,000 above Las Vegas proper. The median active listing asks $544,560, and the gap between asking and closing is being resolved mostly through the 45.4% of listings cutting price.
Why are so many Henderson listings cutting price if the median isn't falling?
Because the cuts and the closings happen to different homes. Priced-right listings sell near the $523,495 bench and set the median; overpriced listings cut ($20,000 at the median), sit, and eventually converge to the same bench. The median holds because demand at the bench is real — the cut share measures seller optimism, not falling values.
Is Henderson more expensive than Las Vegas?
Yes — about $50,000 on the all-types July median and $5 per square foot ($257 vs $252). The premium buys a separate city government with its own services and, in the master plans, association rules on design and maintenance. It has held through every market phase since 2024, which is the market's way of calling it structural.
How long does it take to sell a Henderson home right now?
The July median was 35 days (34 for single-family) — about a week slower than Las Vegas proper, reflecting higher price points. The spread matters more than the median: bench-priced homes go under contract inside five weeks; aspirational pricing adds a $20,000 cut and restarts the clock.
Are Henderson sellers negotiating in August 2026?
Measurably: 60% of July closings settled below list, the median at 98.9% of asking, and 45.4% of active listings have already cut publicly. Concessions concentrate on listings past 45 days — closing-cost credits and rate buydowns in the $10,000–$20,000 range are routine asks there, while fresh turnkey listings under $500,000 still hold firm.
Which Henderson communities are selling fastest?
Cadence and Inspirada lead on velocity — newer stock and entry points near $400,000–$650,000 — with established Green Valley close behind. The luxury tier (Lake Las Vegas, MacDonald Highlands, Ascaya) runs slowest, with months-long timelines and the deepest negotiations. Speed in Henderson is almost perfectly inverse to price band.
Is now a good time to buy in Henderson?
For buyers targeting the $550,000-plus bands, conditions are the best in years — 45.4% of the board cutting, 60% of sales closing under ask, and sellers funding rate buydowns. Under $500,000, it's a fair-but-competitive market where clean offers still win. Either way, the $257-a-foot bench and each master plan's own comp set are the tools; the city-wide headline is just the weather report.
How Was This Report Built?
The same discipline as every report in this series: we counted, we didn't sample. The complete 2,288-listing active board was swept on August 23 with each listing's original asking price compared against its current one — that is where 45.4% and the $20,000 median cut come from. Every July closing posted by August 23 (334; 476 once the month settled) was individually ratioed, sale price against final list — that is where 98.9% and the 60%-below-list figure come from. A four-page sample of the same board, sorted oldest-first, would have read 63% cut share — samples flatter whatever sorts first, which is why this series doesn't use them. Where an official association metric is cited, it is theirs and labeled; where the number was counted off the board, this section is the receipt. Across the 9,600-plus closings Nevada Real Estate Group has represented, the single most reliable market signal has been this one: when the full-board cut share and the closing median disagree, believe the median — it is made of settled money, not asking prices.
The ZIP-level table is the one addition to the method this month, and it uses a different window on purpose: active counts as of September 6, 2026, and closings for the 90 days ending that date, pulled ZIP by ZIP through the same Repliers MLS access and including every property type. A rolling 90 days gives each ZIP enough closings — 62 to 209 — to print a median worth reading, which a single month at ZIP level would not. Where the ZIP figures and the July city-wide figures disagree, the window and the boundary are the reasons, and both are labeled so you can tell which is which.
Which Sources Inform This Henderson Market Report?
- Full GLVAR feed sweep, August 23, 2026 — all 2,288 active Henderson listings and all 334 July closings, examined individually via NREG's Repliers MLS access
- ZIP-level pull, September 6, 2026 — active counts and 90-day closings for Henderson ZIPs 89002 through 89074, via NREG's Repliers access to Las Vegas REALTORS MLS data
- Las Vegas REALTORS — metro statistics and stability context
- City of Henderson — municipal services and development
- Freddie Mac PMMS — the 6.65% rate environment
- Clark County Assessor — parcel and tax context
- Nevada Department of Taxation — property-tax and demographic context
- U.S. Census Bureau — household growth
- NAR — national benchmarks
- National Association of Home Builders — builder incentive trends
Methodology: cut share measured on the complete 2,288-listing active board (original vs current list price); sales measured on all 334 GLVAR-recorded July closings in the city of Henderson. Not an appraisal of any individual home.