
Boulder City's market report requires a different kind of honesty than the rest of the valley's. When Las Vegas closes 991 sales in a month, medians mean something precise. When Boulder City closes twelve, every statistic needs its sample size printed next to it — and we will, because a small market misread is a five-figure mistake.
Every figure below comes from the complete sweep our team ran on August 23, 2026: all 141 active Boulder City listings, examined individually, and the 12 July closings that had posted to the GLVAR record by that date; July settled at 16 once the month finished posting (see the restatement below). Small numbers, fully counted.
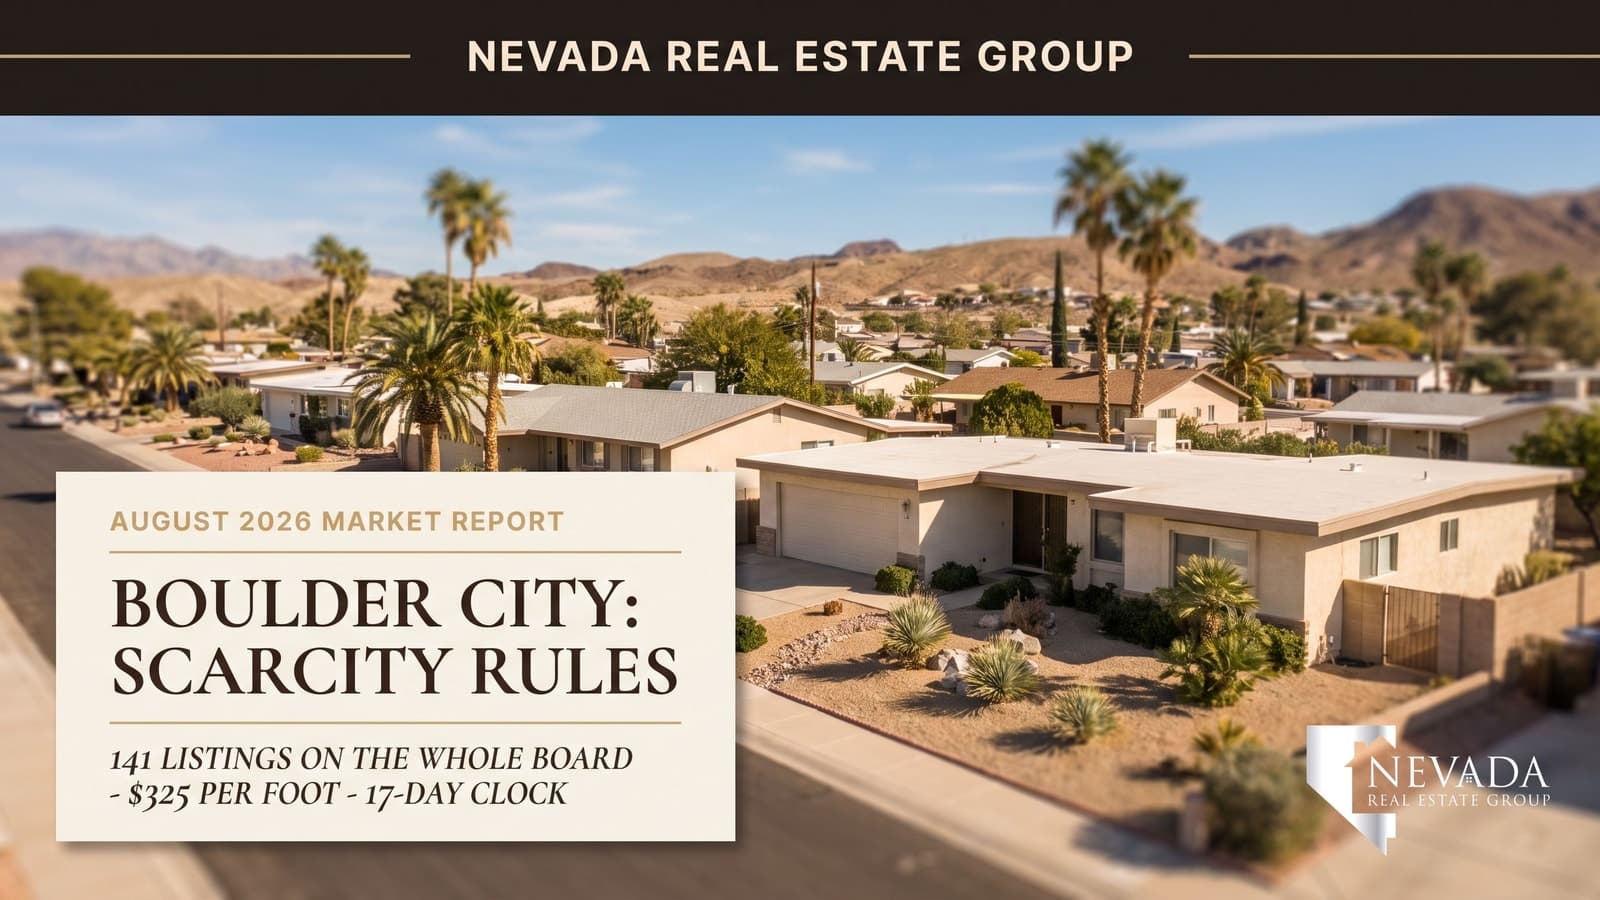
Boulder City in August 2026: 141 active listings, Southern Nevada's smallest city board, with 36.9% carrying a price cut at a $17,900 median. July produced 16 closings once settled (12 had posted by August 23) at a $442,500 median ($457,000 single-family) and $294 per square foot, still the valley's highest city bench. Eleven of sixteen closed below asking at 98.2% of list, in 25 days. Scarcity keeps values firm; thin volume makes every negotiation its own market.
Restated September 15, 2026. The July closing figures in this report were counted on August 23, when about 70% of July's sales had posted to the MLS feed; closings keep posting for five to six weeks after a month ends. Fully posted, July shows 16 closings, not the 12 this report originally counted, at a $442,500 median ($457,000 single-family), 98.2% of list, 68.8% below asking, $294 per square foot and a 25-day median clock. The medians moved within a few percent and the conclusions stand; the active-listing figures, counted the same day, are unaffected. The Direct Answer and snapshot table above carry the settled figures; percentages elsewhere in the body reflect the August 23 count. The September 2026 edition carries the settled month in full, and this series now waits for a month to settle before counting it.
- 141 active listings city-wide — Boulder City's no-growth ordinance caps supply by law.
- July: 12 closings at a $425,000 median and $325 per square foot — the valley's highest bench.
- 9 of 12 July sales closed below asking (98.2% median sale-to-list); the 17-day median clock is deceptively fast.
- 36.9% of listings have cut price — a $17,900 median concession before offers.
- Small-market rule: with n=12, comps beat medians — price each home against its three true peers.
What Are Boulder City's Numbers for August 2026?
| Metric | Value | Sample / context |
|---|---|---|
| Active listings | 141 | The full board — smallest city market in the valley |
| Listings with a price cut | 36.9% | 52 of 141 — below every big-city share |
| Median price cut | $17,900 | Among the 52 cut listings |
| Median active list price | $445,000 | Across all 141 |
| July closings | 16 (12 posted by Aug 23) | Read every July stat with this n |
| July median sale — all types | $425,000 | n=12 |
| July median sale — single-family | $440,000 | 19-day median |
| Median sale-to-list | 98.2% | 9 of 12 below ask, 1 above |
| Median price per square foot | $325 | $39 above Summerlin, $73 above LV proper |
| Median days on market | 17 | For homes that closed — survivorship applies |
Two numbers define this market against every neighbor: 141 and $325. The first is why the second exists.
Two framing notes before the sections below lean on these figures. First, the windows: the active board, its 36.9% cut share, and the $445,000 asking median are as of the August 23, 2026 sweep, and every closing statistic comes from the 12 sales recorded in July 2026 — a sample small enough that this report also pulls a 90-day window further down, precisely so the July figures can be checked against something sturdier. Second, the $445,000 median ask against the $425,000 July closing median is a $20,000 spread, about 4.7% — the narrowest ask-to-close gap of any Southern Nevada city this month except North Las Vegas, and a fraction of Henderson's $64,560 or the Summerlin corridor's $114,000. Boulder City's sellers are not, as a group, anchored far above the record; the 36.9% who cut are a minority correcting individually, and the majority of the board is priced within sight of where the town actually clears. That is the difference between a scarce market and an overpriced one, and it is why the town's bench survives corrections that reprice its neighbors.
Why Is Boulder City's Price Per Square Foot the Valley's Highest?
Because Boulder City is the only Southern Nevada city that decided, on purpose, not to grow. The controlled-growth ordinance — in force since 1979 — caps residential permits at a trickle, per the City of Boulder City, and the result after four decades is the valley's only genuinely fixed-supply market: no master-plan pipeline, no builder releases repricing the resale board, no incentive sheets to compete against. When supply cannot respond to demand, price does — permanently.
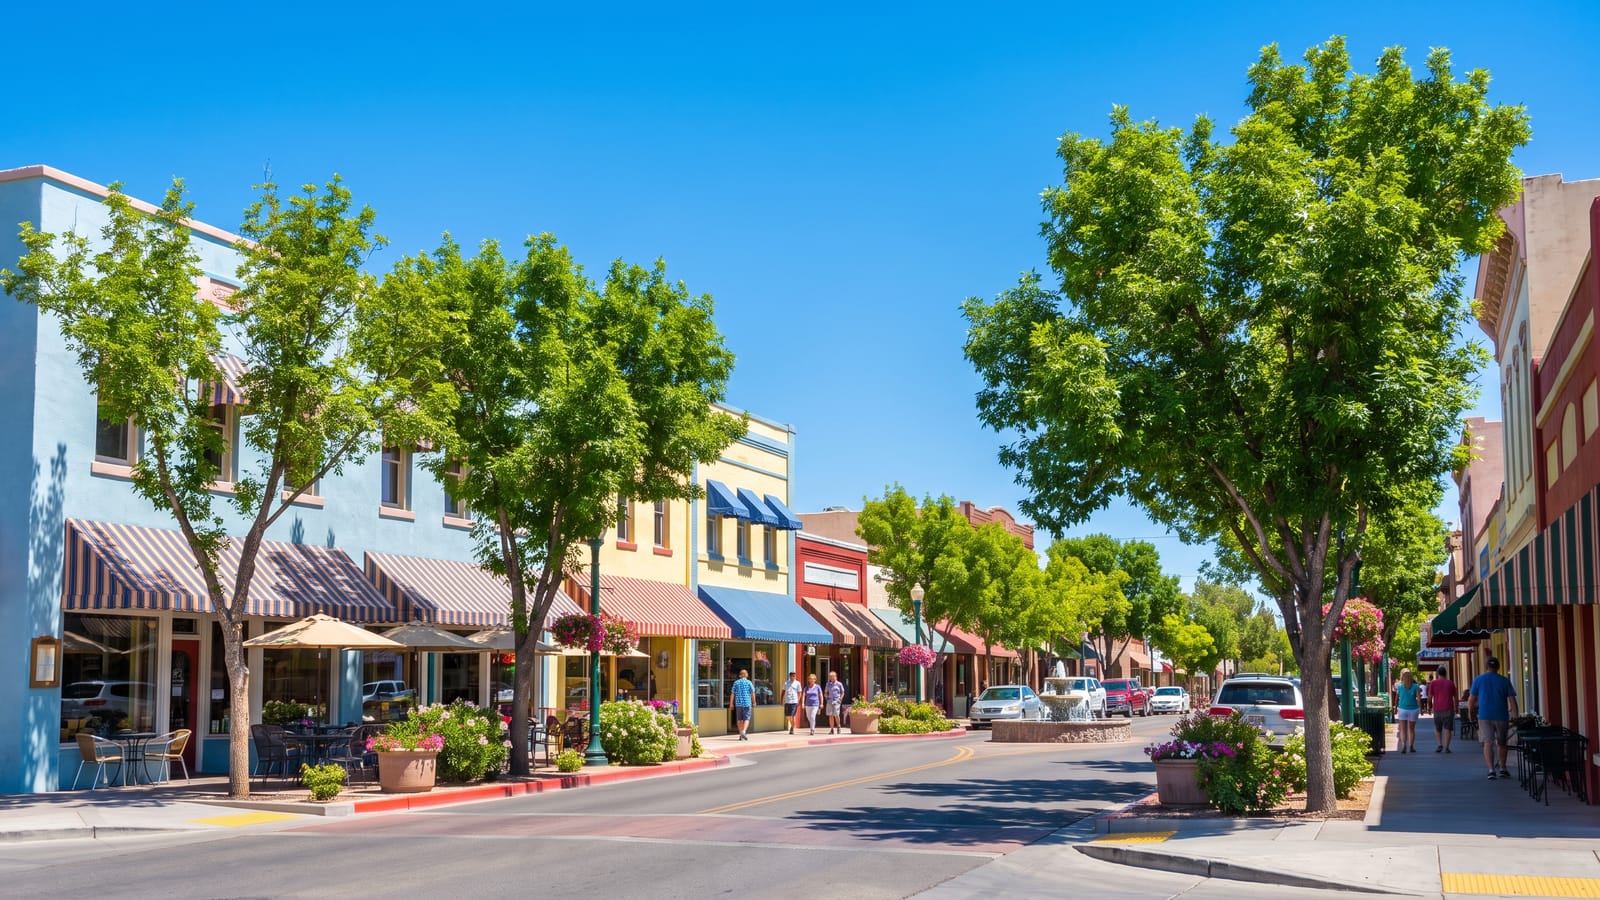
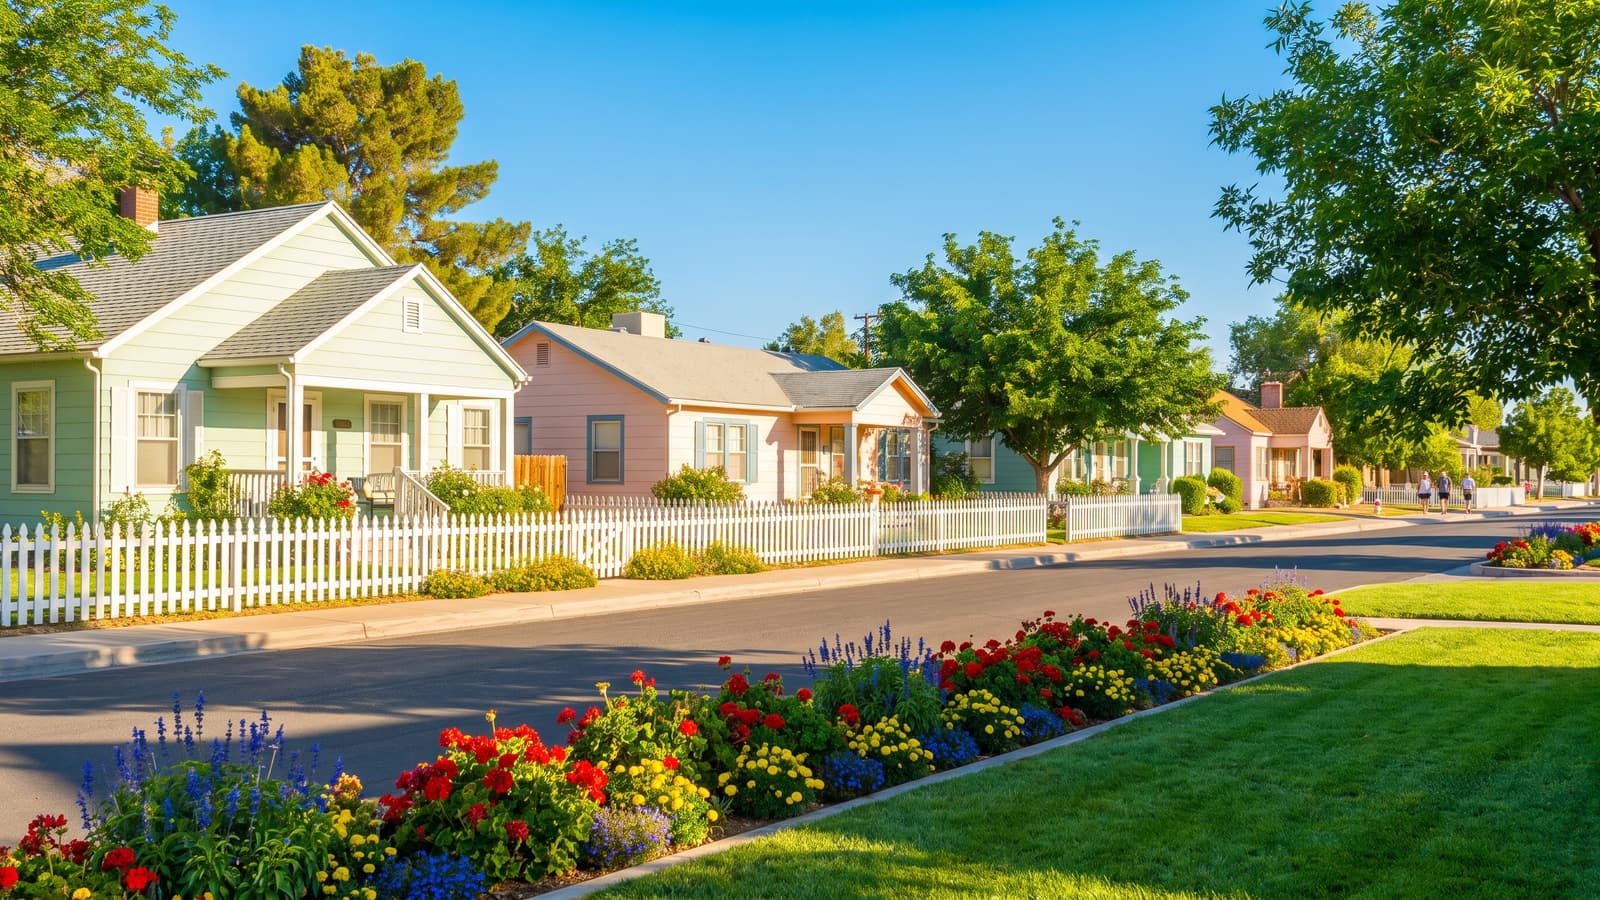
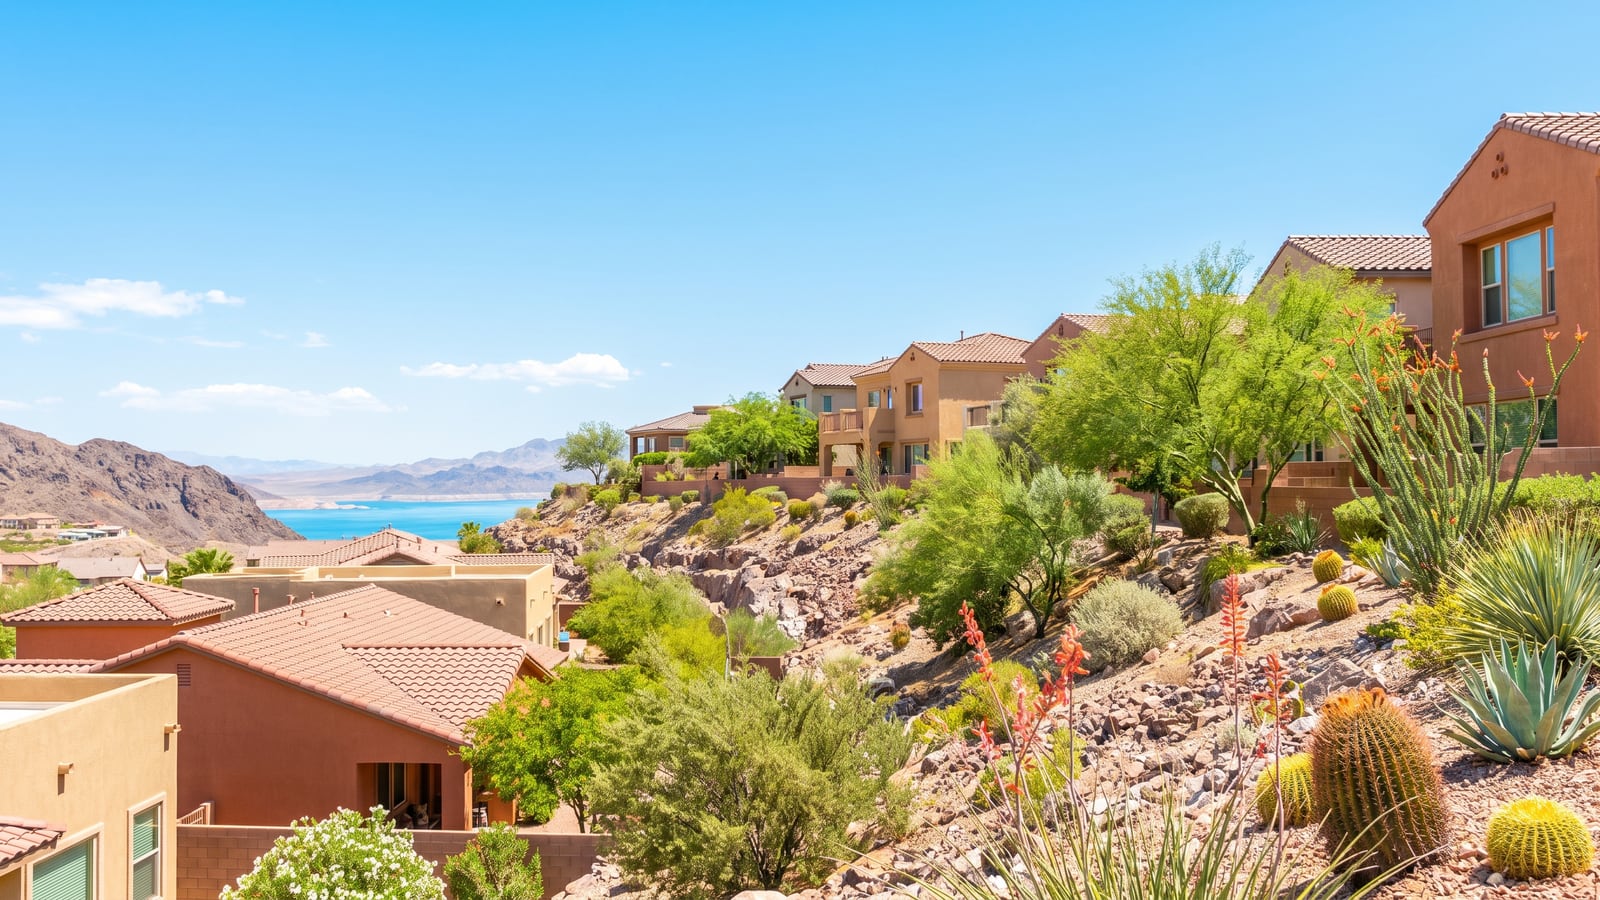
What the $325 bench actually buys explains the rest: historic-district bungalows a walkable block from a real downtown, mid-century stock on mature tree streets the rest of the valley never grew, hillside customs with Lake Mead views, and a small-town texture — no gaming within city limits, by charter — that Southern Nevada cannot manufacture anywhere else. According to the National Park Service, Lake Mead National Recreation Area logs millions of visits a year; Boulder City is the town those visitors drive through and quietly decide to retire to.
In our experience the premium is not a luxury premium — most of this housing stock is modest by valley standards. It is a scarcity-and-character premium, and those hold value differently: they don't spike with booms, and they don't crater with corrections. The 2026 valley-wide repricing has touched Boulder City most gently of all.
The ordinance's other effect is what it does to new construction, and it is worth a paragraph precisely because of how little it changes. The city allows a small annual permit allocation, and the handful of new homes that clear the cap each year — mostly hillside customs and small infill projects — arrive pre-sold or sell immediately at premiums to the bench. Their scarcity value compounds the resale market's rather than competing with it. This is the inverse of every other valley city's dynamic: in Henderson or North Las Vegas, a builder release reprices the resales around it downward; in Boulder City, each rare new build re-anchors the ceiling upward. Buyers hoping to wait for new supply here are waiting for something the city charter has spent five decades making sure never arrives in volume, and sellers of the town's best-located lots can price accordingly.
What Did Boulder City Homes Actually Sell For in July?
All twelve closings — and with a sample this size, the distribution teaches more than the median:
- Median sale: $425,000 all types, $440,000 single-family. With n=12, one lakeview custom or one dated bungalow swings these figures $20,000 either way — treat them as the month's center of gravity, not a law.
- $325 per square foot median — this figure is sturdier than the price median, because the per-foot bench has held in a tight band all year across every month's small sample. It is the number to test any Boulder City asking price against.
- Nine of twelve closed below asking, a 75% below-list share that reads more buyer-favorable than the big cities — but at a modest 98.2% median ratio. Boulder City sellers concede, and concede small: the typical discount ran under $9,000.
- 17-day median market time, with survivorship bias in full force. The homes that closed were the accurately priced ones. The 141-listing active board carries plenty of nine-month veterans priced to sentiment; they simply don't appear in a closing statistic.
The bench turns into a price test with one multiplication, and in a market this thin it is the only test that has enough data behind it. At July's $325 a foot, a 1,200-square-foot historic-district bungalow benches at about $390,000, a 1,600-square-foot central ranch at roughly $520,000, and a 2,400-square-foot hillside home near $780,000 — before the adjustments for view, vintage, and renovation state that, in our experience, move a specific Boulder City house 10% or more to either side of the bench, a wider band than any master-plan city because no two houses here are the same house. The twelve-sale distribution fills in the rest: nine below asking, one above, two exactly at list. That single over-ask sale is the historic-district dynamic in miniature — the one product the town cannot make more of, meeting the one buyer who had been waiting for it.
How Do Boulder City's Neighborhoods Differ?
Small city, distinct micro-markets:
| Dimension | Historic district | Central mid-century | Hillside / view corridor | Lake Mead adjacent |
|---|---|---|---|---|
| Typical band | $400K–$700K | $350K–$500K | $550K–$1.2M | $500K–$1.5M+ |
| Stock character | 1930s–50s bungalows, walkable | Ranch homes, mature streets | Customs, elevation, views | View premiums, larger lots |
| August behavior | Fastest — scarcest supply | The town's volume core | Patient, negotiation-friendly | Slowest, deepest discounts |
| Buyer profile | Character hunters, downsizers | Families, retirees | View buyers, second homes | Retirees, lake lifestyle |
The historic district is the town's supply-and-demand knot at its tightest: a fixed number of bungalows, a national trend toward exactly that product, and turnover measured in years. When one lists correctly, 17 days is generous. The view corridors run the opposite clock — six-figure spreads between neighboring asks, patient sellers meeting patient buyers, and the deepest cuts on the board when patience runs out.
Because the whole town shares one ZIP code, 89005, the neighborhood split cannot be read off the MLS the way Henderson's can — but the ZIP itself can be read over a longer window, and the longer window is instructive. In the 90 days ending September 6, 2026, according to our analysis of Las Vegas REALTORS MLS data via Repliers, 89005 carried 154 active listings at a $449,500 median ask, and closed 43 sales at a $480,000 median in a 46-day median market time. Set those against July alone — twelve closings at $425,000 in 17 days — and the difference is the whole small-market lesson: over a quarter, the town's closed median sits $55,000 higher than July's and its clock runs nearly a month longer, because the quarter captures the lakeview and hillside closings that a single month happens to miss. Neither figure is wrong. The July number is what sold last month; the 90-day number is what the town sells.
Who Is Buying in Boulder City Right Now?
Three buyer streams, none of them speculative. Retirees and near-retirees remain the volume — drawn by the small-town scale, the safety profile, and Lake Mead at the doorstep; according to the U.S. Census Bureau, Boulder City's median age runs far above the valley's, and its household stability with it. Henderson equity movers are the growth stream: sell the master-plan house at Henderson's $523,495 bench, buy character and quiet fifteen minutes east, bank the difference. Remote and hybrid workers round it out — the buyers for whom the 25-minute drive to Henderson's job base is a twice-a-week rounding error against small-town living.
What's conspicuously absent: investors. Thin rental stock, no short-term-rental economy to speak of, and appreciation that grinds rather than spikes. Boulder City is bought to be lived in, which is precisely why its values behave.
The Henderson equity-mover stream deserves its own arithmetic, because it reads differently depending on which Henderson the seller is leaving. In the 90 days ending September 6, 2026, closed medians in the four Henderson ZIPs that border the town ran $596,000 in 89012 (MacDonald Highlands and MacDonald Ranch), $474,000 in 89002, $464,990 in 89011 (Lake Las Vegas and Cadence), and $415,000 in 89015 — according to our analysis of Las Vegas REALTORS MLS data via Repliers. A seller leaving 89012 at its median and buying Boulder City's $480,000 quarterly median frees roughly $116,000 before the HOA line disappears; a seller leaving 89002 or 89011 is making a nearly lateral move, buying character and quiet rather than banking cash; and a seller from 89015 is stepping up. The equity-mover story is real, but it is a story about the premium Henderson ZIPs specifically, and a household in east Henderson should run the numbers before assuming the move pays for itself.
What Should Boulder City Buyers Do in This Market?
Small-market rules, which invert several big-city instincts:
- Comp against true peers, not the median. With twelve monthly closings, the "market price" of a hillside custom is the last three hillside customs — pull them specifically and weight the $325 bench by micro-location.
- Be ready to wait, then be ready to sprint. The right historic bungalow may not list for months; when it does, the 17-day clock applies to you. Set the alert now, tour within 48 hours. Our saved-search alerts watch the 141-listing board so you don't refresh it daily.
- Negotiate the veterans. A third of the active board has sat past 60 days — sentiment-priced view homes and estates where a 5–8% conversation is realistic. The 52 already-cut listings mark themselves.
- Budget for the housing stock's age. Much of the charm is 1940–1975 construction: galvanized plumbing, original electrical panels, and roofs on their second or third act. The inspection is not a formality here; it is the negotiation.
- Know the flood and lake factors. Elevation spares most of the town, but according to FEMA's flood mapping, specific washes carry designations that move insurance costs — check the parcel, not the reputation.
- Price the town against the Henderson ZIPs next door before committing to it. The comparison table below shows what the same 90-day window closed at across the border: $415,000 to $596,000 depending on the ZIP. If the house you want in Boulder City benches near $480,000, the honest question is whether it is worth the $65,000 over 89015's median or the $116,000 under 89012's — and the answer is a lifestyle answer, which is fine, as long as it is made with the numbers open.
What Should Boulder City Sellers Do in September?
- Price to the bench and your three true peers — $325 a foot, adjusted for view, vintage, and renovation state. The 36.9% who cut anchored to an heirloom number instead; the market subtracted $17,900 and the calendar took the rest.
- Sell the town as hard as the house. Your buyer is buying Boulder City first — the walkable downtown, the no-casino charter, the lake — and your specific address second. Photography that leads with the porch and the street outperforms the granite-countertop opener here.
- Respect the thin-market calendar. With roughly a dozen buyers closing monthly, a mispriced launch doesn't cost you a weekend as it would in North Las Vegas — it can cost a season. The first two weeks of exposure to this small, attentive buyer pool are the listing.
- Prep the systems disclosure early. Boulder City buyers expect vintage-home issues; documented service history and a pre-listing inspection convert "what's lurking" anxiety into a clean negotiation.
Put numbers on the concession budget, because in a thin market the calendar is the expensive part. On the $440,000 July single-family median, the 98.2% at-table ratio is a concession of about $7,900 — modest, and consistent with the under-$9,000 typical discount in July's closings. A listing that opens to sentiment instead takes the $17,900 median public cut first, then gives the same $7,900 at the table, and spends the weeks in between watching the dozen buyers who close each month choose something else. Roughly $26,000 of concessions and a season of exposure, against the correctly priced neighbor's $7,900 and 17 days. In Henderson a mispriced launch costs a weekend; here, with a buyer pool this small and this attentive, the first two weeks are the listing, and the fall window — historically when the view-corridor standoffs resolve — is the last deep pool of the year.
How Does Boulder City Compare to the Valley This Month?
Run the four-city August scoreboard and Boulder City is the outlier on every line: the highest bench ($325 against Summerlin's $286, Henderson's $257, LV's $252), the lowest cut share (36.9%), the thinnest board (141 listings), and — with honest survivorship caveats — a 17-day closing clock that matches North Las Vegas's sprint. It is what a fixed-supply market looks like in a correcting metro: insulated, illiquid, and stubbornly valuable. The trade is liquidity for stability — Boulder City owners ride out valley corrections that master-plan owners feel, and pay for it in the months it can take to sell when they finally do.
The rest of the scoreboard, from the same-day sweeps across this series, shows how far outside the valley's pattern the town sits. Las Vegas proper carried 8,170 active listings on August 23 with 43% cut at a $19,901 median, and its 991 July closings ran a $430,000 all-types median at 98.8% of list with 59% below asking in 29 days. Henderson carried 2,288 actives with 45.4% cut at a $20,000 median; its 334 closings ran $480,000 at 98.9% with 60% below list in 35 days. The Summerlin corridor's 1,673 actives ran a 47.5% cut share at $25,000, with 240 closings at $525,000 and 69% below list. North Las Vegas's 985 actives ran 39.3% at $10,100, and its 173 closings hit a full 100% of list with 23% over ask in 18 days. Boulder City's 141 listings would be a rounding error on any of those boards, and its twelve closings a slow afternoon in Henderson — which is the whole point. According to Las Vegas REALTORS, the association's monthly statistics blend every GLVAR closing in the metro into one headline, and a market that contributes twelve sales to a thousand-plus total simply vanishes inside it. If you want to know what Boulder City is doing, the valley report cannot tell you; only the town's own count can.

How Does Boulder City Compare to the Henderson ZIPs Next Door?
Boulder City is one ZIP code, so the comparison that matters is not internal — it is against the four Henderson ZIPs that share its border and supply most of its equity-mover buyers. We pulled each ZIP's active board and its closings for the 90 days ending September 6, 2026, according to our analysis of Las Vegas REALTORS MLS data via Repliers. All property types are included, and the window is a rolling 90 days rather than July alone, which is why Boulder City's row shows 43 closings rather than twelve.
| ZIP | Area | Active listings | Median ask | Closed (90 days) | Median closed | Median DOM |
|---|---|---|---|---|---|---|
| 89005 | Boulder City | 154 | $449,500 | 43 | $480,000 | 46 |
| 89012 | Henderson — MacDonald Highlands / MacDonald Ranch | 342 | $797,000 | 111 | $596,000 | 35 |
| 89002 | Henderson — Black Mountain foothills / central | 170 | $498,375 | 85 | $474,000 | 35 |
| 89011 | Henderson — Lake Las Vegas / Cadence / Tuscany | 714 | $530,735 | 209 | $464,990 | 35 |
| 89015 | Henderson — downtown / east side | 307 | $434,900 | 115 | $415,000 | 31 |
Three readings. First, Boulder City is the only row where the closed median ($480,000) sits above the asking median ($449,500) — the reverse of every Henderson ZIP. That inversion is the scarcity market's fingerprint: what closes over a quarter is the character stock and the view homes that buyers wait for, while the active board is weighted toward the modest central houses and the patient, sentiment-priced tail. Second, the liquidity trade is visible in two columns. 89011 alone carries 714 active listings to Boulder City's 154 and closed 209 sales in the window to Boulder City's 43 — the Henderson ZIP next door produces a buyer roughly every ten hours, and Boulder City produces one roughly every two days. That is what "insulated but illiquid" means in practice, and it is why the sequencing advice later in this report — find the Boulder City house first, then time the Henderson sale — is not a preference but a necessity. Third, the clock: Boulder City's 46-day quarterly median is eleven to fifteen days longer than any adjacent Henderson ZIP, which is the honest cost of a market that lists a dozen homes a month. A buyer comparing the town to Henderson is choosing between a market that will produce the next house on schedule and one that will produce the right house eventually; a seller is choosing between a buyer pool measured in hundreds and one measured in dozens.
How Has Boulder City Shifted Since the June Report?
Our June Boulder City report found a market holding its bench while the valley corrected around it; August confirms the pattern with two more months of evidence. The active board barely moved, the per-foot bench held its band, and the cut share stayed the valley's lowest — in a summer when every big-city neighbor's climbed. According to Las Vegas REALTORS, metro inventory kept building through July; Boulder City's ordinance kept it out of that story entirely.
What DID shift is the tail. The share of the board sitting past 60 days grew through summer — the view corridors and estate properties where sentiment pricing goes to wait. According to FHFA price data, the seasonal pattern in thin premium markets is to resolve these standoffs in the fourth quarter, when patient sellers finally meet the year's motivated buyers. If you have been watching a specific hillside listing since spring, October through December is historically when its price conversation gets real.
The demand side stayed remarkably steady. According to the U.S. Census Bureau, the retiree-weighted demographics that anchor this market don't swing with mortgage rates the way family markets do — a large share of Boulder City purchases involve substantial equity or cash, which is why the 6.65% rate environment that reshaped Henderson's buyer pool has left this one nearly untouched. Fixed supply meeting rate-insensitive demand is the entire Boulder City formula, and both halves held all summer. According to the FHFA House Price Index, small fixed-supply markets across the Mountain West have shown the same pattern through the 2024–2026 rate cycle: flatter drawdowns on the way down and slower run-ups on the way up — the statistical shape of a market that simply doesn't produce enough transactions to overshoot.
What September should tell us: whether the aged view-corridor tail starts converting. A cluster of fourth-quarter closings at honest numbers would reset the top of this market's comps for 2027; another quarter of standoff leaves the bench to the bungalows. Watch the over-$700,000 closings — there were none in July, which is itself a data point.
How Was This Report Built?
In a twelve-closing market, methodology is the report. Every figure above comes from complete counts — all 141 actives swept individually for the cut share, the 12 July closings posted by August 23 (16 once the month settled) ratioed sale-against-list — and every statistic carries its sample size in print, because a median of twelve deserves different confidence than a median of a thousand. This is also why we lean on the per-foot bench over the price median: across every month of 2026, the $325 bench has moved within a narrow band while the monthly price median bounced $30,000 on mix alone. According to NAR research methodology that any small-market statistician would recognize, the stable derived metric beats the volatile headline one — so that is what we publish first. When you see a Boulder City "market trend" anywhere without sample sizes attached, you are reading the bounce, not the town.
The ZIP comparison is this month's one addition to the method, and it uses a different window on purpose: active counts as of September 6, 2026, and closings for the 90 days ending that date, pulled ZIP by ZIP through the same Repliers MLS access and including every property type. For Boulder City specifically, the 90-day window is the more useful one — 43 closings support a median in a way twelve cannot — and the fact that its quarterly median ($480,000) and clock (46 days) differ so much from July's ($425,000, 17 days) is not a discrepancy to explain away but the clearest demonstration in this series of why small-market monthly figures need their sample printed beside them. Where the ZIP figures and the July figures disagree, the window is the reason, and both are labeled.
What Does the Median Boulder City Home Cost Per Month?
According to the Freddie Mac PMMS, the thirty-year fixed averaged 6.65% the week of August 21. The $425,000 July median at that rate:
| Down payment | Loan amount | P&I / month | Note |
|---|---|---|---|
| 10% ($42,500) | $382,500 | $2,455 | Plus modest taxes — no HOA on most stock |
| 20% ($85,000) | $340,000 | $2,182 | The retiree-equity norm |
| 50% ($212,500) | $212,500 | $1,364 | The Henderson equity-mover profile |
Note the line most valley reports can't print: no HOA on most stock. The majority of Boulder City's housing predates the association era, which claws back $150–$400 of monthly cost against the master-plan cities and partially offsets the $325 bench. Add Nevada's gentle property taxes — effective rates near 0.55% per the Nevada Department of Taxation — and the honest all-in on the median at 20% down runs about $2,500–$2,650, HOA-free.
That missing HOA line is worth translating into purchase price, because it is the number that makes the $325 bench less expensive than it looks. At the 6.65% rate in force the week of August 21, 2026, $150 a month of principal and interest carries roughly $23,000 of thirty-year loan and $400 a month carries roughly $62,000 — so a no-HOA Boulder City house can cost $23,000 to $62,000 more than a master-plan house with dues and produce the same monthly bill. Measured that way, a meaningful slice of the per-foot premium over Henderson is not a premium at all; it is the association fee, capitalized. And according to the Nevada Department of Taxation, the property-tax bill on an owner-occupied primary residence cannot rise more than 3% a year under the state's partial abatement, which means the one cost line that does remain in a Boulder City payment is also the one that is capped — a combination that suits the long-hold, equity-heavy buyer this town attracts better than almost any other market in the valley.
What Does This Mean for Your Boulder City Move?
Buying: patience for the right listing, speed when it appears, and comps over medians always. Selling: the bench plus your three true peers, launched carefully into a thin, attentive market. Watching: the number that matters here isn't the cut share — it's the active board count. If 141 ever becomes 200, the scarcity math that holds the $325 bench softens; it has not moved meaningfully in years, and the ordinance behind it isn't changing.
A final word on the comparison every Boulder City conversation eventually reaches: Henderson. Fifteen minutes apart, the two run opposite market physics — Henderson's 2,288-listing depth gives buyers selection and sellers liquidity; Boulder City's 141-listing scarcity gives owners insulation and costs them speed. The equity-mover path between them ($523,495 Henderson bench out, $425,000 Boulder City median in, roughly $100,000 freed plus the HOA line deleted) remains the most-traveled route into this market, and nothing in August's data slows it. If that's your route, the sequencing matters: in a twelve-closing market you find the Boulder City house first and time the Henderson sale to it, never the reverse — the master plan will produce a buyer on your schedule; the historic district will not produce a bungalow on yours. Bridge financing or a home-equity line against the Henderson property covers the overlap for most equity movers, and the carrying cost of sixty days of overlap is a rounding error against losing the right house in a market that lists a dozen a month.
Small-market specifics, parcel by parcel: (702) 637-1759 · current Boulder City inventory · what your home would bring.
Frequently Asked Questions
What is the median home price in Boulder City in August 2026?
July's twelve closings ran a $425,000 median ($440,000 single-family) at $325 per square foot. With a sample that small, the per-foot bench is the sturdier number — it has held in a tight band all year — while the price median swings with each month's mix. The median active asking price across all 141 listings is $445,000.
Why is Boulder City more expensive per square foot than Summerlin?
Legally fixed supply meeting durable demand. The controlled-growth ordinance has capped homebuilding since 1979, so there is no builder pipeline, no new-village competition, and almost no way for supply to answer demand except through price. Add the historic stock, the walkable downtown, and Lake Mead adjacency — none of which can be replicated — and the $39-a-foot premium over Summerlin is structural, not sentimental.
Is Boulder City a good place to invest in rental property?
Generally no, and that's by design: thin rental stock, no meaningful short-term-rental economy, and appreciation that grinds rather than spikes. Boulder City is an owner-occupant market — which is exactly why its values hold through valley corrections that shake investor-heavy submarkets.
How long does it take to sell a Boulder City home?
July's closings ran a 17-day median — but that measures the accurately-priced winners. The active board tells the other half: roughly a third of the 141 listings have sat past 60 days, mostly sentiment-priced view homes. In a twelve-closing-a-month market, pricing right is the difference between two weeks and two seasons.
Are Boulder City sellers negotiating in 2026?
Modestly and selectively: nine of July's twelve sales closed below asking, but at a 98.2% median ratio — typical discounts under $9,000. The real negotiations live on the aged tail: the 52 listings with prior cuts and the 60-day-plus view properties, where 5–8% conversations are realistic.
Does Boulder City have HOA fees?
Mostly no — the majority of the housing stock predates the HOA era, a $150–$400 monthly saving against the valley's master plans that partially offsets the higher per-foot bench. The exceptions are a handful of newer subdivisions and townhome communities; check the specific parcel.
Is Boulder City protected from a Las Vegas housing downturn?
More insulated than any valley submarket, though not immune. Fixed supply, owner-occupant demand, and near-zero investor exposure mean corrections arrive here muted and late — the 2026 valley repricing has barely dented the bench. The trade-off is liquidity: in a genuine downturn, Boulder City homes don't lose value so much as take longer to find their buyer.
Which Sources Inform This Boulder City Market Report?
- Complete GLVAR feed sweep, August 23, 2026 — all 141 active Boulder City listings and all 12 July closings, examined individually via NREG's Repliers MLS access
- ZIP-level pull, September 6, 2026 — active counts and 90-day closings for 89005 and the adjacent Henderson ZIPs 89002, 89011, 89012, and 89015, via NREG's Repliers access to Las Vegas REALTORS MLS data
- City of Boulder City — the controlled-growth ordinance and municipal framework
- Las Vegas REALTORS — metro context
- National Park Service, Lake Mead NRA — visitation and recreation context
- U.S. Census Bureau — demographics behind the demand profile
- Freddie Mac PMMS — the rate environment
- FEMA flood maps — parcel-level flood designations
- Nevada Department of Taxation — property-tax framework
- Clark County Assessor — parcel records
- NAR — national small-market benchmarks
Methodology: every statistic above states its sample. The 141-listing active sweep is complete (cut share = original vs current list price); July's closing set is all 12 GLVAR-recorded sales. In markets this size we publish distributions alongside medians on purpose — and we recommend reading every Boulder City statistic, ours included, with the n printed next to it. Not an appraisal of any individual home.