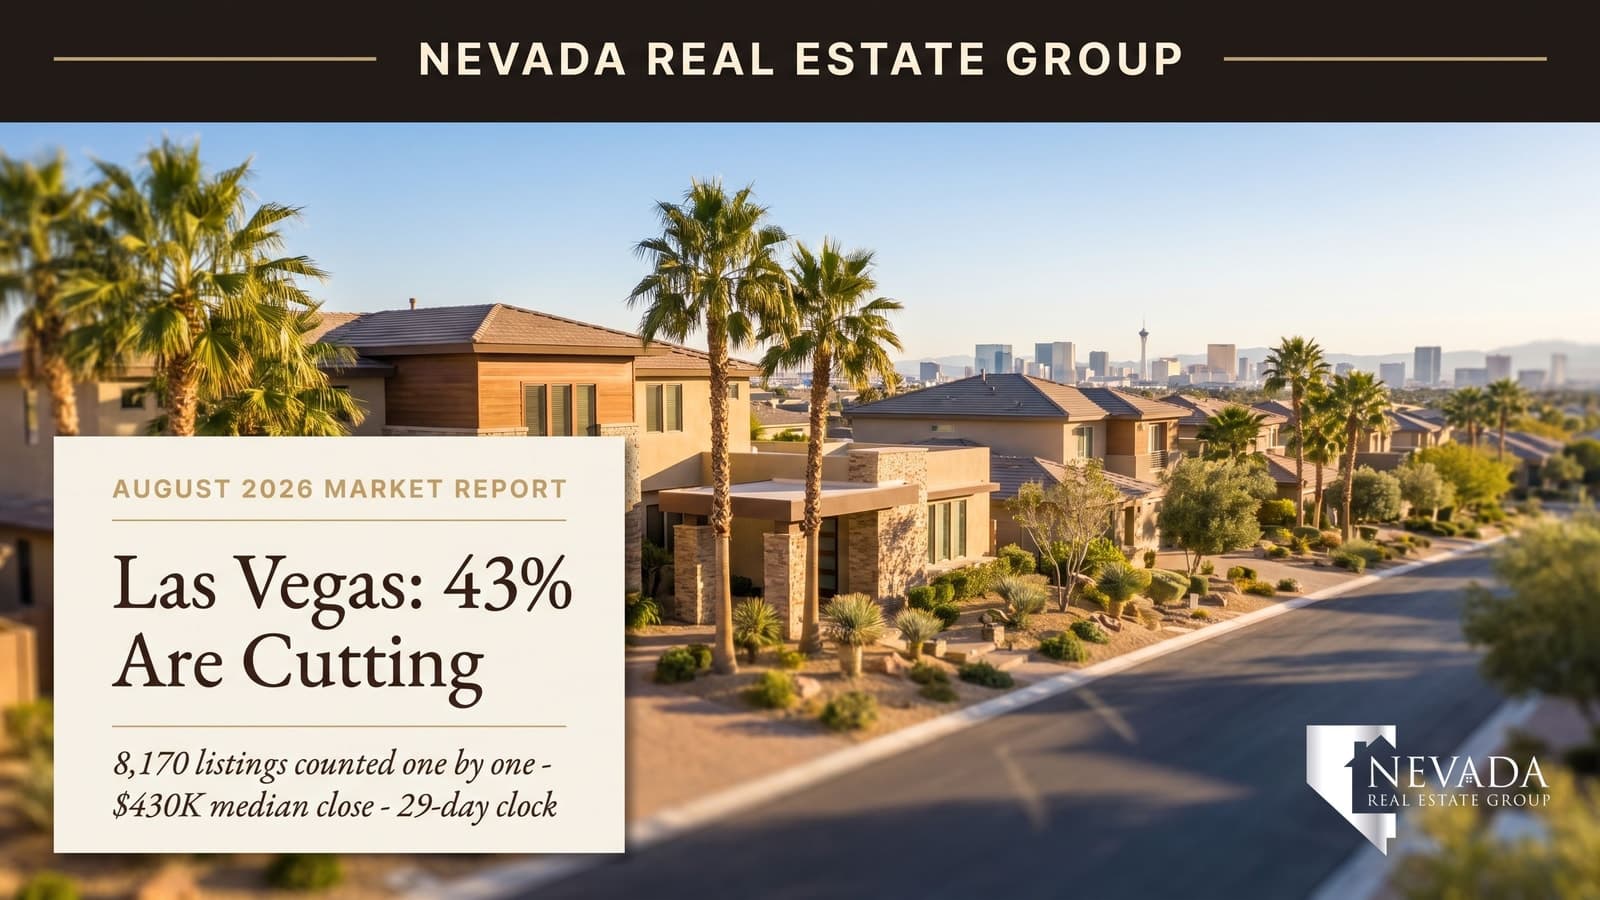

Every number in this report comes from a full sweep of the GLVAR feed our team ran on August 23, 2026 — all 8,170 active Las Vegas listings, examined individually, plus the 991 July sales that had posted to the feed by that date; July settled at 1,400 closings once the month finished posting (see the restatement below). Not a sample, not a syndicated estimate: the whole board, counted.
The headline is simple. Las Vegas is negotiable again — measurably, listing by listing — and the sellers who accept that are the ones still closing in under a month.
August 2026 Las Vegas by the numbers: 8,170 active listings, 43% carrying at least one price cut (median cut $19,901). July's 1,400 closings (settled September 15) ran a $430,000 median — $480,000 for single-family — at 98.9% of list price, with 57.6% closing below asking and a 28-day median market time. Buyers hold real leverage on aged inventory; sellers who price to the last 90 days of comps still move fast.
Restated September 15, 2026. The July closing figures in this report were counted on August 23, when about 70% of July's sales had posted to the MLS feed; closings keep posting for five to six weeks after a month ends. Fully posted, July shows 1,400 closings, not the 991 this report originally counted, at a $430,000 median ($480,000 single-family), 98.9% of list, 57.6% below asking, $251 per square foot and a 28-day median clock. The medians moved within a few percent and the conclusions stand; the active-listing figures, counted the same day, are unaffected. The Direct Answer and snapshot table above carry the settled figures; percentages elsewhere in the body reflect the August 23 count. The September 2026 edition of this report carries the settled month in full, and this series now waits for a month to settle before counting it.
- 43% of 8,170 active listings have cut price — median reduction $19,901.
- July median sale: $430,000 all types, $480,000 single-family, at $252 per square foot.
- 59% of July closings settled below list; the median sale ran 98.8% of asking.
- Median 29 days to contract — but the aged tail past 60 days is where negotiations win.
- Sellers: the first 21 days decide whether you sell or join the 43%.
What Are the Key Las Vegas Housing Numbers for August 2026?
| Metric | Value | What it tells you |
|---|---|---|
| Active listings | 8,170 | Deepest selection since the mid-2010s |
| Listings with a price cut | 43.0% | Nearly half the board is signaling flexibility |
| Median price cut | $19,901 | Before any offer negotiation begins |
| Median active list price | $472,913 | What sellers are asking |
| July closings | 1,400 (991 posted by Aug 23) | Within city limits, GLVAR records |
| July median sale — all types | $430,000 | Condos and townhomes included |
| July median sale — single-family | $480,000 | The house-with-a-yard benchmark |
| Median sale-to-list | 98.8% | The typical seller takes about 1.2% under ask |
| Sold below list | 59% | vs 16% above — leverage sits with buyers |
| Median price per square foot | $252 | July closings |
| Median days on market | 29 | For homes that closed |
The gap worth staring at: the median asking price ($472,913) sits $42,900 above the median all-types closing price ($430,000). Some of that is mix — more expensive homes sit longer — but a meaningful slice is aspiration meeting arithmetic, one $19,901 cut at a time.
Read the table as two clocks rather than one. The active side — 8,170 listings, 43% cut, a $472,913 median ask — describes what sellers were doing as of August 23, 2026. The closed side — 991 sales, $430,000, 98.8%, 29 days — describes what buyers actually did in July. The market's direction is the distance between those two columns, and this summer it has been closing from the top down: sellers cutting toward the closings rather than buyers reaching up to the asks. That mechanism sits behind every number below, and it is why the cut share, not the median, is the figure to watch month to month.
Why Are 43% of Las Vegas Listings Cutting Price?
Because the first price was set for a market that ended two years ago. Inventory has climbed steadily while the buyer pool thinned on 6.65% mortgage rates (Freddie Mac PMMS, August 21), and sellers keep anchoring to a neighbor's 2022 comp instead of last quarter's closings.
According to Las Vegas REALTORS, the metro has been drifting toward balance all year — and our full-board sweep shows what balance looks like at the individual-listing level: 3,513 of 8,170 active listings have already conceded at least once. In our experience, the cut itself is rarely the discount that matters; it is the signal that opens the real negotiation. A listing that has cut once and sat another three weeks is a listing where a written offer $15,000 to $25,000 under the reduced price gets a counter, not a rejection.
The cut itself is worth measuring precisely. At $19,901 against a $472,913 median ask, the typical reduction is 4.2% — one step, taken once. But 3,513 cut listings is not 3,513 single cuts: the aged tail carries second and third reductions, which is why the median understates what the longest-sitting sellers have actually conceded. The practical lesson for a seller is not that cutting is a failure; it is that a $19,901 cut in week five costs more than a $19,901 lower price in week one, because the second version never accumulates the days on market that every buyer's agent reads as an invitation.

What Did Homes Actually Sell For in July 2026?
The 991 July closings tell the honest story that list prices can't:
- Median sale, all property types: $430,000 — condos and townhomes pull this below the single-family line.
- Median single-family sale: $480,000, closing in a median 27 days.
- Median price per square foot: $252 — the benchmark to test any list price against. A 2,000-square-foot home asking $600,000 is asking $300 a foot; the market is paying $252. That gap is either justified by upgrades and location, or it is the next price cut.
- 98.8% median sale-to-list — the typical seller took roughly $5,800 under their final asking price.
- 59% closed below list, 16% above, 25% at list. The above-list slice is real — turnkey homes in the $350,000–$450,000 band still draw competition — but it is one sale in six, not the 2021 norm.
According to the U.S. Census Bureau, Las Vegas keeps adding households, which is why absorption continues at nearly a thousand city-limit closings a month even at these rates. Demand didn't vanish; it got selective.
According to Las Vegas REALTORS, the association publishes single-family and condo/townhome medians separately for exactly this reason: the $430,000 all-types figure and the $480,000 single-family figure describe different products. Comparing either one to a neighbor's sale without knowing which bucket that sale fell in is how sellers talk themselves into the wrong price — and how buyers convince themselves a fairly priced house is $50,000 too high.
Which Price Bands Are Moving and Which Are Sitting?
Where the action concentrated in July:
| Band | Under $400K | $400K–$600K | $600K–$1M | $1M+ |
|---|---|---|---|---|
| Market speed | Fastest — entry demand is constant | The core — most closings live here | Selective — condition decides | Slowest — negotiation-heavy |
| Buyer competition | Real; clean homes draw multiple offers | Moderate; over-list sales happen | Thin; one qualified buyer at a time | Rare; cash and patience rule |
| Seller leverage | Highest | Even | Low | Lowest |
| Typical outcome | Near or at list | 1–2% under list | 2–4% under after a cut | 5%+ under original ask |
Two things the band table hides. The under-$400,000 column is now mostly condos, townhomes and the valley's oldest single-family stock — at a $480,000 single-family median, a detached house under $400,000 is either far east, far north, or needs work, which is why that column moves fastest and inspects hardest. And the $400,000–$600,000 core is where the 98.8% sale-to-list figure is actually made: it holds the bulk of July's 991 closings, so the city-wide ratio is really this band's ratio, with the $1M-plus column's 5%-plus discounts and the entry column's over-list sales roughly cancelling each other out.
The pattern repeats across Summerlin, Henderson, and the southwest: the closer a home sits to the metro's entry point, the more 2021 it still feels; the further above the median, the more the buyer runs the table.
How Long Does It Take to Sell a Las Vegas Home Right Now?
The 29-day median hides the split that matters. Homes priced against live comps in their first week routinely go under contract inside three weeks. Homes priced to a hope sit past 45 days, cut once ($19,901 at the median), sit more, and eventually close near 96–97% of the reduced number — months later and tens of thousands lighter.
That is the practical meaning of a 43% cut share: nearly half of sellers are running the slow experiment, funding the fast sellers' comps while they do. Across the 9,600-plus closings Nevada Real Estate Group has represented, the pattern has never changed — the market pays for accuracy in week one and charges rent for optimism every week after.
Put the two timelines side by side on the median house. Seller A lists at $430,000 against $252-a-foot comps and goes under contract on day 19 at 98.8% — $424,840. Seller B lists at $460,000, sits 45 days, cuts $19,901 to $440,099, sits three more weeks, and closes at 96.5% of the reduced price — $424,696. Same house, same money, two extra months of principal, interest, taxes, HOA and utilities — roughly $2,800 to $2,900 a month at this price point using the payment table below — and a listing history every buyer's agent can read before writing the offer.

What Should Las Vegas Buyers Do With This Market?
Work the aged tail — start from the live list of Las Vegas homes for sale sorted by days on market. The buyer playbook for August, in order:
- Filter for 45-plus days on market with a prior cut. That combination — a third of the board — is where $15,000–$25,000 negotiations and seller-paid concessions live.
- Test every list price against $252 a square foot. Above it needs a reason; well above it is your negotiation brief, written by the seller.
- Ask for the rate buydown, not just the discount. A $13,000 seller credit converts to roughly a 0.75% rate reduction — worth about $135 a month more than the same $13,000 off price. Our wait-or-buy rate analysis runs that math in full.
- Keep your inspection contingency. 59% of sellers already accepted under-list; repair credits stack on top.
- Write the listing's own history into the offer. A seller who cut $19,901 on day 45 has told you the floor is moving. Reference the cut, the days on market and the $252-a-foot comps in the cover letter rather than leading with a number — an agent who sees the math counters; one who sees only a low number rejects.
The order matters: aged-and-cut first, price-per-foot test second, concession ask third. Buyers who open with the rate buydown before establishing the comps get treated as a financing problem rather than a serious offer.
And know where leverage doesn't work: turnkey homes under $450,000 still see 16% of sales close over ask. Bring speed there, not attitude.
What Should Las Vegas Sellers Do in September?
Three moves separate the 27-day sales from the 90-day ones:
- Price against the trailing 90 days, not the peak. Your buyer's lender will appraise against July's closings — $252 a foot — no matter what the listing says.
- Spend on the first impression, not a future concession. The $4,000 you spend on paint and landscaping photographs; the $19,901 cut just disappears.
- Meet the market on concessions early. A buydown credit offered up front widens your buyer pool at 6.65% rates and costs less than the price cut you'll otherwise make in week five.
Selling into 43% cut-share is entirely doable — a fifth of July's sellers gave up nothing at all. They were just priced correctly on day one.
Run the net, not the price. According to the Nevada Department of Taxation, Nevada's real property transfer tax runs $2.55 per $500 of value in Clark County — about $2,193 on the $430,000 median, customarily paid by the seller — and it comes off the top before title, escrow and brokerage compensation. A seller who cuts $19,901 to attract the buyer and then credits $13,000 for a buydown has handed $32,901 to the market; a seller who priced $10,000 under the aspirational number on day one and offered the same credit up front typically gives less and closes two months sooner. And read the ZIP table further down before setting the number: the $480,000 single-family median blends 89135's $825,000 closings with 89108's $365,000 ones, and your comp set is your ZIP's, not the city's.
Where Inside Las Vegas Is the Market Strongest and Weakest?
City-wide medians are an average of very different streets, and August's spread across the valley's quadrants is the widest we've tracked in years.
The northwest — Centennial Hills, Skye Canyon, Providence — is the volume engine. Newer master-plan stock in the $450,000–$650,000 band, family demand tied to school calendars, and the healthiest balance of the four quadrants: homes priced to comps here still routinely see second showings in week one. The catch is builder competition — resale sellers in Skye Canyon are effectively bidding against Lennar's incentive sheet two streets over, which caps how far above $252 a foot a resale can reach.
The southwest — Enterprise, Mountains Edge, Southern Highlands — is where the premium negotiates. This is the valley's largest concentration of sub-15-year-old housing, and its $500,000–$800,000 core is exactly the band where our sweep shows leverage tipping hardest to buyers. Sixty-day listings with two cuts on record cluster here; so do the $15,000-plus seller credits.
The east side and the numbered streets are the affordability play — the closest thing Las Vegas still has to entry pricing, with heavy investor presence and the widest condition spread. Price per square foot runs meaningfully under the city median, but so does renovation certainty: this is inspection-contingency country, and the difference between a $310,000 sound home and a $310,000 money pit is a $600 inspection.
Downtown and the historic core split by block. The Arts District halo keeps pulling renovation capital while adjacent blocks sit — the classic early-cycle gentrification checkerboard, rewarding buyers who walk the street at 8pm before writing anything.
The sibling numbers frame the spread: North Las Vegas closes at a 100% median sale-to-list in 18 days at $234 a foot — the valley's last genuinely competitive submarket — while the Summerlin area carries a 47.5% cut share at $286 a foot as its premium tier corrects, and Henderson holds the middle at $257 with the valley's stickiest single-family pricing. Same metro, three different negotiations. If your search crosses quadrant lines, your offer strategy should change at the border with them.
Two numbers the sibling reports add: Henderson's single-family median runs $523,495 with 45% of its listings cutting, and North Las Vegas puts nearly a quarter of its sales over ask on a $425,000 median. Each has its own August report this week. The spread between them is the widest we have tracked since 2019 — which means the "Las Vegas market" is now three markets wearing one name, and a buyer who treats a Henderson comp as a Las Vegas comp is reading the wrong table.
How Do the ZIP Codes Inside Las Vegas Compare?
Quadrants are still a coarse map, so we went one level down. For the eight highest-volume ZIP codes that carry a Las Vegas address, we pulled each ZIP's active board and its closings for the 90 days ending September 6, 2026, according to our analysis of Las Vegas REALTORS MLS data via Repliers. Two cautions before the table. All property types are included, and the window is a rolling 90 days rather than July alone, so read the rows against each other rather than against the July figures above. And ZIP boundaries ignore city limits: 89135, 89141, 89148, 89178 and 89123 are largely unincorporated Clark County with Las Vegas mailing addresses, which is why several rows run above the city-limits medians this report is built on.
| ZIP | Area | Active listings | Median ask | Closed (90 days) | Median closed | Median DOM |
|---|---|---|---|---|---|---|
| 89135 | Summerlin South — The Ridges / Red Rock Country Club | 311 | $887,000 | 113 | $825,000 | 36 |
| 89131 | Centennial Hills / Iron Mountain Ranch | 260 | $652,450 | 92 | $577,500 | 24 |
| 89141 | Southern Highlands | 292 | $600,000 | 113 | $545,000 | 30 |
| 89117 | West central — Peccole Ranch / The Lakes | 323 | $525,000 | 122 | $511,250 | 25 |
| 89148 | Southwest — Spring Valley south / Russell Road corridor | 323 | $509,000 | 123 | $465,000 | 31 |
| 89149 | Northwest — Centennial Hills west | 304 | $622,500 | 102 | $461,500 | 23 |
| 89123 | Silverado Ranch / Sunset corridor | 269 | $460,000 | 111 | $448,000 | 33 |
| 89178 | Mountains Edge west | 236 | $509,000 | 118 | $435,000 | 29 |
Four readings. First, the premium lives in one row: 89135 closed at an $825,000 median in the 90 days ending September 6, 2026 — $247,500 above the next ZIP — and carried the slowest clock on the table at 36 days, which is the Summerlin correction described earlier, located on a map. Second, 89149 is the seller's cautionary tale: a $622,500 median ask against a $461,500 median closing, a $161,000 gap, yet the fastest clock on the table at 23 days. The active side carries the newer and larger northwest product; the closings skew to the established tract homes — so the homes that are priced to the record move in three weeks while the rest of the board waits. Third, the tightest ask-to-close gap belongs to 89117, at $13,750: the established west-central stock around Peccole Ranch and The Lakes is already priced to its comps, which is why it clears in 25 days at about 97% of what its sellers ask. Fourth, the value rungs sit off the table because their boards are smaller or their addresses split between jurisdictions: 89108 in the northwest closed 108 sales at a $365,000 median in 21 days from a 265-listing board — above its own $360,000 median ask, the clearest "still 2021" signal in the city — and 89121 in the southeast closed 95 at $345,000 in 30 days. One more caution in the numbers: 89139 in the southwest closed 82 sales at $502,500 against a $476,498 median ask, and that is mix, not bidding — larger new-build closings against a board that carries the condo and townhome supply. Ask-versus-close at ZIP level tells you about product before it tells you about negotiation. For a buyer with a $500,000 ceiling, the table says the realistic search is 89148, 89149, 89123 and 89178 plus the value rungs; $600,000 opens 89141 and 89117; the Ridges row starts at a different number entirely. For a seller, it is the comp set your buyer already has open on their phone.
What's Happening With New Construction?
Builders remain this market's most rational sellers. Rather than cut base prices — which reprices their whole backlog — Lennar, D.R. Horton, KB Home and Toll Brothers keep discounting through incentives: financed rates below the street rate on quick move-ins, closing-cost credits, design-center money. According to the National Association of Home Builders, incentive use among builders nationally has run at multi-year highs through 2026, and the valley's new-construction inventory reflects it. For buyers comparing resale against new, the builder's incentive sheet is a price cut wearing a different name — compare NETS, not stickers.
Do the translation on the payment table below. A builder's financed 5.9% on a $387,000 loan is worth $188 a month against the 6.65% street rate — the same $188 a resale seller has to fund with a $12,000–$13,000 credit. So a resale listing that sits $13,000 under a comparable quick move-in has matched the builder's headline incentive, and a resale seller in Skye Canyon or the southwest who has not done that math is competing against a sheet they have never read. Two things the incentive sheet rarely says out loud: whether the rate is a permanent buydown or a temporary 2-1 that steps up in year two and again in year three, and whether it is conditional on using the builder's affiliated lender and title company. Both are standard, both are negotiable at the margin, and both change the net that the sticker is hiding.
What Does the Median Las Vegas Home Cost Per Month Now?
Prices only mean something next to payments. According to the Freddie Mac PMMS, the 30-year fixed averaged 6.65% in the survey week of August 21, 2026, so here is the July median translated into monthly reality at that rate, by down payment:
| Down payment | Loan amount | P&I / month | With a seller-funded buydown to 5.9% |
|---|---|---|---|
| 5% ($21,500) | $408,500 | $2,622 | $2,423 |
| 10% ($43,000) | $387,000 | $2,484 | $2,296 |
| 20% ($86,000) | $344,000 | $2,208 | $2,041 |
Two things the table understates. First, taxes and insurance add roughly $350–$450 a month at this price point — Nevada's property-tax bite stays gentle, with effective rates near 0.55% per the Nevada Department of Taxation. Second, the right-hand column is not hypothetical: with 43% of sellers already cutting price, the $12,000–$13,000 credit that funds that buydown is a routine ask on aged listings. According to Bankrate's transmission analysis, waiting for the Fed to deliver that same payment is a longer and less certain road than negotiating it this month. Third, the three rows are not equivalent buyers: below 20% down a conventional loan carries mortgage insurance the table does not show, which is why the 20% row's $2,208 is the only figure here that is the whole principal-and-interest story.
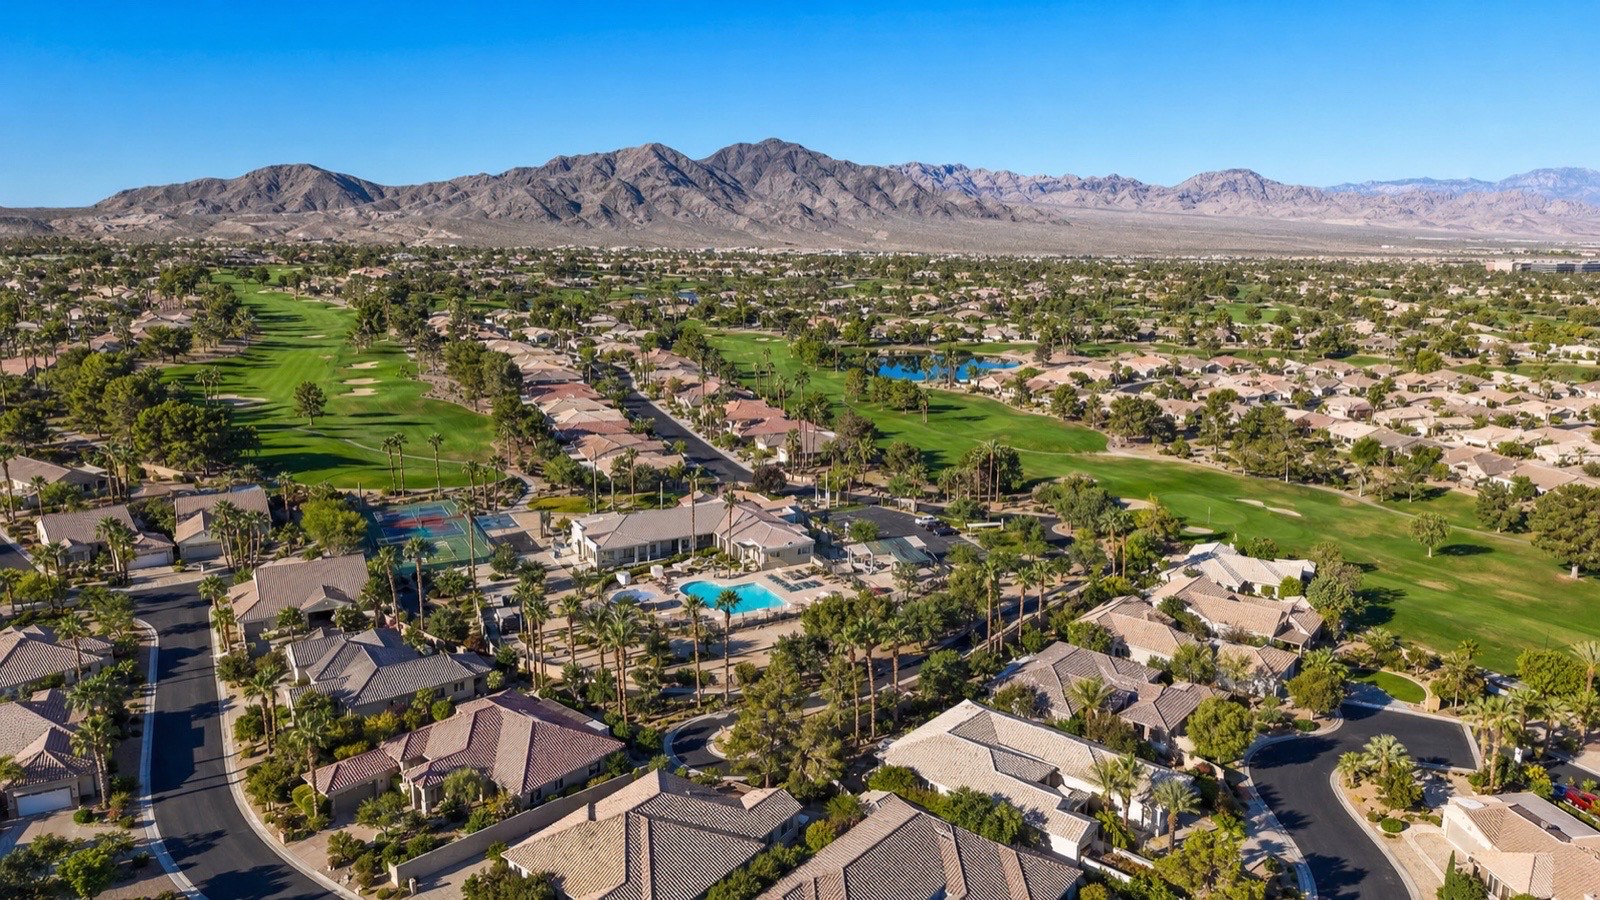
Is Las Vegas Heading for a Crash?
The question every 43%-cut-share headline invites. The honest answer from the data: this is a repricing, not an unraveling. July still absorbed 991 city-limit closings; 25% of sales closed at full list; sub-$450,000 turnkey homes draw multiple offers; and the median seller conceded 1.2%, not 15%. According to the FHFA house price index, national prices keep grinding higher even as velocity slows. A crash needs forced sellers — mass unemployment or toxic loans — and according to the Bureau of Labor Statistics, Las Vegas employment remains near record levels. What we have is the boring version of correction: sellers discovering the 2026 price one cut at a time.
What a genuine downturn would look like in this data, so you can watch for it rather than fear it: the cut share climbing past half the board while monthly closings fall well below 800; the sale-to-list ratio dropping under 97%; and the median clock moving past 45 days with the aged tail growing instead of clearing. None of the three is happening in August 2026 — closings held at 991, the ratio is 98.8%, and the median is 29 days. The direction of travel still matters more than any single month. Versus late summer 2025: inventory is meaningfully deeper, the cut share is higher, market time is longer, and the sale-to-list ratio has slipped under 99% — every dial moving the buyer's way, none of them moving fast. This is the slowest-motion leverage transfer the valley has seen since 2011, and it rewards the participants who read it monthly instead of annually. That is precisely why this report series exists — the June report caught the cut share crossing 40%; August catches the sale-to-list ratio slipping under 99%.
What Does This Mean for Your Move?
If you're buying: the leverage is real, mapped, and concentrated in aged listings — and it coexists with 6.65% rates, which seller-funded buydowns can meaningfully offset. If you're selling: the market is punishing exactly one mistake, and it's the one you control on day one. If you're waiting: watch the cut share. When it retreats from 43% toward 30%, the window you're waiting in is closing.
By reader, more specifically. A first-time buyer under $450,000 is in the one band where the 2021 rules still apply — turnkey homes there draw the 16% of sales that close over ask — so bring a full pre-approval, a short inspection window and a same-day decision, and spend your leverage on condition rather than price. A move-up buyer in the $600,000–$1M band is where the sweep shows leverage tipping hardest: 60-day listings with two cuts, $15,000-plus credits, and a ZIP table that tells you 89141 and 89117 clear near their asks while 89149 and 89135 do not. A seller anywhere should price against the trailing 90 days of their own ZIP, offer the buydown credit on day one instead of the cut on day 45, and count the transfer tax and title costs before deciding what "net" means. An investor should work the aged tail and the condo boards, where the all-types $430,000 median hides the deepest discounts to ask.
Both offices run this data live, street by street: Las Vegas (702) 637-1759 · current inventory · what your home would bring.
How Was This Report Built — and Why Does the Method Matter?
Most "market reports" you'll read this month are one of three things: a syndicated national feed with a city name swapped in, a portal's algorithmic estimate, or last quarter's association numbers reheated. This one is none of those, and the difference changes what the numbers can tell you.
We swept the complete GLVAR board on August 23 — every one of the 8,170 active Las Vegas listings — and compared each listing's original asking price against its current one. That is how the 43% cut share and the $19,901 median cut are counted, not estimated. A sampled version of the same measurement, which we also ran, would have told you 51% — because samples skew toward whatever sorts first, and the oldest listings cut most. Full boards don't lie; samples do, politely.
The sales side works the same way: the 991 July closings that had posted by August 23 (1,400 once the month settled; the ratio moved to 98.9% and the below-list share to 57.6%), each one's sale price ratioed against its final list price. That is where 98.8% and the 59%-below-list figure come from — closing-table facts, not survey answers. The one number we deliberately DON'T publish is months-of-supply: our raw active-to-closings ratio and the association's seasonally-adjusted single-family methodology produce different figures, and printing a number that disagrees with the official one without a methods lecture helps nobody. Where we cite an official metric, it is theirs; where we count the board ourselves, we tell you.
Why care? Because every decision this report supports — the offer you write on the 60-day listing, the price you set next Tuesday — is only as good as the denominator behind it. Ask any source of market numbers one question: did you count, or did you sample? The answer usually explains the headline.
The ZIP-level table is the one addition to the method this month, and it uses a different window on purpose: active counts as of September 6, 2026, and closings for the 90 days ending that date, pulled ZIP by ZIP through the same Repliers MLS access and including every property type. A rolling 90 days gives each ZIP enough closings — 92 to 123 in the eight printed rows — to produce a median worth reading, which a single month at ZIP level would not. Where the ZIP figures and the July city-limits figures disagree, the window and the boundary are the reasons, and both are labeled so you can tell which is which.
Frequently Asked Questions
What is the median home price in Las Vegas in August 2026?
July 2026 closings inside city limits ran a $430,000 median across all property types and $480,000 for single-family homes, at $252 per square foot. The median active listing asks $472,913 — the $42,900 gap between asking and closing is the clearest single measure of where negotiations are landing.
Is Las Vegas a buyer's market right now?
By behavior, substantially yes: 43% of active listings have cut price, 59% of July sales closed below list, and the median sale ran 98.8% of asking. But it is band-specific — turnkey homes under $450,000 still draw competing offers, while the $600,000-plus tiers negotiate heavily. Our full buyer's-market analysis tracks the leverage dials monthly.
How big is the typical Las Vegas price cut?
The median reduction across the 3,513 currently-cut listings is $19,901 — about 4% of the median asking price. That is the public concession; the private one at the offer table typically adds another 1–2%, which is how the median sale lands at 98.8% of (already reduced) list.
How long does it take to sell a house in Las Vegas now?
The July median was 29 days to contract — but that averages two different markets. Homes priced against trailing-90-day comps regularly go under contract in under three weeks; overpriced listings sit 45-plus days, cut $19,901 at the median, and restart the clock. Pricing, not the market, sets your timeline.
Are sellers paying buyer closing costs in Las Vegas?
On aged listings, routinely. Credits of $10,000–$15,000 for closing costs or rate buydowns appear regularly on homes past 45 days on market — the leverage math favors asking. On fresh, well-priced listings under $450,000, concession requests still lose to cleaner offers.
Will Las Vegas home prices drop further in fall 2026?
The trajectory suggests continued gentle repricing rather than a drop: sale-to-list slipping a fraction of a percent per quarter, cut share grinding higher. A meaningful rate decline would likely halt it by refilling demand. Nobody honestly knows the turn date — which is why we track the cut share monthly rather than forecasting it annually.
What is price per square foot in Las Vegas in 2026?
$252 median on July closings, city-wide. Submarkets spread widely around it — North Las Vegas at $234, Henderson at $257, the Summerlin area at $286 — and within each, condition moves the number $30 a foot in either direction. Use it as the sanity test on any asking price, not as an appraisal.
Which Sources Inform This Las Vegas Market Report?
- Full GLVAR feed sweep, August 23, 2026 — all 8,170 active Las Vegas listings and all 991 July closings, examined individually via NREG's Repliers MLS access
- ZIP-level pull, September 6, 2026 — active counts and 90-day closings for Las Vegas ZIPs 89108 through 89178, via NREG's Repliers access to Las Vegas REALTORS MLS data
- Las Vegas REALTORS — official metro statistics and methodology context
- Freddie Mac Primary Mortgage Market Survey — the 6.65% 30-year benchmark
- FHFA House Price Index — national price trend context
- U.S. Census Bureau — household growth
- Bureau of Labor Statistics, Las Vegas MSA — employment
- National Association of Home Builders — builder incentive trends
- Clark County Assessor — parcel and tax context
- NAR — national existing-home benchmarks
- Nevada Department of Taxation — transfer-tax context for net calculations
Methodology: actives and cut-share measured on the complete 8,170-listing board (originalPrice vs current list), July sales measured on all 991 GLVAR-recorded closings within Las Vegas city limits, July 1–31, 2026. City-limit figures run below metro-wide medians because unincorporated Clark County's premium enclaves sit outside them. This is market data, not an appraisal of your home.