

Most relocation guides tell you what Nevada is like. This one tells you who is here, who is arriving, and what those two facts do to the price of a house, because after 9,600+ closings across this state I can tell you that demographics are the slowest-moving and most reliable driver of a housing market. Interest rates swing in a quarter. A median age, a migration corridor or a homeownership rate moves over a decade, and it moves the market with it.
So this is the data guide, built from the Census Bureau's Vintage 2025 estimates, the 2020-2024 American Community Survey, the Census state-to-state migration flows for 2024, IRS migration records, the Nevada State Demographer's certified counts and 20-year projections, Bureau of Labor Statistics industry data, and the DMV's license surrender counts. Every figure carries its window. Where a number tells you something about buying a home in Las Vegas, Reno or the smaller markets in between, I say what it means and where it points.
Nevada had 3,282,188 residents on July 1, 2025, up 28,645 in a year and 5.7% since April 2020, with 73% of the state living in Clark County and 16% in Washoe. Growth now runs on migration, not births: net migration added 25,465 people in 2025 against a natural increase of 3,051, and California supplied 53,289 of 2024's arrivals. Buy where the newcomers land, in Henderson, North Las Vegas, Enterprise and Sparks, because that is where demand outruns supply.
- Nevada's July 1, 2025 population was 3,282,188 per the Census Bureau; the State Demographer certifies a higher 3,349,303.
- California sent 53,289 movers to Nevada in 2024 and 26,210 tax returns in 2022-2023 averaging $102,572 in income.
- Henderson grew 11.5% and North Las Vegas 14.3% since 2020, while the city of Las Vegas grew 5.3%.
- Nevada's homeownership rate is 60.0% against 65.2% nationally, and Reno's 49.8% is the lowest major city.
- The State Demographer projects 3,699,248 Nevadans by 2044, with annual growth slowing from 1.3% to 0.4%.
How Many People Live in Nevada in 2026?
There are two official answers, and a mover should know both. According to the U.S. Census Bureau's Vintage 2025 population estimates, Nevada had 3,282,188 residents on July 1, 2025, up 28,645, or 0.9%, from July 2024 and up 176,595, or 5.7%, from the April 2020 census base of 3,105,593. Clark County, which contains Las Vegas, Henderson, North Las Vegas and the unincorporated towns, held 2,407,226 of those people, or 73% of the state. Washoe County, which contains Reno and Sparks, held 509,386, or 16%. The remaining 15 counties together held about 365,000 people, less than the city of Henderson and the city of Sparks combined.
The second answer comes from the state. According to the Nevada State Demographer's Governor-certified estimates, issued by the Department of Taxation for certification by March 1, 2026, Nevada had 3,349,303 residents on July 1, 2025, up 2.0% in a year, with Clark County at 2,448,576 and Washoe at 519,471. The state's series runs about 67,000 people, or 2%, above the federal one because the state uses a housing-unit-based method rather than the Census Bureau's births-deaths-migration accounting, and because the state has a direct interest in counting everyone: the certified numbers allocate tax revenue to counties and cities under NRS 360.283. Neither is wrong. The Census series is the one to use for comparisons with other states; the state series is the one Nevada's own budgets run on.
| County | Main cities | July 1, 2025 | Change 2024 to 2025 | Change since 2020 | Share of Nevada |
|---|---|---|---|---|---|
| Clark | Las Vegas, Henderson, North Las Vegas | 2,407,226 | +21,480 (+0.9%) | +6.2% | 73.3% |
| Washoe | Reno, Sparks | 509,386 | +4,002 (+0.8%) | +4.7% | 15.5% |
| Lyon | Fernley, Dayton, Yerington | 65,088 | +1,312 (+2.1%) | +9.9% | 2.0% |
| Carson City | Carson City | 58,571 | +271 (+0.5%) | -0.1% | 1.8% |
| Nye | Pahrump | 57,336 | +975 (+1.7%) | +11.1% | 1.7% |
| Elko | Elko | 54,815 | +129 (+0.2%) | +2.1% | 1.7% |
| Douglas | Minden, Gardnerville | 50,111 | +520 (+1.0%) | +1.3% | 1.5% |
| Churchill | Fallon | 25,851 | -104 (-0.4%) | +1.3% | 0.8% |
| Nevada total | 3,282,188 | +28,645 (+0.9%) | +5.7% | 100% |
Read the table as a buyer and three things stand out. Nevada is a two-metro state: Clark plus Washoe is 89% of everyone, so statewide averages are mostly Las Vegas averages. The fastest percentage growth is in the counties that ring the metros, Lyon at 9.9% and Nye at 11.1% since 2020, which is the commuter-exurb pattern the Census Bureau flagged nationally in its May 2026 release. And Carson City, the capital, has essentially not grown since 2020, which is why its housing market behaves like a small, stable town rather than a boomtown.
Where in Nevada Is the Population Actually Growing?
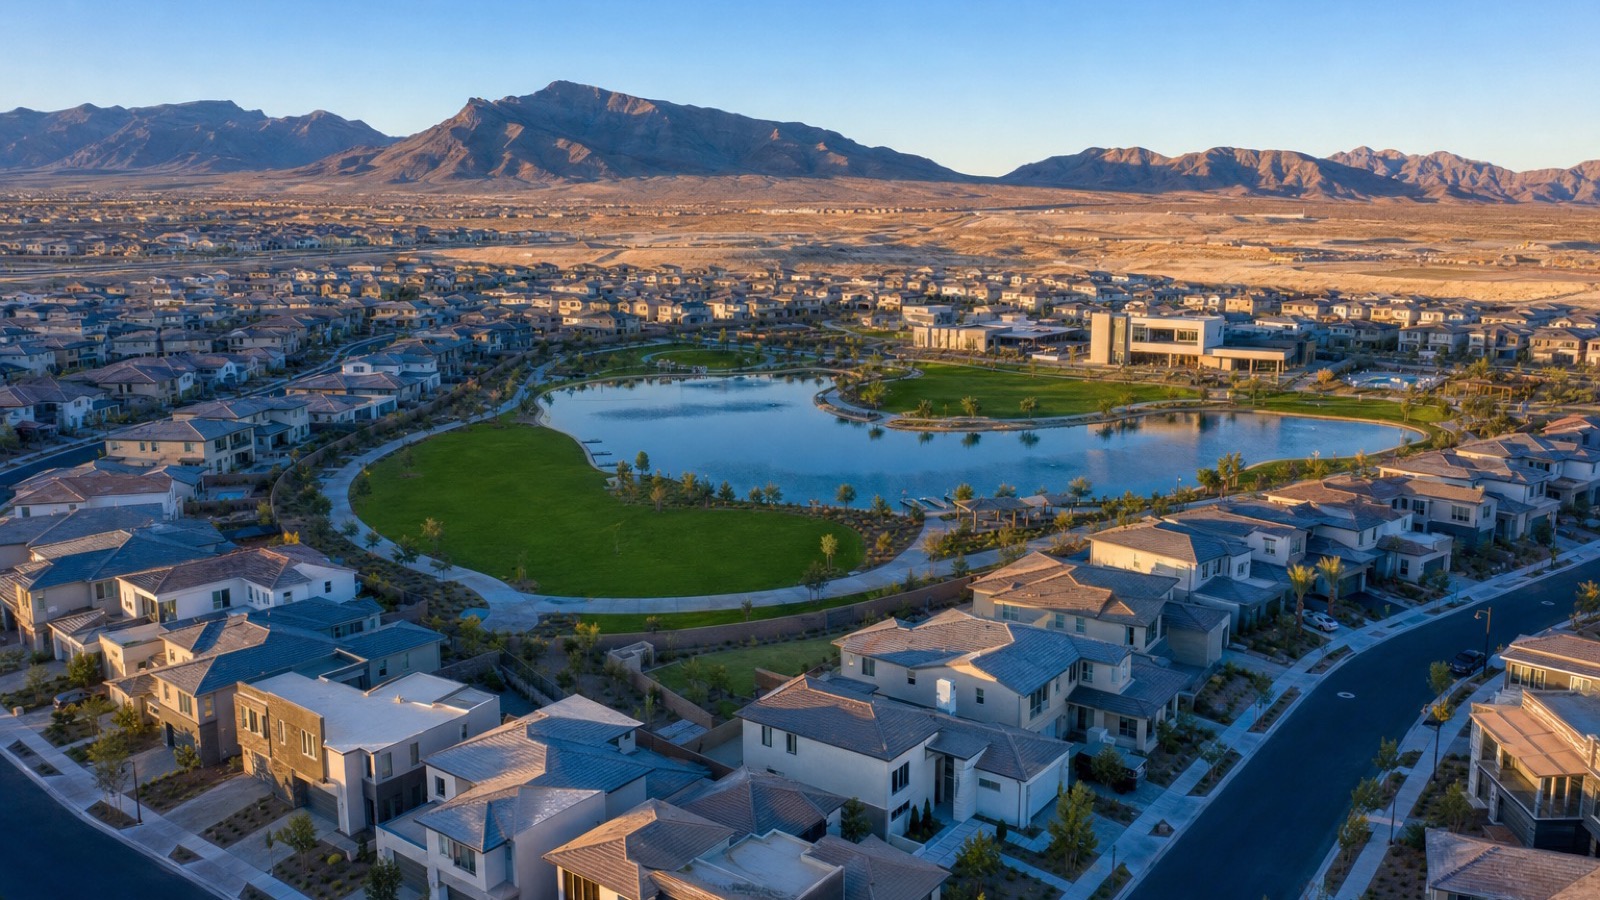
The state-level number hides a sharp geographic split, and the split is the most useful thing in this guide for anyone choosing a neighborhood. According to the Census Bureau's Vintage 2025 city and town estimates, released May 14, 2026, the city of Las Vegas grew from 645,774 at the 2020 base to 679,817 in July 2025, a 5.3% gain, while Henderson grew 11.5% to 353,289 and North Las Vegas grew 14.3% to 296,653. In the year to July 2025 alone, Henderson and North Las Vegas each added about 1.5% while the city of Las Vegas added 0.7%. The growth is not in the core; it is on the southeast and north edges where builders still hold land.
The state's own series makes the point even more sharply because it counts the unincorporated towns. According to the State Demographer's certified estimates, the town of Enterprise, which is the southwest valley from the 215 Beltway out to Mountain's Edge and Southern Highlands, reached 259,959 residents on July 1, 2025, up 4.1% in a single year and up from 213,073 at the 2020 census. Enterprise is now more than twice the size of Sparks and within sight of North Las Vegas. Henderson grew 3.7% in the state's series to 363,568. Meanwhile Paradise, the town that contains the Strip and the older neighborhoods around it, sat at 191,215, below its 2020 count, and Sunrise Manor at 212,012, also slightly below 2020. The valley is growing at its edges and thinning slightly at its center, exactly the pattern that keeps new-construction communities such as Cadence and the Villages at Tule Springs absorbing buyers while older central ZIPs trade at the lowest prices in the metro.
Northern Nevada tells a quieter version of the same story. Reno grew 7.4% since 2020 to 283,621 in the Census series, Sparks 3.2% to 111,902, and the growth leaders were the exurbs: Fernley in Lyon County up 14.5% to 26,214, and Mesquite in the far northeast corner of Clark County up 17.3% to 24,001, the fastest of any Nevada city over 20,000 people. According to the Census Bureau's May 2026 release, that outer-edge pattern held nationally, with midsized cities and exurbs growing while the largest cities slowed. For a buyer the implication is direct: the places adding people fastest, Enterprise, Henderson, North Las Vegas, Fernley and Mesquite, are the places where a home bought today has the most demand behind it in five years.
Who Is Moving to Nevada, and Which States Do They Come From?
California first, by a distance, then everyone else. According to the Census Bureau's state-to-state migration flows for 2024, built from the 2024 American Community Survey, 53,289 people who lived in California a year earlier were living in Nevada in 2024. The next largest origins were Texas at 8,327, Florida at 6,293, Arizona at 5,504, Washington at 4,887, Virginia at 4,626, Colorado at 3,886, Utah at 3,440, Illinois at 3,104 and Georgia at 2,604, with Hawaii, New York, Pennsylvania, Oregon and Idaho each sending between 2,100 and 2,600. Another 27,416 arrived from abroad. Add up every state and about 130,600 Americans moved into Nevada in 2024, while about 89,400 Nevadans moved out, a net domestic gain of roughly 41,000 in the survey's sample, with California alone contributing a net of about 32,000 after the 21,133 who went the other way.
| Origin state | Moved to Nevada, 2024 | Moved from Nevada to that state, 2024 | Net to Nevada |
|---|---|---|---|
| California | 53,289 | 21,133 | +32,156 |
| Texas | 8,327 | 6,147 | +2,180 |
| Florida | 6,293 | 9,338 | -3,045 |
| Arizona | 5,504 | 6,026 | -522 |
| Washington | 4,887 | 4,109 | +778 |
| Virginia | 4,626 | 2,572 | +2,054 |
| Colorado | 3,886 | 1,823 | +2,063 |
| Utah | 3,440 | 3,563 | -123 |
| Illinois | 3,104 | 2,130 | +974 |
| Idaho | 2,150 | 3,270 | -1,120 |
| Foreign countries | 27,416 | Not measured |
Two patterns in that table matter for housing. First, the California pipeline is the whole story of Nevada's net migration: without it, the state's exchanges with Florida, Arizona, Utah and Idaho are roughly a wash or slightly negative, which tells you that Nevada competes with those states for the same movers and sometimes loses. Second, the survey figures carry wide margins of error because they come from a sample, so treat the California figure as "about 50,000 a year" rather than a precise count. We covered the corridor in detail in our California to Las Vegas relocation guide; the demographic point here is that a metro receiving 50,000 Californians a year with a housing stock growing far slower than that will not see prices fall for lack of demand.
What Do IRS Records and DMV License Surrenders Say About Newcomers?
Two administrative datasets confirm the survey and add the details it cannot see: how much the movers earn and whether the flow is slowing. According to the IRS Statistics of Income migration data for 2022-2023, 66,782 tax returns representing 111,121 people moved into Nevada from other states between the 2022 and 2023 filing years, carrying $5.83 billion of adjusted gross income, while 57,805 returns representing 99,563 people left with $4.31 billion. The net gain was about 9,000 households, 11,600 people and $1.5 billion of annual income. California supplied 26,210 of the inbound returns, 39% of the total, representing 43,801 people and $2.69 billion of income, an average of $102,572 per return. That is above the $99,057 average for households that stayed put in Nevada and well above the $87,255 average for all inbound movers, which is the statistical version of something every agent in Summerlin and Henderson already knows: the California buyer arrives with more income and more equity than the market's existing owner. Texas sent 3,689 returns, Arizona 3,387, Florida 3,001, Washington 2,580 and Utah 2,473.
The DMV data is the freshest signal, and it says the flow cooled in 2025. According to the Las Vegas Review-Journal's July 29, 2026 report on Nevada DMV data, the DMV collected about 82,072 surrendered out-of-state or foreign driver's licenses and IDs in 2025, a 14% drop from 95,444 in 2024, and Californians surrendered 33,296 of them, a 14.6% drop from 38,970 the year before. California still accounted for roughly 41% of every license turned in. The same report quoted the State Demographer noting that close to 14 of Nevada's 17 counties now record more deaths than births, which is the fact behind the next section. A 14% drop in surrenders is real, and it lines up with the Census Bureau's own estimate that Nevada's net domestic migration fell from 16,473 in 2024 to 14,914 in 2025. It is a slowdown from a very high base, not a reversal: 33,000 Californians a year is still more than the entire population of Boulder City arriving every six months.
Are Births or Newcomers Driving Nevada's Growth?
Newcomers, overwhelmingly, and the balance is tipping further that way every year. According to the Census Bureau's Vintage 2025 components of change, Nevada recorded 32,511 births and 29,460 deaths in the year to July 2025, a natural increase of only 3,051 people. Net migration added 25,465: 14,914 from other states and 10,551 from abroad. In other words, 89% of Nevada's growth last year came from people moving in, and the state's natural increase would cover only about six weeks of a typical year's housing demand. Compare 2024, when international migration alone added 23,171 and domestic 16,473, and you can see both flows cooling as federal immigration enforcement tightened and the post-pandemic relocation wave faded.
Clark County's numbers mirror the state: 24,294 births against 20,315 deaths for a natural gain of 3,979, plus 8,890 international and 8,465 domestic migrants, for a total gain of 21,480. Washoe County's natural increase was just 269 people, with 1,560 international and 2,143 domestic migrants making up the rest of its 4,002 gain. And in the smaller counties the arithmetic has already flipped. Carson City recorded 794 deaths against 487 births, Nye County 969 deaths against 399 births, and Douglas County 628 deaths against 344 births; each of those places grew only because retirees and remote workers kept moving in. That is the State Demographer's "14 of 17 counties" observation in raw numbers.
For a buyer the implication is that Nevada's housing demand is imported, which cuts two ways. The upside is that the state's demand is tied to the relative cost and tax advantage it offers against California, Washington and Colorado, and that advantage is structural. The downside is that when migration slows, as it did in 2025, demand slows with it; there is no large young population at home forming new households to take up the slack. According to UNLV's Center for Business and Economic Research forecast, which we analyzed in our Clark County growth slowdown guide, the county's births are projected to stop outnumbering its deaths around 2032, after which growth becomes entirely migration-dependent and the county does not reach 3 million residents until roughly 2055. A market like that rewards buying in the neighborhoods newcomers choose and pricing patiently everywhere else.
How Old Is Nevada, and How Do Las Vegas and Reno Compare?
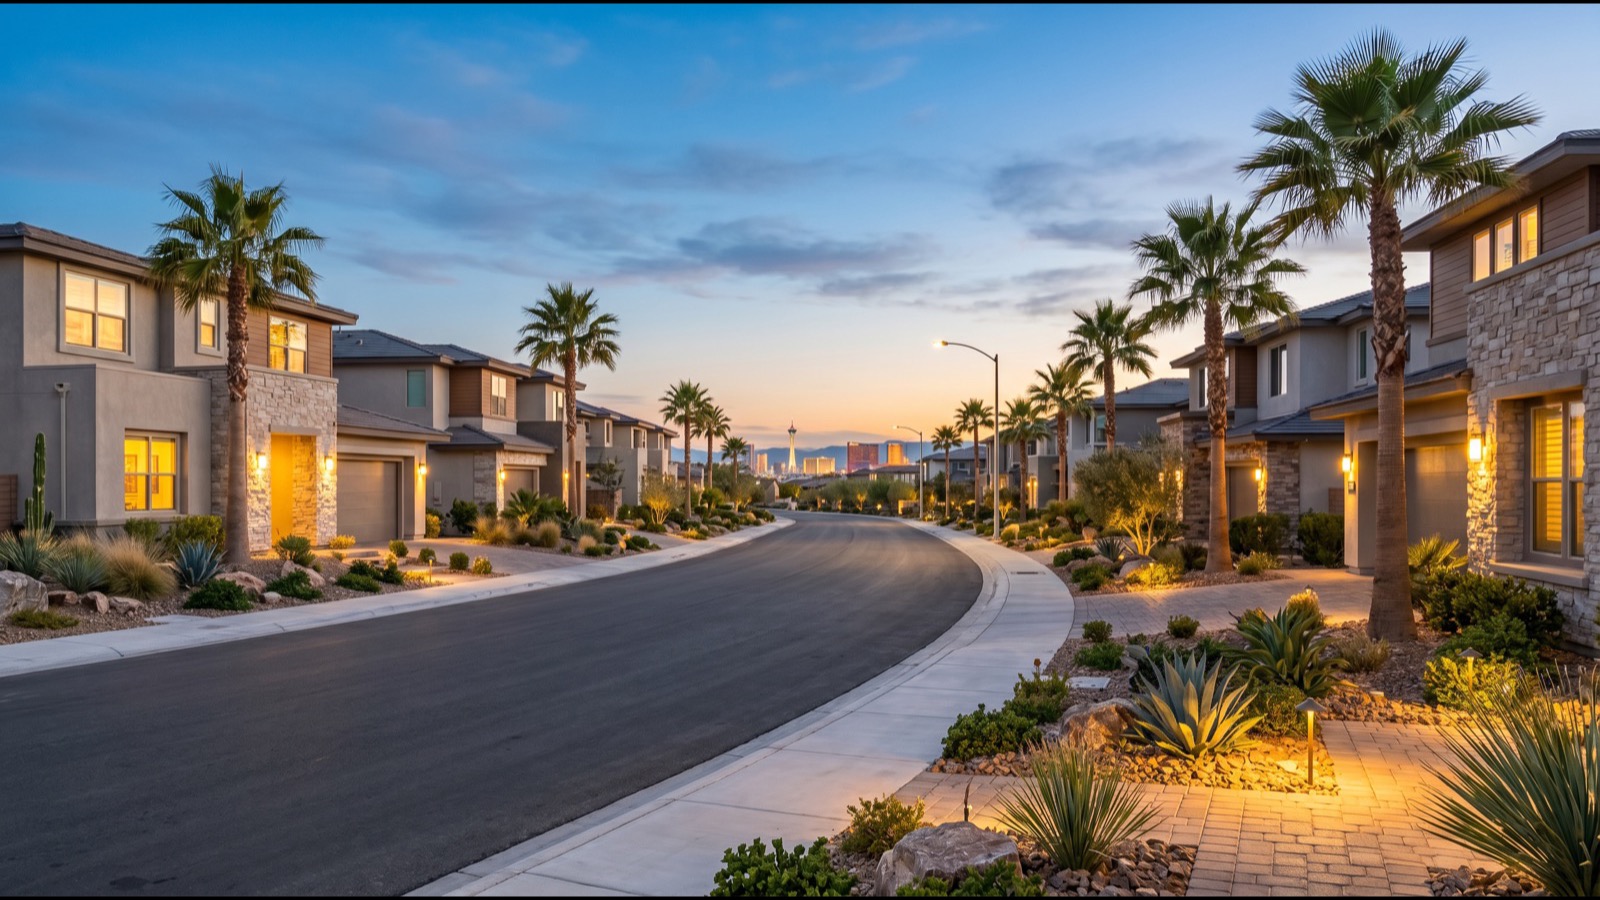
Nevada is a middle-aged state with a young north-of-the-valley city and an old capital, and the age profile explains a surprising amount about which housing product sells where. According to the Census Bureau's 2020-2024 American Community Survey, Nevada's median age is 39.1, a touch above the national 38.9, with 17.0% of residents aged 65 or older and 21.7% under 18. Clark County is slightly younger at 38.5 and Washoe County slightly older at 39.0, but the real spread shows up at the city level.
| Measure | Las Vegas city | Henderson | North Las Vegas | Reno | Sparks | Nevada | United States |
|---|---|---|---|---|---|---|---|
| Median age | 38.6 | 42.8 | 34.2 | 37.1 | 37.2 | 39.1 | 38.9 |
| Share aged 65 and over | 16.0% | 20.8% | 12.1% | 16.8% | 15.7% | 17.0% | 17.2% |
| Share under 18 | 22.4% | 20.8% | 25.5% | 19.9% | 22.1% | 21.7% | 22.0% |
| Average household size | 2.64 | 2.49 | 3.12 | 2.33 | 2.58 | 2.62 | 2.53 |
| Median household income | $73,877 | $90,138 | $79,542 | $80,760 | $89,056 | $78,260 | $80,734 |
| Per capita income | $39,906 | $50,228 | $31,935 | $47,051 | $42,099 | $41,354 | $44,673 |
| Bachelor's degree or higher | 27.7% | 37.4% | 18.9% | 36.8% | 27.6% | 27.9% | 35.7% |
| Poverty rate | 14.0% | 9.0% | 12.1% | 12.6% | 8.5% | 12.4% | 12.5% |
The two outliers are Henderson and North Las Vegas, and they are outliers in opposite directions. Henderson's median age of 42.8 and its 20.8% share of residents over 65 make it the oldest big city in the state, which is the demographic signature of Sun City Anthem, the Del Webb neighborhoods in Green Valley and the 55-plus communities that ring the city; it is also why single-story floor plans command a premium there. North Las Vegas, with a median age of 34.2, a 25.5% share of children and 3.12 people per household, is the state's family city, and it is why four- and five-bedroom new construction in the north valley sells as fast as it does. Reno sits between them, younger than the state with the smallest households at 2.33, the signature of a university city with a large renter base. Carson City, not in the table, has a median age of 42.4 and a 21.2% senior share, second only to Henderson among Nevada cities over 50,000.
What Do Nevadans Earn, and How Diverse and Educated Is the State?
Income in Nevada runs a little below the national median, but the geography inside the state matters more than the state figure. According to the Census Bureau's 2020-2024 American Community Survey, Nevada's median household income was $78,260 against $80,734 nationally, but Washoe County's was $88,096 against Clark County's $76,472, and inside the Las Vegas valley Henderson's $90,138 sat $16,000 above the city of Las Vegas' $73,877. In the north, Sparks at $89,056 actually out-earns Reno at $80,760, a reversal of the usual core-versus-suburb pattern that reflects Sparks' newer family housing in Spanish Springs and Kiley Ranch. Wages are moving up: according to the Bureau of Labor Statistics' County Employment and Wages release for Nevada, Washoe County's average weekly wage rose 4.8% over the year to $1,451 in the first quarter of 2026, while Clark County's rose 1.2% to $1,345, both below the $1,654 national average.
Education follows the same map. Statewide, 27.9% of adults 25 and over hold a bachelor's degree or higher, well below the 35.7% national share, but Henderson at 37.4% and Reno at 36.8% both exceed the nation while North Las Vegas sits at 18.9%. Washoe County as a whole, at 34.2%, is the most educated of the state's large counties, a legacy of the University of Nevada, Reno and the Tesla-era industrial recruitment that filled the Tahoe Reno Industrial Center with engineers. The practical reading for a buyer is that the neighborhoods with the highest degree share, Henderson, Summerlin and south Reno, are the neighborhoods where school demand and price resilience are strongest, and the neighborhoods with the lowest, North Las Vegas and the east valley, are where the entry-price housing lives.
Nevada is also one of the more diverse states in the country, and increasingly so. Hispanic or Latino residents make up 29.6% of the state, against 19.3% nationally, rising to 31.9% in Clark County, 34.7% in the city of Las Vegas and 41.7% in North Las Vegas; Washoe County is 26.1% Hispanic and Sparks 32.4%. The foreign-born share is 19.1% statewide and 21.9% in Clark County, against 14.1% nationally, and Nevada's international migration added 10,551 people in the year to July 2025 even after the slowdown. In our experience this shows up in the market as a large, growing pool of first-time buyers using FHA financing, multigenerational households that specifically want a casita or a next-gen suite, and a bilingual agent bench that is a business necessity in this state rather than a nicety.
What Share of Nevadans Own Their Homes?
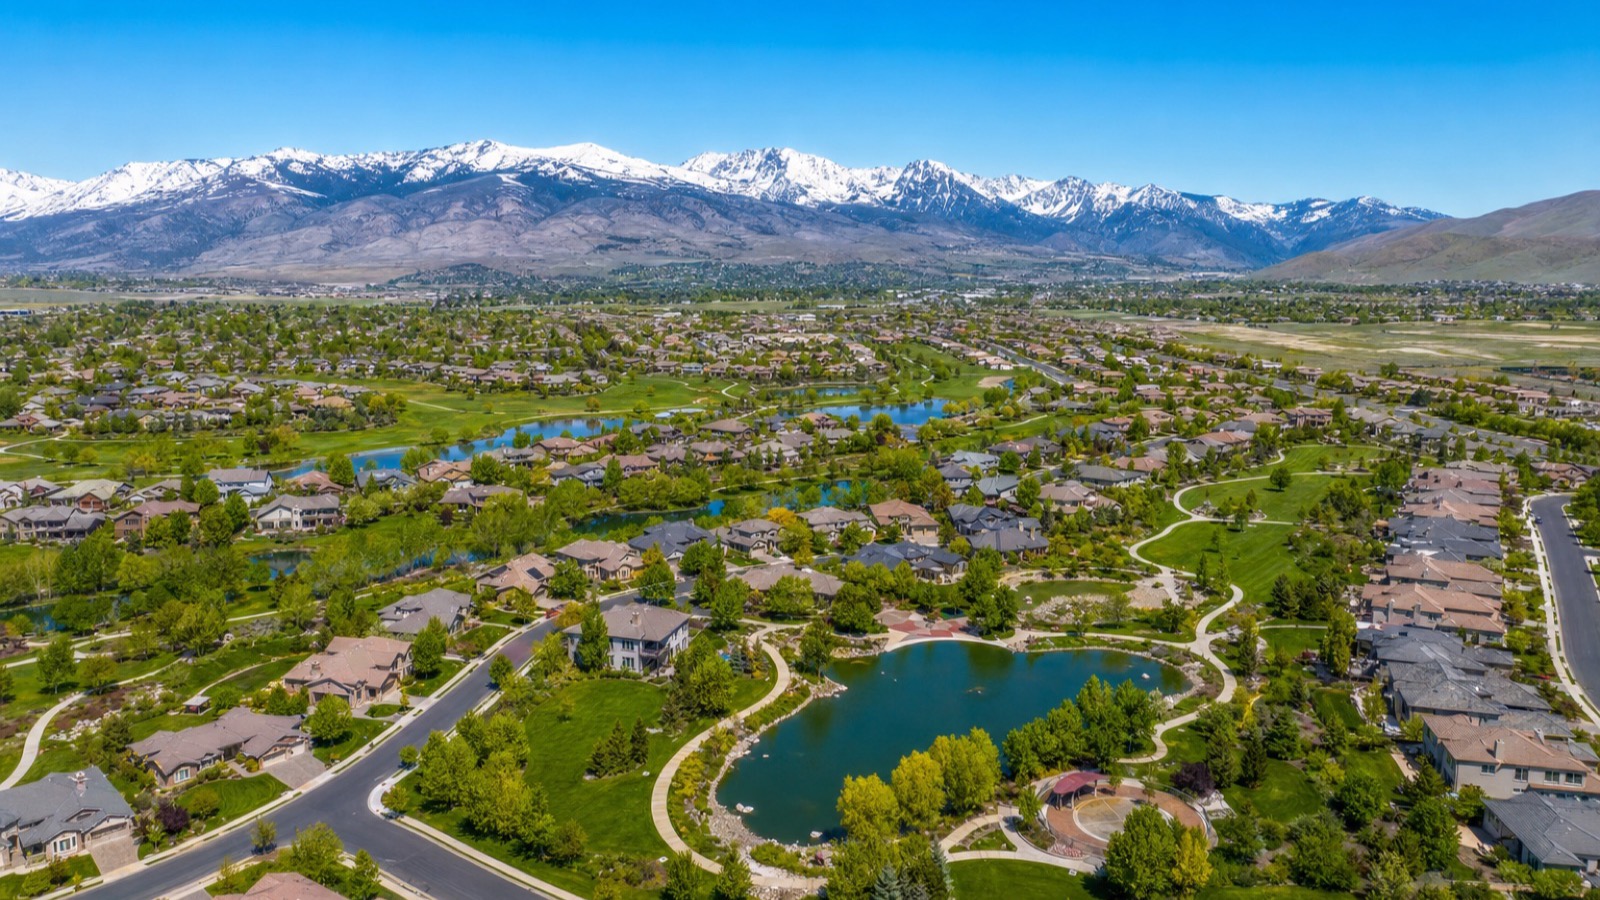
Fewer than the national average, and the gap is widest in the cities newcomers move to first. According to the Census Bureau's 2020-2024 American Community Survey, 60.0% of Nevada's occupied homes are owner-occupied against 65.2% nationally. Clark County's rate is 57.8% and Washoe County's 59.9%. At the city level the spread is dramatic: Henderson at 66.1% and North Las Vegas at 63.6% both exceed the national rate, while the city of Las Vegas sits at 56.6% and Reno at just 49.8%, the only major Nevada city where renters outnumber owners.
| Place | Owner-occupied share | Median owner-occupied home value | Median gross rent | Foreign-born share |
|---|---|---|---|---|
| Henderson | 66.1% | $484,900 | $1,824 | 14.3% |
| North Las Vegas | 63.6% | $404,400 | $1,705 | 20.4% |
| Carson City | 62.3% | $453,000 | $1,248 | 12.5% |
| Sparks | 59.8% | $483,800 | $1,716 | 15.9% |
| Las Vegas city | 56.6% | $427,900 | $1,563 | 20.9% |
| Reno | 49.8% | $548,300 | $1,556 | 15.8% |
| Nevada | 60.0% | $435,400 | $1,597 | 19.1% |
| United States | 65.2% | $332,700 | $1,413 | 14.1% |
Three things explain the low ownership rate, and each of them is an opportunity for a buyer. First, Nevada's population is imported: a household that arrived in the last five years is far more likely to rent for a year or two before buying, and Nevada has more of those households than almost any state. Second, the hospitality workforce, which is 22% of the state's jobs, earns wages that make the $475,000 Las Vegas median a stretch, so the valley has a large permanent renter class that supports investor demand for single-family rentals. Third, Reno's rate is depressed by the university and by the fact that its median home value, $548,300, is the highest of any major Nevada city against a median income that is not. What it means for you: in a state where four in ten households rent, a well-located home is both a place to live and a rentable asset with a deep tenant pool, and the ownership gap between Nevada and the nation is one reason the state's first-time buyer programs and FHA volume are so heavily used.
Which Industries Employ Nevadans in 2026?
The economy has diversified, but the base is still the one you would guess. According to the Bureau of Labor Statistics' Nevada economy at a glance, Nevada had 1,619,400 nonfarm jobs in August 2026, and leisure and hospitality accounted for 360,900 of them, or 22.3%, the largest concentration of any state. Trade, transportation and utilities followed at 298,900, professional and business services at 240,100, education and health services at 190,400, government at 185,000, construction at 116,800, financial activities at 79,200 and manufacturing at 68,600. The unemployment rate was 4.8%. According to DETR's August 2026 report, as covered by Fox5 Las Vegas, that was the lowest rate since February 2020; the state added 4,400 jobs in August, the Las Vegas area added 7,000 for the month and 14,200 over the year, and Reno added 1,100 for the month and 2,800 over the year.
| Industry | Jobs, August 2026 | Share of Nevada jobs | What it means for housing |
|---|---|---|---|
| Leisure and hospitality | 360,900 | 22.3% | Large renter base; entry-price demand near the Strip and in North Las Vegas |
| Trade, transportation and utilities | 298,900 | 18.5% | Warehouse and logistics jobs in North Las Vegas, Henderson and Sparks |
| Professional and business services | 240,100 | 14.8% | Office and remote workers concentrated in Summerlin, Henderson and south Reno |
| Education and health services | 190,400 | 11.8% | Fastest-growing stable income base; hospital corridors anchor demand |
| Government | 185,000 | 11.4% | Carson City's economy; Nellis and Creech in the Las Vegas north valley |
| Construction | 116,800 | 7.2% | Tracks the new-home pipeline; 9% of Las Vegas closings were built 2025 or later |
| Financial activities | 79,200 | 4.9% | Relocated back-office and fintech employers, largely in Summerlin and Henderson |
| Manufacturing | 68,600 | 4.2% | Tahoe Reno Industrial Center; the reason Washoe wages rose 4.8% in a year |
The industry mix explains the two-speed housing market. Washoe County's manufacturing and logistics growth has pushed its average weekly wage to $1,451, above Clark County's $1,345, and its median household income to $88,096, which is why Reno-Sparks prices run about $100,000 above Las Vegas for the same house even though the metro is one-fifth the size. Clark County's hospitality base keeps its median income lower and its renter share higher, but it also means a much deeper pool of buyers in the $350,000 to $450,000 band, which is where North Las Vegas, the east valley and Henderson's older neighborhoods trade. Across the 9,600+ closings we have represented, the single best predictor of a neighborhood's resale strength has been the diversity of employers within a 20-minute drive, and by that measure Henderson, Summerlin and south Reno lead the state.
What Do the State Demographer's Projections Say About the Next 20 Years?
Slower growth, not no growth, and a steady drift toward an older population. According to the Nevada State Demographer's County Population Projections 2025 to 2044, published October 1, 2025 from the 2024 certified base of 3,282,911, Nevada is projected to reach 3,326,902 residents in 2025, 3,475,280 in 2030, 3,569,883 in 2035, 3,643,424 in 2040 and 3,699,248 in 2044. The annual growth rate falls from 1.3% in 2025 to 0.7% in 2030, 0.5% in 2035 and 0.4% in the 2040s. Clark County is projected at 2,427,220 in 2025, 2,538,955 in 2030, 2,615,022 in 2035, 2,678,167 in 2040 and 2,726,185 in 2044. Washoe County is projected at 519,315 in 2025, 539,639 in 2030, 549,087 in 2035, 553,616 in 2040 and 557,497 in 2044, with its annual gain shrinking from 5,461 people to about 1,100.
| Year | Nevada | Clark County | Washoe County | Lyon County | Nye County |
|---|---|---|---|---|---|
| 2024 certified base | 3,282,911 | 2,392,490 | 513,854 | 65,116 | 51,802 |
| 2025 | 3,326,902 | 2,427,220 | 519,315 | 66,358 | 52,699 |
| 2030 | 3,475,280 | 2,538,955 | 539,639 | 71,607 | 57,222 |
| 2035 | 3,569,883 | 2,615,022 | 549,087 | 74,504 | 61,051 |
| 2040 | 3,643,424 | 2,678,167 | 553,616 | 76,124 | 63,876 |
| 2044 | 3,699,248 | 2,726,185 | 557,497 | 77,099 | 65,475 |
The projection is built with the REMI economic model and anchored to the Census Bureau's own migration assumptions, and the demographer notes that limited housing stock in some counties may constrain growth below what the economy could otherwise support. Notice the shape rather than the exact numbers. Nevada adds about 148,000 people between 2025 and 2030 and only about 56,000 between 2040 and 2044. Lyon and Nye Counties, the exurbs of Reno and Las Vegas, keep growing at 1.5% to 1.9% a year through 2030 while Douglas County is projected to shrink slightly, a pattern that says retirement-age counties without new subdivisions will lose population to deaths faster than they can attract movers. UNLV's separate forecast for Clark County, which we covered in our growth slowdown analysis, reaches similar conclusions by a different route. For housing the message is consistent across both: demand will keep rising, at a slowing pace, against a land supply that federal ownership caps, which points to steadier prices rather than either a boom or a crash.
What Does Nevada's Demographic Data Mean for Home Prices and Inventory?
Put the numbers together and they describe a market with slowing but positive demand, a structurally constrained supply, and a price level that has flattened for now. On the demand side, Nevada added 28,645 people in the year to July 2025. At the state's average household size of 2.62 that is about 10,900 new households needing a place to live, and Clark County's 21,480 new residents alone translate to roughly 8,000 households. On the supply side, across Las Vegas MLS data pulled through Repliers on September 19, 2026, the valley recorded 27,376 home closings in the 12 months ending September 18, 2026, at a $445,000 median, and 2,349 of those homes, 9%, were built in 2025 or later. The all-types median sat at $445,000 in September 2025 and $440,000 in August 2026, flat inside a $20,000 band all year, while active inventory reached 8,330 listings on September 15, 2026 with 43.3% of them carrying a price cut. Prices are not falling; they have paused while the market absorbs the 2025 migration slowdown.
Northern Nevada shows the same shape at a higher price. Across Northern Nevada MLS data pulled through Repliers on September 19, 2026, Reno and Sparks recorded 5,615 closings between September 19, 2025 and September 10, 2026 at a $555,000 median and a 58-day median time on market, with Reno at $570,000 and Sparks at $530,000; 2,138 homes were active at a $589,000 median asking price, and 7.9% of the year's closings were built in 2025 or later. Reno's combination of the state's lowest homeownership rate, its highest median home value and its highest wage growth is the profile of a market where renters are being pushed toward ownership by rising incomes but held back by price, which is why Sparks and the North Valleys, where Kiley Ranch and Spanish Springs offer newer homes $40,000 below the Reno median, keep absorbing the first-time buyers.
Here is how I translate each demographic fact into a buying decision. Migration-driven growth means the neighborhoods that newcomers choose, master plans with new construction, good schools and a 20-minute commute, will hold value best; the older central ZIPs will stay the cheapest. An aging population with a fading natural increase means single-story homes, 55-plus communities and lock-and-leave product will see rising demand for two decades. A 60% ownership rate with a deep renter class means a well-located rental will not sit vacant. And a slowing growth rate against federally capped land means the case for buying is time in the market rather than timing the market. You can watch the inventory and price-cut counts move every week on our market report and see what is available right now on the Las Vegas homes for sale and Reno homes for sale pages.
Which Nevada Communities Absorb the Newcomers?
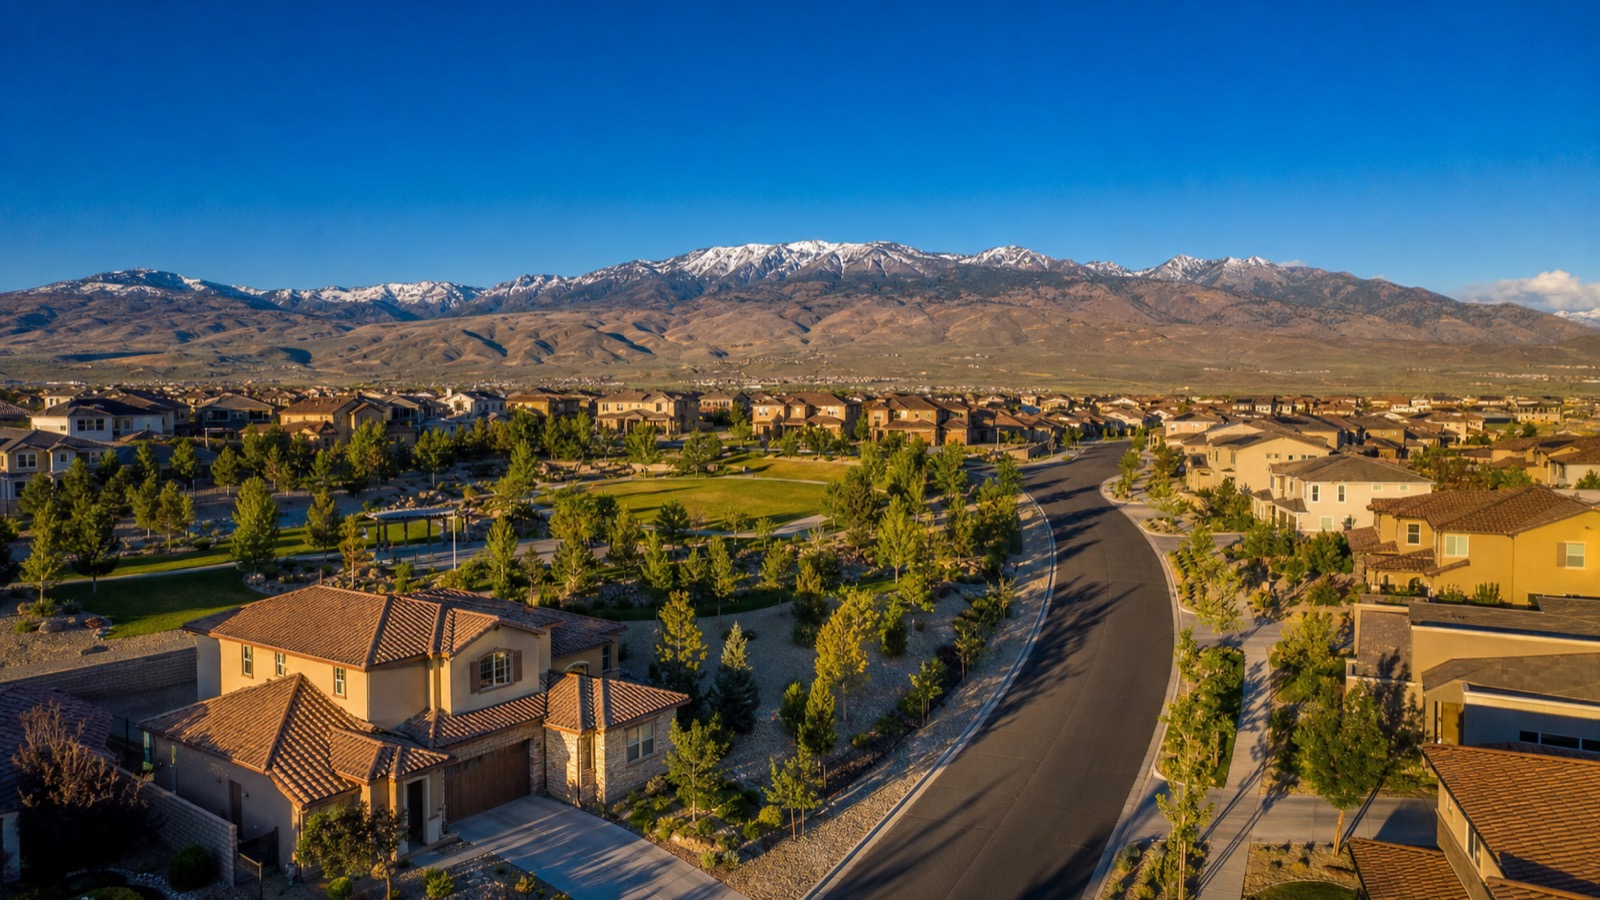
The MLS answers this better than any survey, because it records where people actually closed. Across Las Vegas MLS data pulled through Repliers on September 19, 2026, covering the 12 months ending September 18, 2026, Summerlin led every community in the state with 1,936 closings at a $630,000 median. Henderson's Cadence was second with 633 closings at $485,000, and 63% of those homes were built in 2025 or later, which makes Cadence the single largest landing zone for new arrivals in Southern Nevada. Anthem closed 548 at $649,990, Sun City Summerlin 518 at $450,000, Sun City Anthem 343 at $585,000, Inspirada 332 at $559,900, Skye Canyon 308 at $535,000 with 45% new-build share, and the Villages at Tule Springs in North Las Vegas 177 at $547,240 with 67% new-build share and just 1.8 months of supply, the tightest large community in the valley.
| Community | Closings | Median sold | Built 2025 or later | Months of supply | Who it attracts |
|---|---|---|---|---|---|
| Summerlin, all villages | 1,936 | $630,000 | 10% | 5.5 | California professionals, degree-holding families |
| Cadence, Henderson | 633 | $485,000 | 63% | 4.7 | First-time and move-up families buying new |
| Anthem, Henderson | 548 | $649,990 | 0% | 4.8 | Established families and retirees |
| Sun City Summerlin | 518 | $450,000 | 0% | 4.7 | Retirees, 55-plus |
| Inspirada, Henderson | 332 | $559,900 | 14% | 5.2 | Young families, remote workers |
| Skye Canyon, northwest Las Vegas | 308 | $535,000 | 45% | 4.8 | Families wanting new construction and elevation |
| Aliante, North Las Vegas | 234 | $417,000 | 0% | 4.4 | Value buyers, first-time families |
| Villages at Tule Springs, North Las Vegas | 177 | $547,240 | 67% | 1.8 | New-build families; the tightest supply in the valley |
Match the communities to the demographics above and the pattern is clean. Henderson's older, higher-income, degree-heavy profile is Anthem, Inspirada and the 55-plus enclaves. North Las Vegas' young, large-household profile is Aliante and Tule Springs. The town of Enterprise, the fastest-growing place in the state at 4.1% in a year, is Mountain's Edge, Southern Highlands and the southwest builder corridor. In the north, Reno's renters convert to owners in Sparks' Kiley Ranch and Spanish Springs and in south Reno's Damonte Ranch, while Carson City and Douglas County draw the retiree cohort that is aging the state. Smaller markets follow the same demographic logic: in our experience Mesquite's 17.3% growth is largely retirees, Pahrump in Nye County draws remote workers and retirees trading a longer drive for lower prices, and Boulder City, with a growth-control ordinance, barely grows at all.
Ready to Make Your Move to Nevada With Nevada Real Estate Group?
Demographics tell you where the demand is going; they do not tell you which house to buy. That second step is what we do, and we do it in both halves of the state. Nevada Real Estate Group is the largest team in Nevada by closings, with 150+ agents, 9,600+ closed transactions and $4.85 billion in career sales volume, including 789 homes and $440 million in 2025 alone, and we work Las Vegas, Henderson, North Las Vegas, Reno, Sparks and Carson City from two offices. When you call, we start with the same data in this guide, then narrow it to your situation: the communities where your income profile buys the most house, the school zones that match your household, the single-story inventory if you are joining the 55-plus cohort, and the current closings on each street rather than the metro median.

Start with our moving to Las Vegas guide if Southern Nevada is your target, or our Reno page for the north, and use the cost of living breakdown we published alongside this guide to turn the income figures above into a monthly budget. When you are ready to talk about specific neighborhoods, call our Las Vegas office at (702) 637-1759 or our Reno office at (775) 277-2120. We will send you a data packet for the communities on your shortlist, then video tours so your first trip to Nevada confirms a decision rather than starting a search. Nevada Real Estate Group is brokered by LPT Realty, license S.181401, at 8945 W Russell Rd, Suite 170, Las Vegas, NV 89148, and we hold 9,061+ verified five-star reviews from the households we have already moved here.
Frequently Asked Questions
What is the population of Nevada in 2026?
The Census Bureau's Vintage 2025 estimate put Nevada at 3,282,188 residents on July 1, 2025, up 28,645 from a year earlier and 5.7% above the April 2020 census base. The Nevada State Demographer's Governor-certified estimate for the same date is 3,349,303, about 2% higher, because the state builds its count from housing units and utility connections rather than the federal components-of-change method. Clark County holds 73% of the state and Washoe County 16%. The State Demographer projects 3,326,902 for 2025, 3,475,280 for 2030 and 3,699,248 for 2044.
Where do most people moving to Nevada come from?
California, by a wide margin. The Census Bureau's 2024 state-to-state migration flows count 53,289 people who moved from California to Nevada in 2024, against 8,327 from Texas, 6,293 from Florida, 5,504 from Arizona and 4,887 from Washington, plus 27,416 from abroad. IRS records for 2022-2023 show California supplied 26,210 of the 66,782 tax returns that moved into Nevada, 39% of the total, with an average adjusted gross income of $102,572. Nevada DMV data shows 33,296 Californians surrendered licenses in 2025, about 41% of all surrenders, though that was down 14.6% from 2024.
Is Nevada's population still growing or slowing down?
Both. Nevada grew 0.9% in the year to July 2025, which is still faster than the nation, but net domestic migration fell from 16,473 in 2024 to 14,914 in 2025, international migration fell from 23,171 to 10,551, and DMV license surrenders dropped 14%. Natural increase was only 3,051 people because deaths nearly matched births, and the State Demographer reports that close to 14 of 17 counties now record more deaths than births. The state's projections have annual growth slowing from 1.3% in 2025 to 0.4% by the 2040s while still adding about 417,000 people by 2044.
How do Las Vegas and Reno compare demographically?
Las Vegas is larger, more diverse and slightly lower-income; Reno is smaller, more educated and more expensive. The city of Las Vegas has a median age of 38.6, a median household income of $73,877, a 27.7% bachelor's-degree share, a 34.7% Hispanic share and a 56.6% homeownership rate. Reno has a median age of 37.1, a median income of $80,760, a 36.8% degree share, a 25.8% Hispanic share and a 49.8% homeownership rate, the lowest of any major Nevada city, against a $548,300 median home value that is the state's highest. Washoe County's average weekly wage of $1,451 also exceeds Clark County's $1,345.
What is the homeownership rate in Nevada?
According to the 2020-2024 American Community Survey, 60.0% of Nevada's occupied homes are owner-occupied, against 65.2% nationally. Henderson leads the state's large cities at 66.1%, followed by North Las Vegas at 63.6%, Carson City at 62.3%, Sparks at 59.8%, the city of Las Vegas at 56.6% and Reno at 49.8%. The gap reflects a population that is largely imported and rents before buying, a hospitality workforce of 360,900 people earning wages that make the median home a stretch, and a university-driven renter base in Reno. For investors it means a deep tenant pool; for buyers it means competitive first-time and FHA programs.
Which Nevada cities are growing fastest?
By percentage since the 2020 census, Mesquite leads Nevada's cities over 20,000 people at 17.3%, followed by Fernley at 14.5%, North Las Vegas at 14.3%, Henderson at 11.5%, Reno at 7.4%, the city of Las Vegas at 5.3% and Sparks at 3.2%, per the Census Bureau's Vintage 2025 estimates. The unincorporated town of Enterprise in the southwest Las Vegas valley grew 4.1% in the single year to July 2025 in the State Demographer's series and now has 259,959 residents, more than twice the population of Sparks. Growth is concentrated on the edges of both metros where builders still hold land.
What jobs do people in Nevada have?
Leisure and hospitality is the largest sector at 360,900 of Nevada's 1,619,400 nonfarm jobs in August 2026, or 22.3%, according to the Bureau of Labor Statistics. Trade, transportation and utilities employ 298,900, professional and business services 240,100, education and health services 190,400, government 185,000, construction 116,800, financial activities 79,200 and manufacturing 68,600. Unemployment fell to 4.8% in August 2026, the lowest since February 2020, with the Las Vegas area adding 14,200 jobs over the year and Reno 2,800. Washoe County's wages are rising faster, up 4.8% over the year, on manufacturing and logistics growth.
Does Nevada's population growth mean home prices will keep rising?
It supports steady prices rather than a boom. Nevada added about 10,900 households in the year to July 2025, but migration slowed and natural increase is near zero, so demand is growing more slowly than in the 2010s. Against that, developable land in Clark County is capped by federal ownership and Washoe is hemmed in by mountains, so supply cannot flood the market. Las Vegas medians have been flat between $437,000 and $455,000 for a year, with 8,330 active listings and 43.3% carrying price cuts as of September 15, 2026. The demographic case favors buying in the master plans where newcomers land and holding through the slower-growth decade.
Which Sources Inform This Nevada Demographics Guide?
Population counts and components of change are from the U.S. Census Bureau's Vintage 2025 county estimates, state estimates, city and town estimates and the Bureau's May 14, 2026 release. State-certified counts and projections are from the Nevada State Demographer's 2025 certified estimates and the Nevada County Population Projections 2025 to 2044. Age, income, education, ancestry and tenure figures are from the Census Bureau's 2020-2024 American Community Survey five-year demographic, economic and housing profiles. Migration origins are from the Census Bureau's 2024 state-to-state migration flows, the IRS Statistics of Income migration data for 2022-2023 and the Las Vegas Review-Journal's report on Nevada DMV license surrenders. Employment is from the Bureau of Labor Statistics' Nevada economy at a glance, the BLS county employment and wages release for Nevada and Fox5's coverage of DETR's August 2026 report. Housing figures are from Las Vegas MLS data and Northern Nevada MLS data pulled through Repliers on September 19, 2026, covering closings from September 19, 2025 through September 18, 2026 in Southern Nevada and through September 10, 2026 in Reno-Sparks; they are our own counts, not official association statistics. Household-formation arithmetic is an illustration built from those sources.