
"How is the luxury market doing?" is a question the headline numbers in the news do not answer. When Las Vegas REALTORS reports a single-family median of $470,000 for September 2026, that figure describes the typical resale in the valley, not the $1.4 million home in Summerlin or the $4 million hillside estate in Henderson. The luxury tier trades on a different clock, with a different buyer pool, and you will often read that it is outperforming the broader market. This edition tests that claim instead of repeating it.
This report lines luxury up against the whole market, measure by measure, on the same population and the same dates. The base is every home that closed in Las Vegas, Henderson, North Las Vegas and Boulder City from October 1, 2025 through September 30, 2026, counted by the date each sale closed, plus the same 12 months a year earlier and every active listing on November 1, 2026. I set that tabulation next to the latest Las Vegas REALTORS release so you can see where the board's numbers end and ours begin.
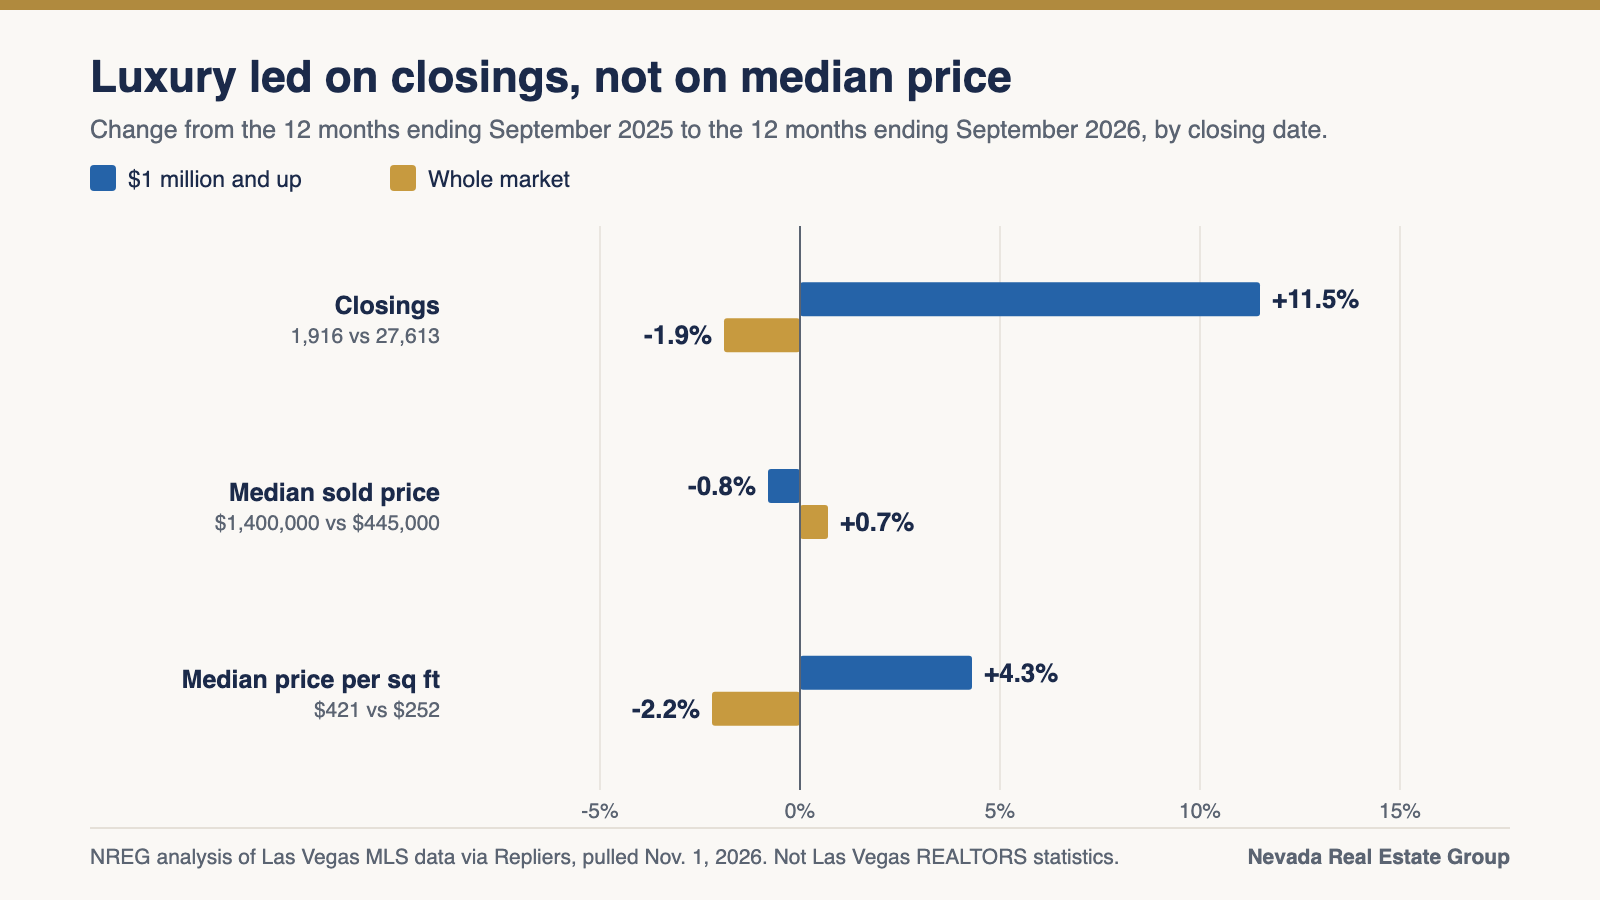
Las Vegas luxury beat the whole market on growth in closings and price per square foot in the year to September 2026, but not on speed, discounts or supply. Homes at $1 million and up closed 1,916 sales at a $1,400,000 median, up 11.5% while whole-market closings fell 1.9%. The median luxury sale took 38 days against 30, and 81% closed below list against 58%. Buyers can negotiate; sellers must price to closings.
- Closings of $1 million-plus homes rose 11.5% year over year, while whole-market closings slipped 1.9%.
- Without new construction, $1 million-plus closings rose 6.6%, and third-quarter growth slowed to 5.0%.
- Supply on November 1 ran 8.6 months at $1 million-plus and 12.5 at $2 million-plus, against 5.0.
- Anthem Country Club's luxury tier carried 4.4 months of supply; MacDonald Highlands carried 9.8 months.
- Price to closings: $1.2 million-plus homes that sat past 180 days closed at 87.4% of original list.
Updated November 1, 2026: the window now runs through September 2026, every median is computed from individual records, and the report adds a direct test of the claim that luxury is outperforming the broader market.
How Is the Las Vegas Luxury Market Performing Against the Whole Market?
The short version is that luxury closings are growing while the market's are not, but luxury still sells slower and further below list. The table below puts the three populations side by side. "Whole market" is every home (land excluded) that closed in Las Vegas, Henderson, North Las Vegas and Boulder City between October 1, 2025 and September 30, 2026. The two luxury columns are slices of that same population at $1 million and up and at $2 million and up, so every row compares like with like.
| Measure | Whole market | $1 million and up | $2 million and up |
|---|---|---|---|
| Closings, October 2025 to September 2026 | 27,613 | 1,916 | 545 |
| Share of all closings | 100% | 6.9% (6.1%) | 2.0% (1.6%) |
| Closings, year over year | down 1.9% (27,613 vs. 28,150) | up 11.5% (1,916 vs. 1,718) | up 17.5% (545 vs. 464) |
| Median sold price | $445,000 ($442,000) | $1,400,000 ($1,411,000) | $2,900,000 ($2,850,000) |
| Median sold price, year over year | up 0.7% | down 0.8% | up 1.8% |
| Median days on market | 30 (26) | 38 (33) | 42 (34) |
| Share sold below final list price | 58% (56%) | 81% (78%) | 81% (82%) |
| Share sold above final list price | 17% (18%) | 7% (7%) | 8% (6%) |
| Active listings on November 1, 2026 | 11,585 | 1,378 | 566 |
| Median asking price of active listings | $468,000 | $1,750,000 | $3,195,000 |
| Months of supply (actives divided by the 12-month monthly closing pace) | 5.0 | 8.6 | 12.5 |
Four things jump out. First, luxury is a small slice of the market by count: 1,916 of 27,613 closings, or 6.9%, and the $2 million-plus tier is 2.0%. Second, that slice is growing while the market around it is not. $1 million-plus closings rose 11.5% and $2 million-plus closings rose 17.5% on the prior 12 months, while whole-market closings fell 1.9%. $1 million-plus closings ran ahead of the prior year in nine of the 12 months, tied in December and fell behind in April and September. Third, luxury sales are slower and more negotiated: the median $1 million-plus home took 38 days against 30 for the market, and 81% closed below the final list price against 58%. Fourth, luxury carries far more supply relative to its sales pace: 8.6 months at $1 million-plus and 12.5 months at $2 million-plus, against 5.0 months for the whole market.
Prices, meanwhile, went essentially nowhere. The whole-market median rose 0.7%, the $1 million-plus median slipped 0.8% and the $2 million-plus median rose 1.8%. Those are small moves pointing in different directions, so I read all three as flat. Every figure in the table comes from one pull on November 1, 2026, counted by closing date; the method section near the end explains how it is built.
So is luxury outperforming the broader market, as you will often read? On one 12-month window, the answer changes with the measure.
| Measure | Whole market | $1 million and up | Who led |
|---|---|---|---|
| Closings, year over year | down 1.9% | up 11.5% | Luxury |
| Closings without new construction | down 1.9% | up 6.6% | Luxury, by less |
| Median sold price, year over year | up 0.7% | down 0.8% | Neither; both flat |
| Median price per square foot, year over year | down 2.2% | up 4.3% | Luxury, with a mix caveat |
| Median days on market | 30, up from 26 | 38, up from 33 | Whole market |
| Sold below final list price | 58% | 81% | Whole market |
| Median sale as a share of original list price | 97.4% | 94.3% | Whole market |
| Months of supply | 5.0 | 8.6 | Whole market |
On this window the claim is half right. Luxury closed more homes while the market closed fewer, and its median price per square foot rose while the market's fell. It did not sell faster, closer to asking or against thinner supply. Luxury usually trails on those measures, so the change matters too, and there it gained no ground: both groups slowed by about the same amount, and the share closing below list rose about two points in each. I have no year-ago supply figure on this basis. The price-per-square-foot gain also needs care: a median across different homes in different years measures the mix that sold, not what the same home would fetch. The typical $1 million-plus home was about 3,840 square feet in both years, but that does not make it the same home.
What Does the Gap Between Luxury and the Whole Market Mean for Buyers and Sellers?
It means Las Vegas is running as a two-speed market, and the speed you experience depends on your price point far more than on the headlines. Below $600,000, where 77.2% of the year's closings happened, homes still sell in about four weeks and close within a couple of points of asking. Above $1 million, closings rose year over year, but on buyers' terms: more time, more choice and a sale price below the last list price in four out of five transactions.
For buyers, the gap is leverage you can measure. At 8.6 months of supply, a $1 million-plus buyer has about 1.7 times as many alternatives, relative to the pace of sales, as a mainstream buyer. When 81% of luxury homes close below their final list price, an offer below list is the norm rather than an insult; how far below depends on the community and on how long the home has been listed.
For sellers, the gap is a warning about anchoring. On November 1, 2026, the median $1 million-plus asking price was $1,750,000, 25% above the $1,400,000 median closing, while the whole market's median ask of $468,000 sat about 5% above its $445,000 median closing. Part of that luxury gap is mix, because the largest and most unusual homes take longest to sell and so pile up among the actives. Part of it is aspiration. The closings tell you what buyers paid; the asks tell you what sellers hoped for.
The practical rule for both sides: work from the closed sales in your tier and community, not from the headline median or the asking prices around you. Our luxury homes over $1 million and Las Vegas luxury homes pages show the current shelf; the tables below show what it has been trading at.
What Do Las Vegas REALTORS Report for the Whole Market This Month?
The official whole-market numbers come from Las Vegas REALTORS, the association that runs the local MLS, and they are worth keeping separate from any brokerage's tabulation. The September 2026 release came out on October 6, 2026, and it was the newest available when I updated this report on November 1. I read it through its coverage by FOX5 and News 3. According to Las Vegas REALTORS, the median price of existing single-family homes sold in Southern Nevada in September 2026 was $470,000, down 1.1% from $475,000 in August, the same as September 2025 and below the all-time high of $490,000 set in May and June.
| Measure | September 2026 | Comparison |
|---|---|---|
| Median single-family sold price | $470,000 | Down 1.1% from $475,000 in August; same as September 2025; record $490,000 in May and June 2026 |
| Median condo and townhome sold price | $290,000 | Down 1.4% from September 2025 |
| Sales in the month | 2,169 homes, condos and townhomes | Homes down 7.4% and condos and townhomes down 12.6% from September 2025 |
| Single-family listings without offers | 7,995 | Up 6.6% year over year |
| Condo and townhome listings without offers | 2,796 | Up 7.3% year over year |
| Housing supply | Five months | Roughly four months a year earlier |
| Cash share of all sales | 23.5% | 23.0% a year earlier |
| Homes sold within 60 days | 75.9% | 72.0% a year earlier |
| Short sales and foreclosures | 1.1% of sales | 0.5% a year earlier |
Why do our numbers differ from the board's? Three reasons. The board reports single-family homes and condos separately, while my whole-market figure blends every home type in four cities. The board reports one calendar month at a time, while this report uses a 12-month window, which smooths out month-to-month noise and gives the thin luxury tiers enough sales to measure. And the coverage of the board's monthly release that I read gives no luxury tier at all, which is the gap this report exists to fill.
The two sources agree on direction. According to Las Vegas REALTORS, the September sales pace equated to a five-month supply, up from roughly four months a year earlier, and single-family listings without offers rose 6.6%; our tabulation also shows whole-market supply of 5.0 months. Nationally, according to the National Association of REALTORS, unsold inventory in September 2026 equaled a 4.8-month supply, unchanged from August and up from 4.5 months a year earlier. The mainstream Las Vegas market is close to balanced by either measure. The luxury tiers are not.
How Do Days on Market and Sale-to-List Ratios Change as Price Rises?
The luxury-versus-market gap is not a cliff at $1 million. It is a slope that starts around $600,000 and steepens at every step. The table below breaks the same 27,613 closings into eight sold-price bands. The last column divides each band's total sale dollars by its total final list dollars, a combined sale-to-list ratio that weights larger sales more heavily.
| Sold price band | Closings | Share of all closings | Median days on market | Took 90+ days | Sold below final list | Combined sale-to-list |
|---|---|---|---|---|---|---|
| Under $400,000 | 10,031 | 36.3% | 29 | 16.3% | 54% | 97.9% |
| $400,000 to $600,000 | 11,292 | 40.9% | 28 | 14.5% | 53% | 98.6% |
| $600,000 to $900,000 | 3,981 | 14.4% | 33 | 17.9% | 68% | 97.8% |
| $900,000 to $1.2 million | 920 | 3.3% | 35 | 20.1% | 79% | 95.8% |
| $1.2 million to $2 million | 844 | 3.1% | 37 | 23.8% | 81% | 95.3% |
| $2 million to $3 million | 298 | 1.1% | 37 | 24.1% | 81% | 94.9% |
| $3 million to $5 million | 150 | 0.5% | 44 | 28.0% | 77% | 95.8% |
| $5 million and up | 97 | 0.4% | 66 | 38.1% | 85% | 93.3% |
Read the table from top to bottom and the whole-market story turns into the luxury story. The two bands under $600,000 hold 77.2% of all closings, sell in a 28- to 29-day median, and only 53% to 54% of their sales close below the final list price. That is the market the headlines describe. From $900,000 up, three-quarters or more of sales close below list, the share of homes that needed 90 days or more reaches 20% or more, and the combined sale-to-list ratio drops by two to five points. By $5 million and up, the median sale took 66 days, 38.1% needed 90 days or longer, and 85% closed below list.
Because big sales carry deeper discounts, the combined ratio runs a little below the typical single sale. Across the 1,916 sales of $1 million and up, the median sale closed at 96.1% of its final list price and 94.3% of its original list price, so about two points of the typical luxury discount came from price cuts before the deal and about four from the final negotiation. At $5 million and up the median sale closed at 93.9% of final list and 91.9% of original. For the full breakdown of how the clock and the discount interact, read our guide to why luxury buyers misread days on market.
Are Las Vegas Luxury Home Prices Rising or Falling in 2026?
Neither, in any meaningful way. From October 2025 through September 2026, the median $1 million-plus sale was $1,400,000 against $1,411,000 in the prior 12 months, a 0.8% dip, and the median $2 million-plus sale was $2,900,000 against $2,850,000, a 1.8% gain. The whole-market median moved from $442,000 to $445,000, up 0.7%. I would not build a narrative on any of those moves. They are small and they point in different directions.
A caution about tier medians in general: a median computed above a price floor is a blunt tool for measuring appreciation. If the mix of homes selling above $1 million shifts toward the $1.0 million to $1.2 million range, the tier median falls even if every individual home held its value, which is why I read it alongside supply, days on market and sale-to-list ratios. The top of the range did move: the 95th percentile of sold prices rose 9.1%, from $1,100,000 to $1,200,000, while the median rose 0.7%. That is the same fact as more expensive homes closing; it does not show that any one home gained 9.1%. Our Las Vegas Luxury Home Price Index tracks the tier medians on a 90-day basis if you want the shorter-window view.
Month to month, the luxury median is noisy. By month of closing, the median $1.2 million-plus sale ranged from $1,630,000 in October 2025 to $1,880,900 in August 2026, and the six months through September ran between $1,656,500 and $1,880,900 with no steady direction, which is what a thin tier with a wide spread of home sizes looks like.
The whole market has the same flat shape at a lower altitude. According to Las Vegas REALTORS, the single-family median set its all-time high of $490,000 in May and June 2026, eased to $475,000 in August and $470,000 in September, and matched its September 2025 level. Henderson followed a similar arc, which our report on how Henderson home values moved in 2026 traces ZIP by ZIP. The honest description of 2026 pricing, at every tier, is stable. What changed is not price but leverage, and leverage shows up in days on market, sale-to-list ratios and supply rather than in the median.
How Much Luxury Inventory Is for Sale in Las Vegas Right Now?
On November 1, 2026, there were 1,378 active listings asking $1 million or more across Las Vegas, Henderson, North Las Vegas and Boulder City, at a median asking price of $1,750,000. Of those, 566 were asking $2 million or more, at a $3,195,000 median ask. The whole market carried 11,585 active listings at a $468,000 median ask. Those counts exclude listings already under contract and coming-soon listings, so they measure the homes a buyer could write an offer on that day. The median $1 million-plus listing had been on the market 66 days since its list date, and 36% had already cut their price.
Supply only means something against the pace of sales, so I divide each active count by its tier's average monthly closings over October 2025 through September 2026. The whole market works out to 5.0 months of supply, the $1 million-plus tier to 8.6 months and the $2 million-plus tier to 12.5 months. Put differently, if no new luxury listing came on the market and sales continued at the past year's pace, it would take almost nine months to clear the $1 million-plus shelf and more than a year to clear the $2 million-plus shelf, against five months for the market as a whole. One caution: listings are tiered by asking price and closings by sold price, which makes luxury supply look a little deeper. Against closings with a final list price in the same tier, supply runs 8.4 months at $1 million-plus and 11.7 at $2 million-plus.
The steepening continues higher up. On the same November 1 basis, 171 listings were asking $3 million to $5 million, 13.7 months of supply, and 130 were asking $5 million or more, 16.1 months, against 97 closings at that level in a full year. According to the National Association of REALTORS, the national market carried a 4.8-month supply in September 2026, so the mainstream Las Vegas market is running close to the national norm while its $3 million-plus tiers carry roughly three times as much.
Active counts move daily, and a tier this thin can swing by dozens of listings in a week. Supply is also a tier-wide average that hides large differences between communities, which the next section shows; our market report page carries live city and ZIP figures.
Which Luxury Communities Are Beating the Market, and Which Are Lagging?
Tier averages blend very different neighborhoods, and community is where a luxury buyer actually shops. The table below isolates the $1 million-plus tier inside eight of the valley's best-known luxury enclaves, using the same closing-date window and the same November 1 active count as the tier figures above, so the supply numbers compare directly with the 8.6 months for the luxury tier and 5.0 months for the whole market. A few luxury communities are tighter than the mainstream market, and several are about two to four times looser.
| Community | Closings | Median sold price | Median days on market (closed) | Active listings | Months of supply |
|---|---|---|---|---|---|
| Country Club Hills | 17 | $2,100,000 | 5 | 2 | 1.4 |
| The Summit Club | 8 | $18,835,000 | 63 | 1 | 1.5 |
| Anthem Country Club | 77 | $1,880,900 | 27 | 28 | 4.4 |
| Red Rock Country Club | 74 | $2,027,500 | 38 | 34 | 5.5 |
| MacDonald Highlands | 82 | $3,955,067 | 51 | 67 | 9.8 |
| Lake Las Vegas SouthShore | 31 | $1,669,950 | 105 | 30 | 11.6 |
| The Ridges | 39 | $3,250,000 | 66 | 39 | 12.0 |
| Ascaya | 12 | $8,175,000 | 51 | 20 | 20.0 |
The communities that are outperforming the luxury tier share one trait: steady buyer demand relative to the homes available. Anthem Country Club in Henderson was among the busiest of the eight, with 77 luxury closings at a $1,880,900 median in a 27-day median and 4.4 months of supply, tighter than the whole market. Red Rock Country Club in Summerlin closed 74 luxury homes at a $2,027,500 median in 38 days with 5.5 months of supply, close to the mainstream market at more than four times its median price. Two smaller Summerlin enclaves sit at the extreme: Country Club Hills closed 17 homes at a 5-day median against two active listings, and The Summit Club closed eight at an $18,835,000 median against one active listing.
The laggards are the hillside custom-home communities where each home is different and the buyer pool is thin. The Ridges closed 39 luxury homes behind its gates at a $3,250,000 median in a 66-day median, but carried 39 active listings on November 1, 2026, 12.0 months of supply, at a $3,999,000 median ask. MacDonald Highlands closed 82 at a $3,955,067 median in a 51-day median and had 67 active luxury listings on November 1, 2026, at a $5,850,000 median ask, 48% above its median closing. Ascaya carried 20.0 months of supply, with 20 active luxury listings against 12 closings in a year, and Lake Las Vegas SouthShore closed 31 luxury homes behind its gate at a 105-day median with 11.6 months of supply.
How Does the Las Vegas Market Behave Above $5 Million?
At the very top, the comparison with the whole market stops being a matter of degree. From October 2025 through September 2026, 97 homes closed at $5 million or more across the four cities, 0.4% of all closings and about eight a month, up from 74 in the prior 12 months. Their median sale took 66 days against 30 for the whole market, only 28.9% went under contract within 30 days, and 38.1% needed 90 days or longer. The median seller closed at 93.9% of the last list price and 91.9% of the original list price, while the two bands under $600,000 closed at 97.9% to 98.6% on the combined measure.
The shelf is deep. On November 1, 2026, 130 homes were listed at $5 million or more, not counting listings under contract, at an $8,000,000 median ask. The median one had been on the market 99 days since its list date, and 54.6% had been listed for 90 days or longer. That is 16.1 months of supply, more than three times the mainstream market's five months. At this level a long time on market is normal, so it says little on its own about how motivated a seller is.
The trophy communities show how uneven the top can be. The Summit Club closed eight homes of $1 million or more at an $18,835,000 median, with a $25,000,000 top sale, and had one active listing on November 1, 2026. Ascaya closed 12 at an $8,175,000 median, with a $17,250,000 top sale, but its 20 active listings had been on the market a median 169 days. MacDonald Highlands produced a $17,000,000 top sale and The Ridges a $14,000,000 one. Same price band, completely different leverage.
At this level the negotiation is community-specific: a 150-day listing is typical of Ascaya's current shelf but rare in a community with one active home, where it usually carries a story. Read any listing on our homes over $5 million search against its community's supply before deciding how hard to push.
What Does It Cost to Carry a Median Luxury Home Versus a Median Market Home?
The financing gap between luxury and the whole market is wider than the price gap suggests, because most luxury loans sit above the conforming limit. According to the Federal Housing Finance Agency, the 2026 baseline conforming loan limit for a one-unit property is $832,750, and the agency's county loan limit list sets Clark County at that same $832,750. According to the Consumer Financial Protection Bureau, loans above the limit are jumbo mortgages, and a jumbo can cost more than a conforming loan. A buyer putting 20% down on the $1,400,000 median luxury home borrows $1,120,000, well into jumbo territory.
Rates have also moved against financed buyers. According to Freddie Mac, the 30-year fixed-rate mortgage averaged 7.24% as of October 29, 2026, down from 7.32% the prior week and up from 6.17% a year earlier. The table uses those two Freddie Mac averages as reference rates for principal and interest only; actual jumbo quotes vary by lender, loan size and borrower, so treat the figures as a comparison rather than a quote.
| Tier | Median sold price | Loan at 20% down | Payment at 7.24% | Payment at 6.17% |
|---|---|---|---|---|
| Whole market | $445,000 | $356,000 | $2,426 | $2,173 |
| $1 million and up | $1,400,000 | $1,120,000 | $7,633 | $6,838 |
| $2 million and up | $2,900,000 | $2,320,000 | $15,811 | $14,164 |
The year's rate move added $253 a month to the payment on the median whole-market home, $795 a month on the median luxury home and $1,647 a month at the $2 million-plus median. At 7.24% with 20% down, every $100,000 off the price of a financed home takes about $545 off the monthly payment for as long as the loan is held. Luxury buyers who plan to finance should be fully underwritten, not just pre-qualified, before they start negotiating. Our mortgage pre-approval guide explains the difference, and the mortgage calculator lets you run your own down payment and rate.
How Should Luxury Sellers Price in a Two-Speed Market?
The data gives sellers an uncomfortable but clear answer: in the luxury tier, the discount grows the longer a home takes to sell. The table below sorts the $1.2 million-plus closings from October 2025 through September 2026 by how long each home took to go under contract.
| Days on market at contract | Share of closings | Median sale to original list | Median amount below original ask |
|---|---|---|---|
| 0 to 14 days | 26.5% | 97.9% | $39,999 |
| 15 to 30 days | 16.8% | 96.0% | $75,000 |
| 31 to 60 days | 19.7% | 93.4% | $125,000 |
| 61 to 90 days | 11.9% | 91.9% | $185,000 |
| 91 to 180 days | 18.4% | 89.8% | $210,500 |
| 181 days or more | 6.6% | 87.4% | $299,500 |
The discount grows with every step. A $1.2 million-plus home that went under contract within two weeks closed at a median 97.9% of its original asking price, about $40,000 under; one that sat past 180 days closed at 87.4%, a median $299,500 below its first price. Compare the mainstream bands, where only 53% to 54% of homes under $600,000 closed below their final list price at all. This is not a controlled test, because homes that sit can differ in condition and location as well as price. But the pattern fits a thin buyer pool comparing your home with 8.6 months of alternatives at $1 million-plus, or 12.5 months at $2 million-plus.
That is why a luxury seller should price against the closings in their community, not against the asking prices of the homes still for sale. The actives are the homes that have not sold, and in a tier where the median ask runs 25% above the median closing, they are a poor guide to value. Pull the last six to twelve months of closed sales on your street or in your enclave, weight the most recent ones most heavily, and set a price that a buyer can justify from those numbers.
Timing also matters. From October 2025 through September 2026, 43% of $1.2 million-plus closings went under contract within 30 days, so the fast, near-ask sale is common enough to plan for. If a listing in a tighter community such as Anthem Country Club or Red Rock Country Club has not drawn an offer by day 45, I would revisit the price. In a slower community such as MacDonald Highlands, give it longer before concluding anything. Our sellers page explains how to start.
How Should Luxury Buyers Use These Numbers to Negotiate?
Start from the tier, then narrow to the community. Across the $1 million-plus tier, 81% of homes closed below the final list price from October 2025 through September 2026, and only 7% closed above it, so an offer under list is the expected opening rather than an aggressive one. How far under depends on two numbers you can read directly from the tables above: how long the home has been listed, and how much supply its community carries.
In a tighter community like Anthem Country Club at 4.4 months of supply or Red Rock Country Club at 5.5 months, both measured on November 1, 2026, a rejected offer can cost you the house. MacDonald Highlands at 9.8 months and Ascaya at 20.0 months carry close to a year's worth of luxury listings or more, so a rejected offer there usually leaves time to regroup and comparable listings to tour. Match your aggressiveness to the supply, and use the discount ladder to calibrate the number. A $1.2 million-plus home that had been listed 61 to 90 days sat in a group that closed at a median 91.9% of original list, which is a reasonable anchor for an opening offer on that kind of listing.
Read the listing history, not just the counter on the listing sheet. A home showing 20 days on market may have been withdrawn and relisted after months of exposure. Ask for the cumulative days on market, every price change and every prior listing of the address; the guard-gated communities and luxury communities pages show where those listings sit.
Many Las Vegas luxury homes sit inside a homeowners association, and Nevada law gives buyers a specific protection there. According to Nevada Revised Statutes 116.4109, the seller must furnish a resale package that includes the declaration, bylaws and rules, the monthly assessment and any unpaid obligations, the current budget with a reserve summary, any unsatisfied judgments or pending legal actions against the association, transfer fees and proof of insurance, and the buyer may cancel by written notice until midnight of the fifth calendar day after receiving it. In a community with a pending assessment or litigation, that package can matter more than any price negotiation.
Why Are Luxury Closings Rising While the Broader Market Stays Flat?
The MLS data shows what happened, not why, so I want to be careful here. What the numbers establish is that $1 million-plus closings rose 11.5% and $2 million-plus closings rose 17.5% on the prior 12 months while the whole market slipped 1.9%, and that luxury sales took longer than a year earlier: 38 days against 33 at $1 million-plus. That combination looks like price discovery rather than a buying frenzy: more luxury sellers met buyers at prices the buyers were willing to pay.
Three checks narrow the claim. New construction supplied almost half of the gain: homes built in the closing year or the year before rose from 135 to 229 closings of $1 million or more, 94 of the 198 added sales, and resale closings at that level rose 6.6%, from 1,583 to 1,687. Geography mattered too: Henderson-address closings rose 25.7%, from 408 to 513, against 7.2% for Las Vegas addresses, from 1,298 to 1,392. A rising floor does not explain it: lifting the $1 million line by the market's 0.7% median gain still leaves 1,878 closings, up 9.3%, and the $1.2 million-plus band grew 13.7% against 6.3% for $1.0 million to $1.2 million.
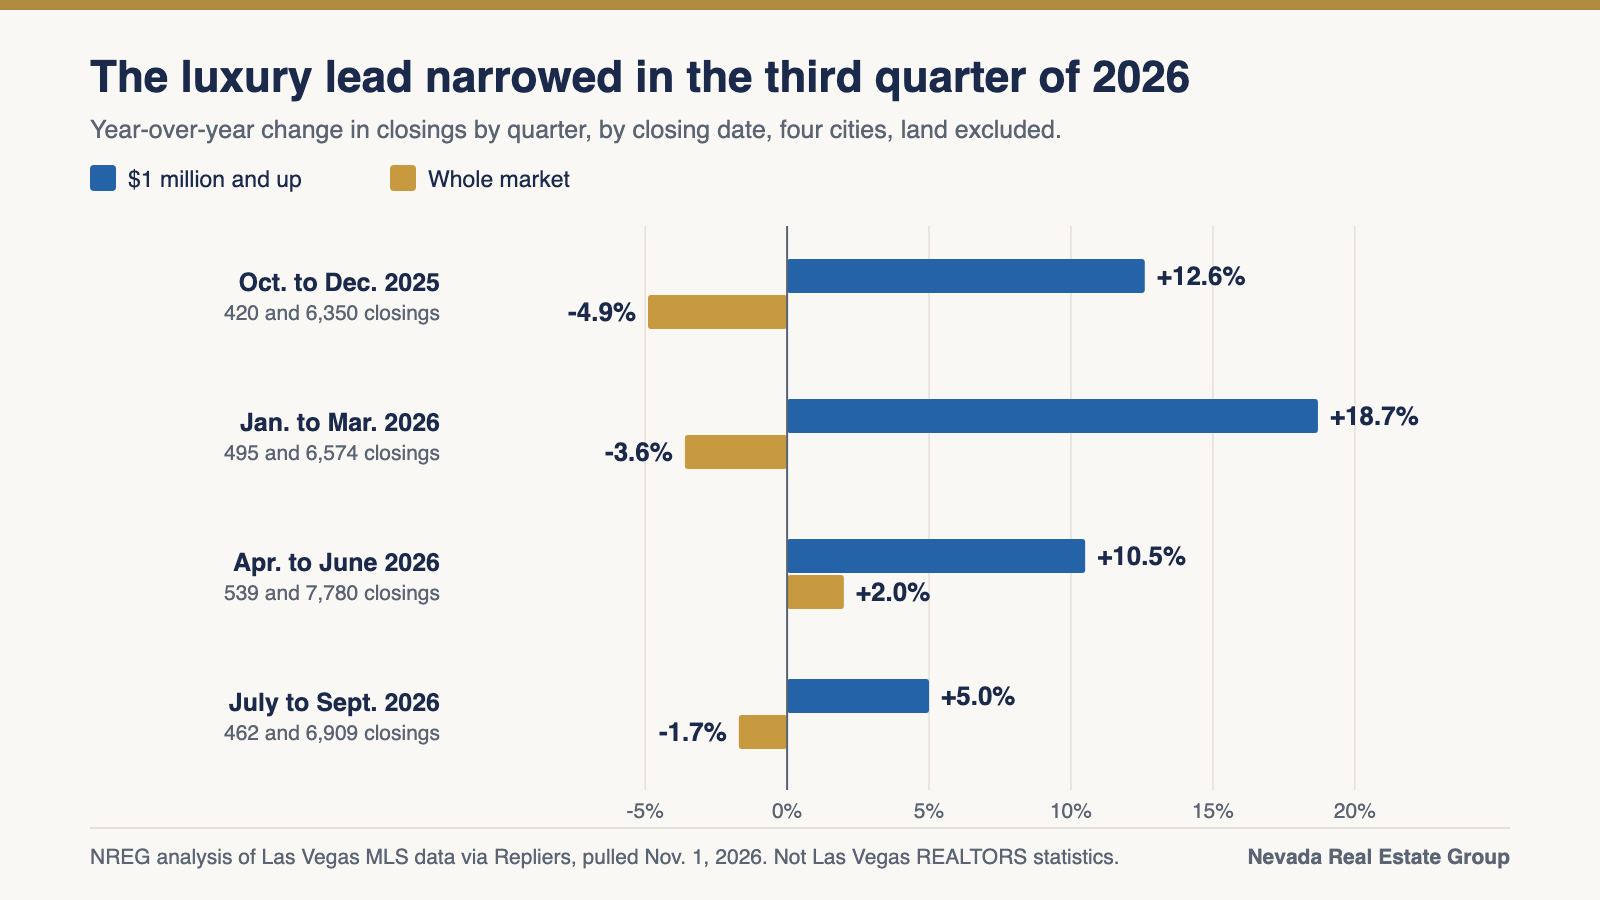
The lead is also shrinking. Year-over-year growth in $1 million-plus closings ran 12.6% in the fourth quarter of 2025, 18.7% and 10.5% in the first two quarters of 2026, and 5.0% from July through September, and September alone fell 8.3%, 143 closings against 156, though that is one month, one day short of our settled-month rule. Nationally, the picture is mixed too: according to Realtor.com's September 2026 luxury report, the luxury entry point, the 90th percentile of listing prices, fell 3.6% from a year earlier to $1,199,321, the 30th straight month of annual declines, while listings at that level spent three fewer days on the market. That release covers asking prices and does not name Las Vegas.
A few structural facts may help explain why luxury closings held up even as mortgage rates rose. Nevada's tax treatment of households is written into the state constitution. According to the Nevada Constitution, Article 10, Section 1, no income tax shall be levied upon the wages or personal income of natural persons, and no inheritance tax shall ever be levied. For a high-income household comparing Las Vegas with a high-tax coastal market, that is a constitutional feature rather than a policy that can lapse with a budget. Our moving to Las Vegas guide covers what relocating buyers should know about the rest of the cost picture.
Financing sensitivity also differs by tier. A buyer who puts a large share of the price down, or pays cash, feels a rate increase less than a first-time buyer stretching for a payment. The coverage I read gives no cash share for the luxury tier, and it put cash at 23.5% of all local sales in September 2026, so I will not put a number on the luxury cash share here.
What the data does not show is widespread distress. According to Las Vegas REALTORS, short sales and foreclosures combined were 1.1% of all local sales in September 2026, up from 0.5% a year earlier, and luxury prices held flat. This is a normal market for luxury buyers with time and choice, not a falling one.
How Is This Report Built, and How Does It Differ From Our Other Luxury Coverage?
The base data is MLS data pulled through Repliers on November 1, 2026 for every home sold in Las Vegas, Henderson, North Las Vegas and Boulder City, with land excluded, that closed between October 1, 2025 and September 30, 2026, plus the same 12 months a year earlier: 55,763 closings in all. Every count, median and share comes from the individual records. Days on market is the MLS's own days-on-market figure, which stops at the contract date rather than the closing date. Active listings are those marked active on November 1, 2026; 949 listings under contract and 90 coming-soon listings were left out across all prices, and active days on market is measured from each listing's list date. These are our own tabulations, not official Las Vegas REALTORS statistics. Based on information from the Greater Las Vegas Association of REALTORS® Multiple Listing Service for the period October 1, 2024 through November 1, 2026.
Editions since October 2026 window sales by the date they closed. The feed's sold date does not reliably match the closing date, and counted that way January 2026 shows 3,647 sales against 1,792 by closing date. By closing date no month stands out. The November and January dips in the table below show up in both years, which marks them as seasonal, and the largest bump, June 2026, ran 9% above the average of May and July. This edition also computes every median from the records rather than the feed's summary statistics, which are approximate on samples this large; that moved the last edition's whole-market median of $444,188 to $445,000 on its own window. September 2026 sat one day short of our 33-day settled-month rule on November 1, but its count has stopped moving: 2,185 closings had posted by October 16 and 2,188 by November 1, so a few more could still post. Because the windows differ, these figures differ from our days-on-market study, which covers closings in the 12 months ending September 18, 2026. Communities are matched by recorded MLS subdivision names, counting abbreviated spellings such as Cntry. MacDonald Highlands follows the City of Henderson's map of the Foothills at MacDonald Ranch Master Association (MacDonald Highlands): the MacDonald Highlands, MacDonald Foothills, Foothills at MacDonald Ranch, Stone Mountain Ridge, Palisades and Highlands plats in ZIP 89012, but not Terrazzo 2, Ascaya, Obsidian or Neo. The Ridges is the Summerlin Village 18 plats behind its gates, including Fairway Hills and listings labelled The Ridges, without the Echo Ridge, Southstar and Sunset Ridge production plats outside them. The Summit Club is Summerlin Village 17, not Village 17A, which is The Peaks. Red Rock Country Club includes the Red Rock Golf Club plats, Ascaya includes its former Crystal Ridge plats, and Lake Las Vegas SouthShore follows the City of Henderson's map of the Lake Las Vegas SouthShore Residential Community, including the Mantova condominium and villa plats behind the gate but not Viera or the MonteLago Village plats (Southshore Parcel 27, Shoreline) outside it. "New construction" means a home built in the closing year or the year before.
| Month | Whole market, prior year | Whole market, this year | $1 million and up, prior year | $1 million and up, this year |
|---|---|---|---|---|
| October | 2,388 | 2,221 | 113 | 144 |
| November | 2,047 | 1,861 | 109 | 125 |
| December | 2,242 | 2,268 | 151 | 151 |
| January | 1,955 | 1,792 | 106 | 140 |
| February | 2,228 | 2,032 | 137 | 157 |
| March | 2,635 | 2,750 | 174 | 198 |
| April | 2,688 | 2,578 | 170 | 164 |
| May | 2,577 | 2,470 | 163 | 171 |
| June | 2,364 | 2,732 | 155 | 204 |
| July | 2,458 | 2,530 | 159 | 172 |
| August | 2,221 | 2,191 | 125 | 147 |
| September | 2,347 | 2,188 | 156 | 143 |
| 12-month total | 28,150 | 27,613 | 1,718 | 1,916 |
This report is the side-by-side comparison; our other luxury pieces go deeper on single angles. The days-on-market study is the deep dive on time and discounts. The Las Vegas Luxury Home Price Index tracks tier medians and supply on a 90-day basis, and the snapshot of homes above $1M covers the City of Las Vegas and Henderson. My broker's read of the 2026 luxury market is the editorial view, the luxury sales record post covers the top-end sales, and the guard-gated community ranking compares the enclaves themselves. For the mainstream market, see the Las Vegas real estate market report for September 2026.
Frequently Asked Questions
How is the Las Vegas luxury market doing in November 2026?
It is busier than a year ago but firmly on buyers' terms. From October 2025 through September 2026, $1 million-plus homes in Las Vegas, Henderson, North Las Vegas and Boulder City closed 1,916 sales at a $1,400,000 median, up 11.5% on the prior 12 months while whole-market closings slipped 1.9%. Those sales took a 38-day median against 30 for the market, 81% closed below the final list price, and supply on November 1, 2026 ran 8.6 months against 5.0 overall.
Is the Las Vegas luxury market outperforming the broader market?
On growth in closings, yes; on speed, discounts and supply, no. From October 2025 through September 2026, $1 million-plus closings rose 11.5% while whole-market closings fell 1.9%, and the median price per square foot rose 4.3% against a 2.2% decline. But the median luxury sale took 38 days against 30, 81% closed below list against 58%, and the median sold price slipped 0.8%. Without new construction, luxury closings rose 6.6%, and growth slowed to 5.0% from July through September.
What share of Las Vegas home sales are $1 million or more?
About 7%. Of the 27,613 homes that closed in Las Vegas, Henderson, North Las Vegas and Boulder City from October 2025 through September 2026, 1,916 sold for $1 million or more, or 6.9%, up from 6.1% a year earlier. The $2 million-plus tier was 545 closings, 2.0%, and the $5 million-plus tier was 97 closings, 0.4%. By contrast, the two bands under $600,000 accounted for 77.2% of all closings.
Is Las Vegas a buyer's market for luxury homes right now?
By supply, yes. Dividing active listings on November 1, 2026 by the monthly pace of closings over the prior year, the $1 million-plus tier carried 8.6 months of supply and the $2 million-plus tier 12.5 months, against 5.0 months for the whole market. Las Vegas REALTORS put whole-market supply at five months in September 2026. Some communities are much tighter, such as Anthem Country Club's luxury tier at 4.4 months and Country Club Hills at 1.4, so the answer depends on where you shop.
How long do Las Vegas luxury homes take to sell compared with the whole market?
The median $1 million-plus home took 38 days to go under contract from October 2025 through September 2026, against 30 days for the whole market, and the median $2 million-plus home took 42 days. The gap widens at the top: homes at $5 million and up took a 66-day median, and 38.1% of them needed 90 days or longer. A year earlier, the medians were 33 days for $1 million-plus, 34 for $2 million-plus and 26 for the whole market, so every tier slowed.
Are Las Vegas luxury home prices dropping?
No. The median $1 million-plus sale was $1,400,000 from October 2025 through September 2026, down 0.8% from $1,411,000 a year earlier, while the $2 million-plus median rose 1.8% to $2,900,000. Both moves are small enough to call flat. What has changed is leverage: luxury homes take longer to sell and most close below list. According to Las Vegas REALTORS, the whole-market single-family median was $470,000 in September 2026, the same as a year earlier.
Why are your numbers different from the Las Vegas REALTORS median?
They measure different things. Las Vegas REALTORS reports one calendar month for single-family homes and condos separately, and its September 2026 single-family median was $470,000. My whole-market figure blends every home type in four cities over 12 months of closings, October 2025 through September 2026, which produced a $445,000 median. The coverage of the board's monthly release that I read gives no luxury tier, so the luxury figures in this report are our own tabulation of MLS data pulled through Repliers, not official statistics.
What loan limit applies to Las Vegas luxury purchases in 2026?
According to the Federal Housing Finance Agency, the 2026 conforming loan limit for a one-unit home in Clark County is $832,750. Any larger loan is a jumbo mortgage, which can cost more than a conforming loan. A buyer putting 20% down on the $1,400,000 median luxury home would borrow $1,120,000, and at Freddie Mac's 7.24% average for October 29, 2026, the principal and interest would be about $7,633 a month, before taxes, insurance and HOA dues.
How Can Nevada Real Estate Group Help You Buy or Sell in the Las Vegas Luxury Tier?
The numbers in this report are a starting point for a luxury conversation, but the decision always comes down to one community, one street and one home. Our team can pull the closed sales, the active competition, the cumulative days on market and the price history for the specific homes you are considering or competing against, so the offer or the list price rests on what the market has actually paid rather than on the headline median.
Nevada Real Estate Group is the #1 real estate team in Nevada and #44 in the nation, brokered by LPT Realty, with 9,600+ closed transactions, $4.85 billion-plus in total sales volume, 150+ licensed agents, 9,097+ verified five-star reviews and 16+ years in this market. In 2025 alone the team closed 789 homes and more than $361.5 million in volume.
If you are buying above $1 million in Summerlin, Henderson or anywhere in the Las Vegas Valley, start with the luxury communities page and tell us which enclaves interest you. If you are selling, ask for a pricing analysis built from your community's closings, the same method you have just read, applied to your home. Call our team at (702) 637-1759, contact us online or visit us at 8945 W Russell Rd, Suite 170, Las Vegas, NV 89148, and ask for the closed-sale evidence for your street before you make a move.
Which Sources Inform This Las Vegas Luxury Market Report?
- MLS data pulled through Repliers on November 1, 2026: homes (land excluded) that closed in Las Vegas, Henderson, North Las Vegas and Boulder City from October 1, 2025 to September 30, 2026 and from October 1, 2024 to September 30, 2025, by closing date, plus active listings on November 1, 2026 excluding listings under contract. These are NREG tabulations, not official Las Vegas REALTORS statistics.
- Realtor.com September 2026 luxury housing report, October 14, 2026: national luxury entry point of $1,199,321, down 3.6%, the 30th straight month of annual declines, and listings at that level spending three fewer days on the market.
- FOX5 coverage of the Las Vegas REALTORS September 2026 report, October 6, 2026: $470,000 single-family median, $490,000 record, $290,000 condo median, 2,169 sales, five-month supply, 7,995 and 2,796 listings without offers, 75.9% sold within 60 days, 23.5% cash and 1.1% distressed sales.
- News 3 coverage of the Las Vegas REALTORS September 2026 report, October 6, 2026: $470,000 median, down 1.1% from $475,000 in August, and the same sales and inventory figures.
- National Association of REALTORS, September 2026 existing-home sales release, October 13, 2026: 4.8-month national supply, up from 4.5 months a year earlier.
- Freddie Mac Primary Mortgage Market Survey: 7.24% 30-year fixed average as of October 29, 2026, down from 7.32% the prior week, and 6.17% a year earlier.
- Federal Housing Finance Agency, 2026 conforming loan limit values: $832,750 baseline one-unit limit.
- Federal Housing Finance Agency, 2026 county loan limit list: Clark County one-unit limit of $832,750.
- Consumer Financial Protection Bureau, What is a jumbo loan?: definition of a jumbo mortgage and its potential cost premium.
- Nevada Revised Statutes Chapter 116: NRS 116.4109 resale package contents and the five-day cancellation right.
- Nevada Constitution, Article 10: no personal income tax and no inheritance tax.
- Nevada Real Estate Group days-on-market study: the companion deep dive on time and discounts, built on a window ending September 18, 2026.
This report is for informational purposes only and is not legal, financial or tax advice. Chris Nevada is a licensed Nevada REALTOR (S.181401) with Nevada Real Estate Group, brokered by LPT Realty. Consult a licensed professional before making real estate decisions.
Thinking of selling in Las Vegas? See how these numbers apply to your home