

Published April 29, 2026 · Last updated September 4, 2026 · By Chris Nevada
In April this post reported a metro-wide average home value of $431,015, down 2.5% year over year, and asked whether the Las Vegas-Henderson market was rolling over. Five months later the answer is in. According to Las Vegas REALTORS, the median existing single-family price in Southern Nevada hit an all-time high of $490,000 in May and June 2026, then eased to $480,000 in July, 1% below July 2025 and 2% below the record. The dip became a record, then a soft summer. Henderson itself is closing at a $489,890 median over the 90 days ending September 4, 2026, according to our analysis of Las Vegas REALTORS MLS data via Repliers.
Henderson home values did not slide in 2026. The valley set a $490,000 record in May and June, then eased to $480,000 in July, 1% below a year earlier, according to Las Vegas REALTORS. Henderson's 90-day median sold price is $489,890 at 34 days on market with 2,453 active listings. Buyers have room to negotiate; sellers who price to the closed comps still sell in about five weeks.
- Henderson closed 968 homes in the 90 days ending September 4, 2026 at a $489,890 median.
- Southern Nevada's median hit a $490,000 record in June, then settled to $480,000 in July per Las Vegas REALTORS.
- Freddie Mac's 30-year fixed averaged 6.71% on September 3, 2026, up from 6.50% a year earlier.
- Henderson's $1M+ tier is closing at a $1,600,000 median but taking 41 days to sell.
- Henderson new builds close at $507,995, about $18,000 above resale, with builder incentives doing the work.
What Should Readers Know First?
- Henderson's 90-day median sold price is $489,890 with 2,453 active listings and a 34-day median time on market, according to our analysis of Las Vegas REALTORS MLS data via Repliers.
- According to Las Vegas REALTORS, 2,508 existing homes sold across Southern Nevada in July 2026 versus 2,251 in July 2025, an 11% increase in volume even as the median price eased 1%.
- The valley is carrying roughly four months of supply per Las Vegas REALTORS, the most balanced footing since 2019.
- According to Freddie Mac, the 30-year fixed rate averaged 6.71% for the week of September 3, 2026, compared with 6.50% one year earlier.
- Henderson's premium ZIPs are holding: 89052 (Anthem, Seven Hills, MacDonald Ranch) is closing at a $640,000 median, and 89012 (Green Valley, MacDonald Highlands) at $566,000.
For neighborhood-level analysis, see Chris Nevada's Henderson market guide and our communities page. Current inventory sits on the Henderson homes for sale page, updated from the MLS.
For related insights, see our coverage of the Las Vegas housing market and the top 10 high-rises on the Las Vegas Strip.
What Changed Between the Spring Dip and September 2026?
The spring reading was a purchasing-power story, and it still is. What changed is that the market absorbed the rate environment instead of breaking under it. According to Las Vegas REALTORS, the median existing single-family price climbed from the spring trough to a record $490,000 in May and repeated it in June 2026, before slipping to $480,000 in July. That July figure is 1% below July 2025, which means the year-over-year comparison flipped from negative 2.5% in the spring reading to negative 1% by midsummer, on higher volume.
Condos and townhomes followed the same path at a lower altitude. Las Vegas REALTORS put the July 2026 condo and townhome median at $290,000, down from $292,000 in June. Across the wider Las Vegas condo pool tracked through Repliers, the 90-day median sold price is $215,000 across 345 closings at 37 days on market: the attached market is deeper and cheaper than the headline suggests once you leave the resort corridor.
Three things did not change. Mortgage rates are still the constraint: according to Freddie Mac, the 30-year fixed averaged 6.71% on September 3, 2026, up from 6.66% the prior week and 6.50% a year earlier. Inventory is still building: Las Vegas REALTORS report roughly four months of supply valley-wide. And the luxury tier is still insulated: Henderson homes above $1 million closed at a $1,600,000 median across 83 sales in the 90-day window, according to our analysis of Las Vegas REALTORS MLS data via Repliers.
| Measure | Spring 2026 (this post's April reading) | September 2026 |
|---|---|---|
| Southern Nevada single-family median | $431,015 average value, down 2.5% YoY | $480,000 (July), down 1% YoY, 2% below the $490,000 record |
| Henderson median sold (90 days) | $470,000 reported median | $489,890 across 968 closings |
| Henderson days on market | Not reported | 34 days median |
| Valley supply | 3.4 months | Roughly four months |
| 30-year fixed rate | Approximately 6.4% | 6.71% (Freddie Mac, September 3, 2026) |
| Monthly existing-home sales | Not reported | 2,508 in July 2026 vs 2,251 in July 2025 |
Is the Las Vegas Housing Market Actually Declining in 2026?
No, and the July numbers make that plain. A 1% year-over-year dip in median price alongside an 11% increase in closed sales is a market that is trading more, not less, at slightly softer prices. According to Las Vegas REALTORS, 2,508 existing homes closed in July 2026 against 2,251 in July 2025. Sellers who are meeting the market are finding buyers.
The softness is concentrated where the rate math bites hardest. According to our analysis of Las Vegas REALTORS MLS data via Repliers for the 90 days ending September 4, 2026:
- North Las Vegas (entry level): $415,000 median sold, 20 days on market, $232 per square foot. Fastest-moving city in the valley because the price point clears the widest pool of qualified buyers.
- Las Vegas city (broad middle): $437,111 median sold across 3,025 closings, 28 days on market, $252 per square foot.
- Henderson (move-up): $489,890 median sold across 968 closings, 34 days on market, $258 per square foot.
- Henderson $1M+ (luxury): $1,600,000 median sold across 83 closings, 41 days on market, $419 per square foot. Cash and low-leverage buyers dominate this tier and are less rate-sensitive.
The Las Vegas market is not experiencing a bubble burst. Per Federal Reserve housing research, a correction exceeding 10% requires a combination of job losses, an inventory surge to six or more months, and forced selling. None of those conditions are present in the Las Vegas metro. According to BLS, Nevada added roughly 34,500 jobs in 2025, and Las Vegas REALTORS put valley supply at roughly four months, which is balanced, not glutted.
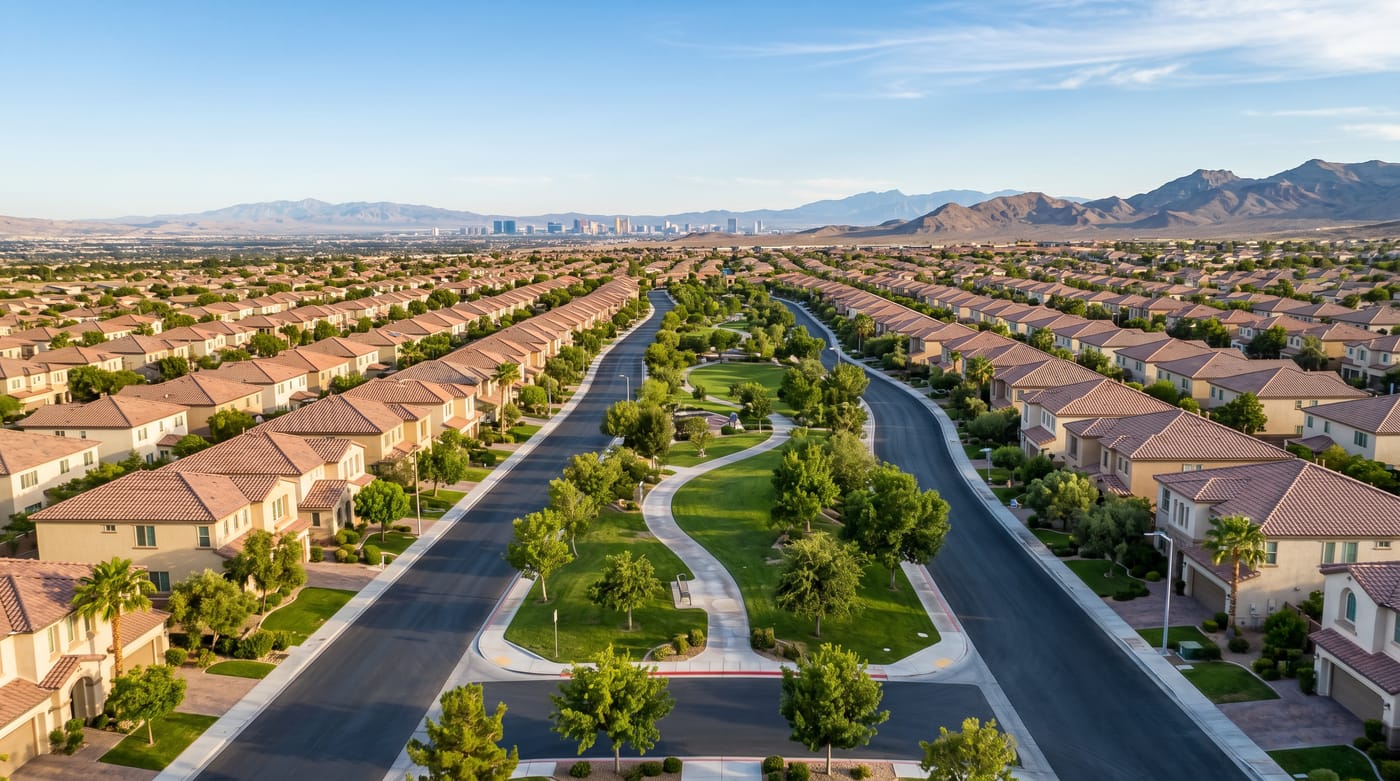
Which Henderson ZIPs Are Holding Value and Which Are Softer?
Henderson's $489,890 citywide median hides a wide spread. The city's 25-plus communities sort into four ZIP-level tiers, and the 90-day closed data tells you exactly where the money is going.
| Henderson submarket | Active listings | Median list price | 90-day closings | Median sold price | Median days on market | Sold $/sq ft |
|---|---|---|---|---|---|---|
| Henderson citywide | 2,453 | $536,059 | 968 | $489,890 | 34 | $258 |
| 89052 (Anthem, Seven Hills, MacDonald Ranch) | 380 | $675,000 | 135 | $640,000 | 34 | $288 |
| 89012 (Green Valley, MacDonald Highlands) | 286 | $670,000 | 104 | $566,000 | 35 | $293 |
| 89044 (Inspirada) | 266 | $549,950 | 164 | $522,500 | 36 | $259 |
| 89011 (Lake Las Vegas, Cadence side) | 688 | $530,735 | 203 | $464,990 | 35 | $246 |
| Henderson $1M+ | 388 | $2,336,583 | 83 | $1,600,000 | 41 | $419 |
| Henderson new build (2025+) | 295 | $590,925 | 138 | $507,995 | 39 | $245 |
The pattern is clear. The established southern ZIPs are the strength of the city. Anthem, Seven Hills, and MacDonald Ranch in 89052 are closing at $640,000, and the Green Valley and MacDonald Highlands mix in 89012 is closing at $566,000 with the highest per-square-foot price of any Henderson ZIP at $293. Inspirada in 89044 is the healthiest volume story, with 164 closings against only 266 active listings, the tightest active-to-closed ratio in the city.
The softer spot is 89011, where Lake Las Vegas resort inventory and the eastern edge of Cadence combine for 688 active listings, the largest pool in Henderson, against a $464,990 median sold. That ZIP has the widest gap between what sellers are asking ($530,735 median list) and what is closing, roughly $66,000, which is where I see the most negotiating room in the city right now.
Per City of Henderson economic data, the city's job base remains strong with Henderson Hospital expansion, Haas Automation operations, and I-11 corridor logistics growth supporting employment. This is not a demand problem. It is a purchasing-power problem driven by a 6.71% mortgage rate per Freddie Mac.
How Is Summerlin Performing Compared to Henderson?
Summerlin remains the valley's price leader, and the three core Summerlin ZIPs show why the luxury conversation in Las Vegas always ends up west of the 215. According to our analysis of Las Vegas REALTORS MLS data via Repliers for the 90 days ending September 4, 2026, Summerlin South (89135) closed at an $832,500 median and $365 per square foot, Summerlin West (89138) at $750,000 and $332 per square foot, and the original Summerlin core (89134) at $485,000 and $302 per square foot. Every Summerlin ZIP is closing at a higher price per square foot than any Henderson ZIP, including 89012.
Days on market tell the other half of the story. Summerlin South and West are taking 37 and 38 days to sell, three to four days longer than Henderson's 34. Buyers at $750,000 and above are taking their time everywhere in the valley this fall.
Three structural factors keep Summerlin at the top of the price stack:
Limited supply. Summerlin is approaching build-out under Howard Hughes Holdings. When a master plan cannot add meaningful new sections, existing home values carry a structural floor. Per Clark County permit data, the remaining new-home starts are concentrated in the western villages.
Cash buyer concentration. In my experience the share of cash and low-leverage buyers rises steeply above $800,000 in Summerlin, and those buyers are far less sensitive to a 6.71% rate than the $450,000 buyer in Henderson.
California relocation demand. Summerlin remains the default destination for Orange County and Bay Area families relocating to Nevada per U.S. Census Bureau migration data. These buyers are selling California homes at $1.2M to $2M and buying Summerlin at $750,000 to $900,000, a trade-down that makes Summerlin feel affordable regardless of the local rate environment.
For a full Summerlin breakdown, see our Summerlin market analysis and explore Summerlin neighborhoods.

What Does Four Months of Inventory Mean for Buyers?
This is the most important number in the current market. According to Las Vegas REALTORS, the valley is carrying roughly four months of supply as of the July 2026 report, up from the 3.4 months this post reported in the spring and the highest level since 2019.
What that means in practice:
- Below 3 months: Strong seller's market. Multiple offers common. Buyers waive contingencies.
- 3 to 4 months (where we are now): Transitional market. Sellers still have leverage on well-priced homes, but buyers have room to negotiate. Inspection and appraisal contingencies are back.
- 4 to 6 months: Balanced market. Neither side has significant leverage.
- Above 6 months: Buyer's market. Sellers compete for attention. Price cuts increase.
Per NAR research, the move from roughly two months of supply in 2024 to four months in 2026 restores real negotiating power to buyers. Concessions like seller-paid closing costs, rate buydowns, and home warranties are back on the table after being nearly extinct during the 2021 to 2023 seller's market.
The spread between asking and closing is the cleanest way to see it. Henderson sellers are listing at a $277 per-square-foot median while homes are closing at $258, a 7% gap, according to our analysis of Las Vegas REALTORS MLS data via Repliers. In Las Vegas city the gap is narrower ($260 list against $252 sold), and in North Las Vegas it has nearly closed ($233 against $232). Henderson is where the negotiating room lives this fall.
How Are Mortgage Rates Affecting Henderson Affordability?
Mortgage rates remain the primary driver of the price softness. According to Freddie Mac, the 30-year fixed averaged 6.71% for the week of September 3, 2026, up from 6.66% the prior week and 6.50% a year earlier. That is well below the 7.2% peak of late 2023 but still more than double the 3.1% pandemic-era low.
The purchasing power math on a Henderson purchase at the $489,890 median with 20% down:
| Rate environment | 30-year fixed rate | Monthly principal and interest | Max price at $2,500/month P&I, 20% down |
|---|---|---|---|
| 2021 pandemic low | 3.1% | $1,674 | $731,800 |
| 2022 mid-cycle | 5.0% | $2,104 | $582,100 |
| September 2025 (one year ago) | 6.50% | $2,477 | $494,400 |
| September 3, 2026 (Freddie Mac) | 6.71% | $2,532 | $483,800 |
| Late 2023 peak | 7.2% | $2,660 | $460,400 |
A buyer with a $2,500 monthly principal-and-interest budget could reach a $731,800 home in 2021. Today that same buyer maxes out at about $483,800, roughly the Henderson median. That $248,000 gap is why the entry-level and move-up bands are the soft spots. Demand did not disappear. Buyers simply cannot qualify at the price levels 2021 rates supported, per NAR affordability index data. Add property taxes at Clark County's typical effective rate near 0.5% per the Clark County Assessor, HOA dues, and insurance, and a realistic all-in payment on the Henderson median runs $3,100 to $3,400 per month.
What Should Henderson Sellers Do in a Balanced Market?
If you are selling in Henderson this fall, strategy matters more than it has in four years. Across the 9,600+ closings we've represented, the sellers who get hurt in a balanced market are almost always the ones who priced to the spring listing, not the summer closing.
Price to the closed comps, not the active listings. Henderson's median list price of $536,059 sits $46,000 above its median sold price of $489,890. Those are different pools of homes, but the spread is a warning: a lot of Henderson sellers are still asking spring prices. Homes priced to the last 90 days of closed sales are selling in about 34 days. Homes priced to the hopeful active listings sit, take a price cut, and carry the stale-listing stigma that costs more than the original discount would have.
Offer rate buydowns. A 2-1 buydown, where the seller pays to reduce the buyer's rate by 2 points in year one and 1 point in year two, costs about $9,000 on a $391,912 loan at 6.71%, and cuts the buyer's payment by roughly $497 per month in year one. That is often the difference between a buyer qualifying and not qualifying, and it usually costs the seller less than a price reduction that gets the same buyer to the table. Learn more on our sellers page.
Do not panic. A 2% pullback from an all-time high, on rising volume, is a healthy market catching its breath. Per Federal Reserve housing research, markets that ease 2% to 4% after rapid appreciation typically resume growth within 12 to 18 months once rates stabilize.
What Opportunities Exist for Henderson Buyers Right Now?
For buyers who have been waiting, September 2026 offers the most favorable conditions since 2019.
Negotiating leverage. With roughly four months of supply per Las Vegas REALTORS and a 7% gap between Henderson asking and closing prices per square foot, buyers can reasonably ask for seller concessions on most resale transactions, and in 89011 in particular. Visit our buyers page for the concession playbook.
Builder incentives. Henderson new builds (2025 and newer) are closing at a $507,995 median across 138 sales, only about $18,000 above the citywide resale median, according to our analysis of Las Vegas REALTORS MLS data via Repliers. That narrow premium is the builders' incentive budget at work. Lennar, KB Home, Tri Pointe, and Toll Brothers all have active rate-buydown and closing-cost programs in Inspirada, Cadence, and the southern Henderson foothills. See our new construction guide for how to stack them.
Entry-level value. Henderson's 89011 ($464,990 median) and North Las Vegas ($415,000 median, 20 days on market) offer genuine value at current pricing, especially if rates drift toward 6% and boost purchasing power by roughly $35,000 on a $2,500 payment budget. First-time buyers should start with our first-time buyer guide.
For specific opportunities, browse Henderson homes for sale or explore North Las Vegas homes for sale.
How Does Henderson Compare to the Rest of the Las Vegas Valley?
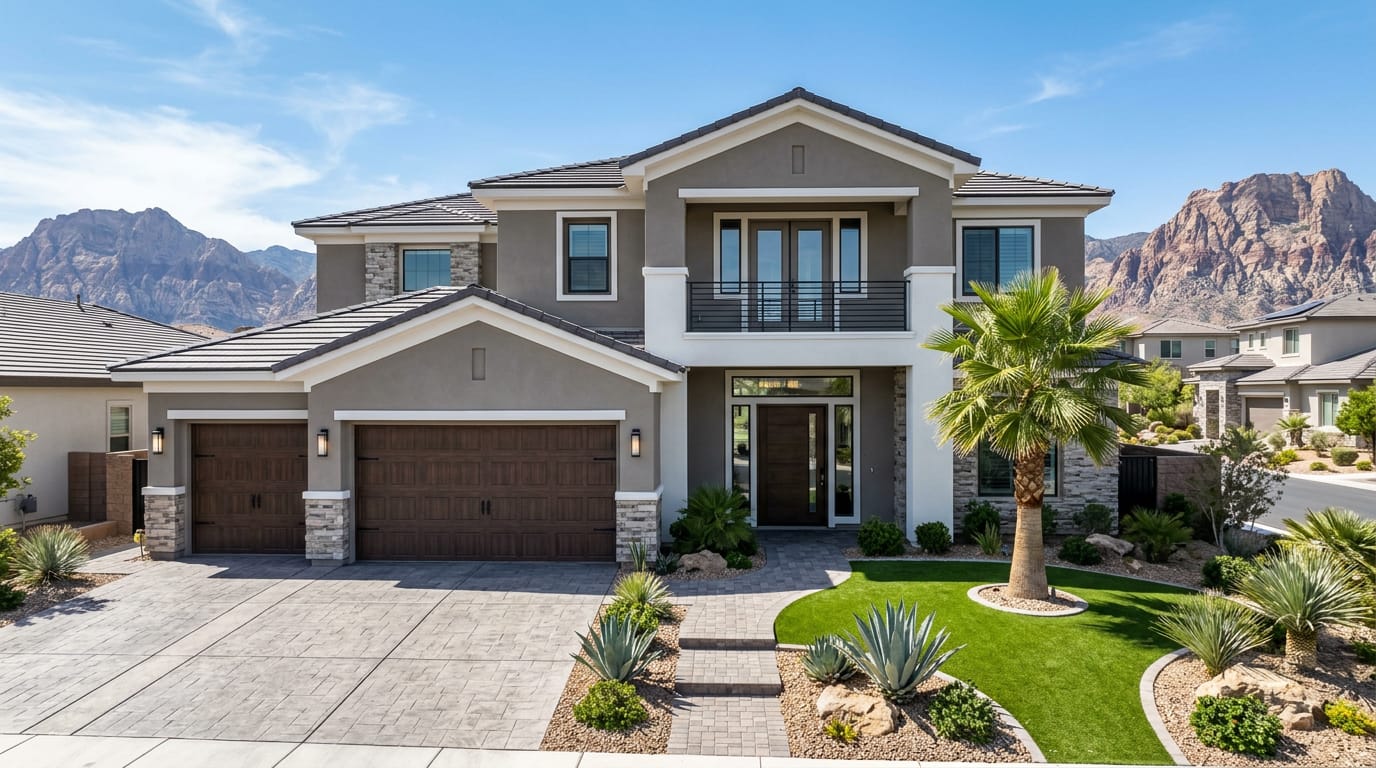
Henderson's position in the valley is easiest to see side by side. According to our analysis of Las Vegas REALTORS MLS data via Repliers for the 90 days ending September 4, 2026, Henderson closes at a 12% premium to Las Vegas city and an 18% premium to North Las Vegas, and takes longer to sell than either.
| Measure | Henderson | Las Vegas (city) | North Las Vegas | Summerlin West 89138 |
|---|---|---|---|---|
| Active listings | 2,453 | 8,605 | 1,021 | 354 |
| 90-day closings | 968 | 3,025 | 496 | 123 |
| Median sold price | $489,890 | $437,111 | $415,000 | $750,000 |
| Median list price | $536,059 | $465,284 | $429,900 | $799,950 |
| Median days on market | 34 | 28 | 20 | 38 |
| Sold $/sq ft | $258 | $252 | $232 | $332 |
| New-build median sold (2025+) | $507,995 | $569,150 | $482,905 | Included in Las Vegas |
Two things stand out. North Las Vegas is the tightest market in the valley: 20 days on market, with new builds closing at $482,905 in a median of 12 days. And Henderson's 34-day median reflects its price mix, not weakness; strip out the $1M+ tier that takes 41 days and core Henderson resale moves in line with Las Vegas city.
On the national comparison, the Las Vegas metro's 1% year-over-year dip per Las Vegas REALTORS is mild. Nevada's zero state income tax per the Nevada Department of Taxation, continued population growth per the U.S. Census Bureau, and economic diversification through data centers, sports infrastructure, and manufacturing per BLS provide structural demand that overbuilt Sun Belt metros lack.
Should Investors Buy, Hold, or Sell Henderson Property in 2026?
The answer depends on your investment timeline and property type.
Buy (if long-term hold): Entry-level homes in North Las Vegas and Henderson's 89011 corridor are the value plays at $415,000 and $464,990 medians respectively. If rates drift down 50 to 75 basis points over the next 12 to 18 months, the purchasing-power relief alone supports mid-single-digit appreciation on those price points.
Hold (if already own): Selling into a 1% to 2% price dip and paying 5% to 6% in transaction costs creates a net loss of 6% to 8%. Unless you need liquidity, holding through the flat patch, which per NAR historical patterns typically lasts 12 to 18 months, is the stronger play.
Sell (if overleveraged): If your cash-on-cash return has turned negative because of rate resets on adjustable loans or softening rents, liquidating one underperforming property to shore up your portfolio makes sense, and Henderson's 34-day median time on market means you can execute in a single quarter. Our sellers page walks through the net-sheet math.
For a personalized portfolio analysis, our team at Nevada Real Estate Group covers both sides of every transaction. We can model hold-versus-sell scenarios against the current closed comps for your specific property.
What Should Buyers and Sellers Understand About the Wider 2026 Las Vegas Picture?
Anchor every Henderson read against the wider metro context. According to Las Vegas REALTORS, 2,508 existing homes closed in July 2026 at a $480,000 single-family median with roughly four months of supply. That single-line summary obscures a real dispersion: North Las Vegas inventory under $450,000 is clearing in 20 days, while Henderson luxury inventory above $1 million is taking 41 days and closing well below its $2,336,583 median asking price. Buyers shopping at $415,000 are competing against pressure that buyers shopping at $1.6 million are not, and the carrying-cost calculus runs differently across the two bands.
Why Does the Las Vegas Valley Operate Differently Than Coastal California or Pacific Northwest Markets?
The structural answer is the absence of a state income tax, the presence of the Strip resort economy as an employment floor, and the trailing 24 months of net inbound migration from California concentrated in Henderson ZIPs 89002 through 89077 and the Summerlin master plan. According to the U.S. Census Bureau American Community Survey 5-year estimates, the Las Vegas-Henderson-Paradise MSA absorbed roughly 45,000 net California-origin residents over the trailing 24 months, with roughly 38% landing in the Summerlin master plan, 31% across Henderson submarkets, and the remaining 31% spread across Las Vegas Southwest, the North Valley growth corridor, Mountain's Edge, and Centennial Hills. That migration pressure has sustained demand in both entry-level bands ($300,000 to $500,000) and move-up bands ($500,000 to $900,000) at once, which is unusual.
Per Bureau of Labor Statistics regional reports, payroll growth through 2025 concentrated in healthcare ($65,000 to $95,000 wage band), logistics ($55,000 to $80,000), and the resort sector ($45,000 to $120,000). That wage stack qualifies buyers across the $400,000 to $900,000 band, which is exactly where the bulk of valley inventory sits.
How Does the September 2026 Mortgage Rate Environment Reshape the Decision?
According to the Freddie Mac Primary Mortgage Market Survey, the 30-year fixed conventional rate averaged 6.71% for the week of September 3, 2026, with FHA and VA products typically pricing 20 to 40 basis points below conventional and jumbo products roughly 20 basis points above. The FHFA baseline conforming loan limit sits just above $800,000, which means most buyers shopping between $500,000 and $1 million have access to conforming-rate financing. Buyers shopping above $1 million typically need jumbo financing or a structured combo product (80/10/10 or a piggyback HELOC) to keep the first mortgage under the conforming ceiling.
The carrying-cost math at 6.71% on a $500,000 mortgage is about $3,230 in principal and interest per month, before property taxes (roughly $250 to $350 per month at the typical 0.5% effective rate plus any SID or LID bonds), HOA (roughly $80 to $300 per month in most master plans, $400 to $800 per month in luxury guard-gated communities), and homeowner's insurance (roughly $150 to $250 per month for typical valley exposure). A buyer modeling $4,000 per month in total carrying cost is realistic at a $500,000 purchase price with 10% to 15% down.
What Should Sellers in the $400K to $900K Band Plan For in the Next 90 Days?
Across the 9,600+ closings we've represented, the listings that close nearest to asking share three controllable factors: pricing strategy at list (the first 14 days carry the highest visibility multiple), photography and marketing reach (professional MLS photography plus syndication across the national portals), and showing logistics (the seller who can offer 4-hour notice showings absorbs more buyer traffic than the seller requiring 24-hour notice). On a $489,890 Henderson median, each point of sale-to-list ratio is worth about $4,900, so the controllable factors are worth real money.
For sellers planning a 90-day window to close, the practical sequence is: professional photography and 3D tour capture in week 1, list in week 2 at 2% to 3% above the closest comparable closed sales rather than at the active-listing median, showings through weeks 2 to 4, offer evaluation through weeks 4 to 6, and a 30 to 45 day close from accepted offer. Listing decision to keys-in-hand typically runs 75 to 90 days.
What Should Buyers Pre-Approve and Pre-Plan Before Touring?
According to Mortgage Bankers Association application data, buyers who arrive at first showings with a fully underwritten pre-approval (not a pre-qualification letter, but an actual TBD-property underwriting decision from the lender) close materially faster than buyers operating with a basic pre-qualification. The difference matters most in multi-offer scenarios. A seller faced with three offers at similar price points will almost always select the one with the strongest financing certainty.
The pre-approval checklist before touring: two years of tax returns, two months of bank and investment statements, two years of W-2 or 1099 income documentation, a government-issued photo ID, and explanation letters for any large deposits in the trailing 12 months. Self-employed and equity-compensated buyers should plan for an additional 7 to 14 days of underwriting and choose a lender experienced with their income type.
How Do Builder Incentive Cycles Affect the 2026 Decision Math?
Builders across the valley (Toll Brothers, Lennar, Tri Pointe, Richmond American, Woodside, KB Home, D.R. Horton, Pulte) run quarterly incentive cycles worth $15,000 to $40,000 per home: rate buydowns, closing cost credits of $10,000 to $25,000, design center allowances of $10,000 to $30,000, and lot premium waivers of $20,000 to $80,000 on select inventory homes.
The decision matrix for resale versus new construction in 2026 turns on three factors: timeline (resale closes in 30 to 45 days, new construction in 4 to 9 months for inventory and 9 to 14 months for build-to-order), customization (zero on resale, full on build-to-order, limited on inventory), and effective price (Henderson new builds are closing at $507,995 against a $489,890 resale median, and stacked incentives often close most of that gap). Buyers prioritizing fast occupancy or expecting to hold the home 5 to 7 years tend toward resale; buyers prioritizing customization or planning a 10-plus year hold tend toward new construction with stacked incentives.
Where Do These Findings Fit Within the Wider NREG Coverage Map?
Our 789 closings and $440 million+ in 2025 production were distributed roughly where Las Vegas demand actually sits: about 38% of NREG volume concentrated in the Summerlin master plan and its Cliffs, Kestrel, and Stonebridge villages, 31% across Henderson ZIPs 89002 through 89077 (Anthem, Green Valley, Inspirada, Cadence, MacDonald Highlands, Seven Hills, Lake Las Vegas), and the remaining 31% spread across Las Vegas Southwest, the North Valley (Skye Canyon, Valley Vista, Tule Springs), Mountain's Edge, Centennial Hills, and the resort-corridor high-rise condo inventory.
According to the Clark County Assessor parcel database for 2026, tax rates across NREG's coverage area cluster in a narrow band, with most Henderson submarkets producing an effective rate near 0.5% of purchase price. According to the U.S. Census Bureau American Community Survey, the Las Vegas-Henderson-Paradise MSA has absorbed roughly 45,000 net California-origin residents over the trailing 24 months, which has sustained demand in both first-time buyer and luxury price bands simultaneously, including the guard-gated communities that anchor Henderson's $1M+ tier.
For readers using this article as a decision input, the practical next steps are: review the relevant community page, run a search of active listings in your target ZIP, then contact us or call Nevada Real Estate Group at (702) 637-1759 to map the framework against your timeline and budget. Nevada Real Estate Group is the #1 real estate team in Nevada and #44 in the nation, with 9,600+ closings, $4.85 billion+ in total sales volume, 150+ agents, and 9,061+ verified five-star reviews. Across the 9,600+ closings we've represented, the cleanest outcomes come from buyers and sellers who call early, before signing a builder reservation, before listing at a spring price in a September market, or before committing to a community whose carrying cost does not match their lifestyle. The 6.71% rate environment as of September 3, 2026 per Freddie Mac is stable enough to model carrying costs precisely for both Las Vegas new construction homes and resale.
Frequently Asked Questions
How much have Henderson home values changed in 2026?
Henderson is closing at a $489,890 median over the 90 days ending September 4, 2026, according to our analysis of Las Vegas REALTORS MLS data via Repliers, above the $480,000 Southern Nevada median that Las Vegas REALTORS reported for July 2026. The valley set a $490,000 record in May and June, then eased 2%.
Is Henderson losing home value in 2026?
No. Henderson's established ZIPs are holding: 89052 (Anthem, Seven Hills, MacDonald Ranch) is closing at $640,000 and 89012 (Green Valley, MacDonald Highlands) at $566,000. The softer spot is 89011 (Lake Las Vegas and east Cadence), where 688 active listings are competing for buyers at a $464,990 median and the gap between asking and closing prices is about $66,000.
Is now a good time to buy in Henderson?
For buyers priced out in 2023 and 2024, September 2026 offers the best conditions since 2019. Supply is roughly four months per Las Vegas REALTORS, Henderson sellers are asking 7% more per square foot than homes close for, and builders are closing new homes at $507,995 with incentives stacked on top. If rates drift from 6.71% toward 6%, purchasing power on a $2,500 payment budget rises by roughly $35,000.
Why is Summerlin priced higher than Henderson?
Summerlin South (89135) closed at an $832,500 median and $365 per square foot over the summer of 2026, versus Henderson's $489,890 and $258. Three factors drive the gap: limited remaining supply as the Howard Hughes Holdings master plan approaches build-out, a heavier share of cash buyers above $800,000, and sustained California relocation demand per U.S. Census Bureau data.
What are mortgage rates right now for a Henderson purchase?
According to Freddie Mac, the 30-year fixed averaged 6.71% for the week of September 3, 2026, up from 6.66% the prior week and 6.50% a year earlier. On the $489,890 Henderson median with 20% down, that is $2,532 per month in principal and interest, versus $1,674 at the 2021 low of 3.1%.
Should I sell my Henderson home now or wait?
Unless you are overleveraged or need liquidity, holding through a 1% to 2% price dip is typically the stronger play per NAR historical patterns, because selling into a dip plus 5% to 6% in transaction costs creates a 6% to 8% net loss. If you do need to sell, price to the last 90 days of closed comps rather than the active listings; Henderson homes priced that way are selling in about 34 days.
How does Henderson compare to Las Vegas and North Las Vegas in 2026?
Henderson closes at a 12% premium to Las Vegas city ($489,890 versus $437,111) and an 18% premium to North Las Vegas ($415,000), and takes longer to sell (34 days versus 28 and 20), according to our analysis of Las Vegas REALTORS MLS data via Repliers. North Las Vegas is the tightest market in the valley, with new builds closing in a median of 12 days.
Are Henderson new builds a better deal than resale in 2026?
Often, yes. Henderson new builds from 2025 and newer are closing at a $507,995 median across 138 sales, about $18,000 above the resale median, with $15,000 to $40,000 in builder incentives layered on top. The trade-off is timing: 4 to 9 months for inventory homes versus 30 to 45 days for a resale close.
Which Sources Inform This Henderson Home Values Guide?
Market data, closing volumes, and median price figures in this analysis come from Las Vegas REALTORS monthly MLS statistics through the July 2026 report, and from our analysis of Las Vegas REALTORS MLS data accessed via the Repliers API on September 4, 2026 (90-day window). Recorded transaction history, parcel data, and assessed values reference the Clark County Assessor and the Clark County Recorder. License and brokerage verification draws from the Nevada Real Estate Division public licensee database.
Macro housing context references the U.S. Census Bureau American Community Survey, the Bureau of Labor Statistics Las Vegas-Henderson-Paradise MSA employment data, the Federal Housing Finance Agency House Price Index, the Federal Reserve, and the Bureau of Economic Analysis state-level personal income data. The mortgage rate environment uses the Freddie Mac Primary Mortgage Market Survey for the week of September 3, 2026 and the Mortgage Bankers Association weekly applications survey. National market context references the National Association of REALTORS.
Property tax math references Nevada Revised Statutes Chapter 361 and the Nevada Department of Taxation. Local economic context references the City of Henderson. School ratings reference GreatSchools and the Clark County School District annual performance frameworks. Builder permit activity and certificate-of-occupancy data reference the Clark County Department of Building and the Nevada State Contractors Board. Summerlin build-out context references Howard Hughes Holdings.
This article is for informational purposes only and is not legal, financial, or tax advice. Market data is current as of September 4, 2026 and changes frequently; consult a licensed Nevada real estate professional before making decisions. Chris Nevada is a licensed Nevada REALTOR (S.181401) with Nevada Real Estate Group, brokered by LPT Realty, 8945 W Russell Rd, Suite 170, Las Vegas, NV 89148, (702) 637-1759.