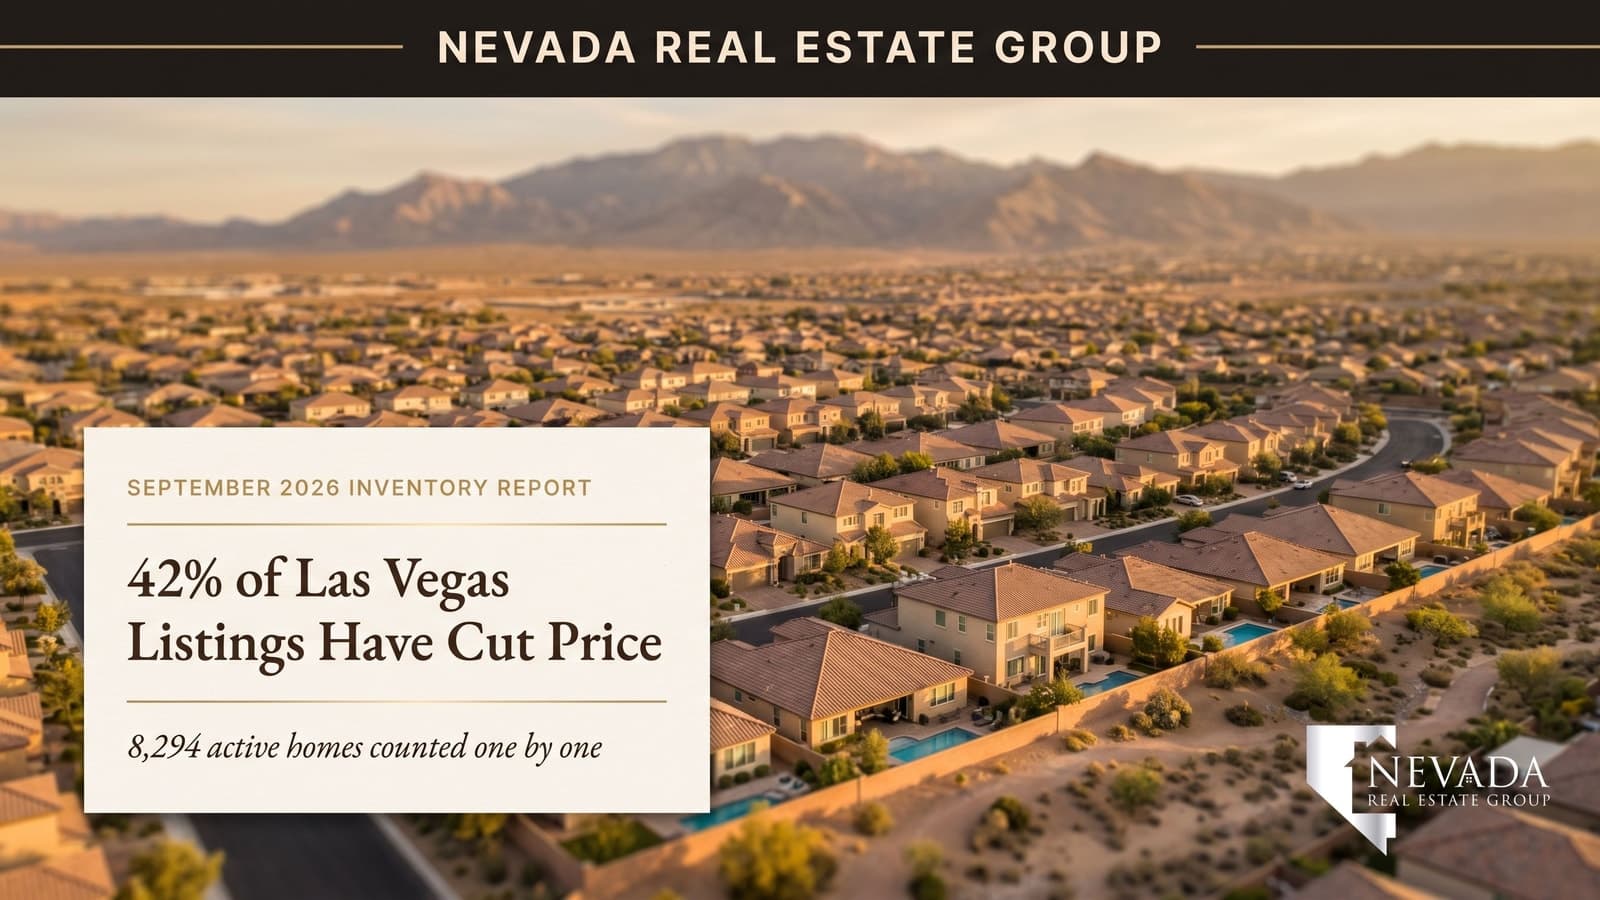

Most Las Vegas market commentary this month will quote a sample, an estimate or last quarter's association numbers with a fresh date on top. This report does something simpler and harder: on September 8, 2026 we pulled every active listing inside Las Vegas city limits from the GLVAR-fed MLS — all 8,294 of them — and counted. Price cuts, days on market, price bands, property types and ZIP codes below are the full board, not a slice of it.
It is an inventory report on purpose. August's closings are still being posted to the MLS (more on that below), so the honest thing to publish in the first week of September is the supply side, which is complete today. The closings edition follows once the August sales are in.
As of September 8, 2026, Las Vegas has 8,294 active listings, and 42.4% of them have cut their asking price at least once, by a median $20,000. The median list price is $469,900, the median listing has been on the market 24 days, and 1,817 homes — 21.9% of the board — are both 60-plus days old and already reduced. That aged, discounted pool is where September buyers should start.
- Las Vegas holds 8,294 active listings on September 8, up 1.5% from the 8,170 counted August 23.
- 42.4% of listings have cut price, median $20,000; 651 listings have cut $50,000 or more.
- Median list price $469,900 and 24 days on market; 41.5% of listings are two weeks old or newer.
- 1,817 homes are both 60-plus days old and reduced — the negotiation pool, 21.9% of the board.
- Sellers: 74% of listings past 60 days already cut, so price to your ZIP's $/sqft on day one.
What Are the Key Las Vegas Inventory Numbers for September 2026?
The board on September 8, 2026 holds 8,294 active listings with a Las Vegas address: 7,911 homes and 383 lots. That is 124 more than the 8,170 we counted on August 23 for the August market report, a 1.5% rise in 16 days — modest, but in the wrong direction for sellers who were hoping the late-summer lull would thin the competition. According to Las Vegas REALTORS, valley inventory sits at its highest level since 2020, and the September count confirms the trend has not turned.
| Measure | September 8, 2026 | August 23, 2026 | Change |
|---|---|---|---|
| Active listings | 8,294 | 8,170 | +124 (+1.5%) |
| Listings with at least one price cut | 3,515 (42.4%) | 43% | flat |
| Median price cut | $20,000 (3.9% of original ask) | $19,901 | +$99 |
| Median list price | $469,900 | n/a | — |
| Median list price per square foot | $260 | n/a | — |
| Median days on market (active) | 24 | n/a | — |
| Listings 60-plus days old | 2,447 (29.6%) | n/a | — |
| Aged 60-plus days and already cut | 1,817 (21.9%) | n/a | — |
Three numbers carry the story. The cut share is flat at just over 42% — sellers who were going to reduce have largely reduced, and new sellers are arriving priced closer to reality. The median asking price of $469,900 sits above the $430,000 median that homes actually sold for in July, which is the gap buyers are negotiating in. And the 1,817 listings that are both two months old and already discounted are the market inside the market: a fifth of the board where the seller has publicly conceded once and the calendar is still working against them.
Why Is This a Counted Inventory Report and Not a Closings Report?
Because the sales side of August is not finished being written yet, and we would rather publish a complete number than an early one. Closed sales reach the MLS when the listing agent changes the status after funding, and in a normal month a meaningful share of closings are posted in the first two to three weeks of the following month. On September 8, the MLS showed 462 August closings inside Las Vegas city limits against 1,353 for July on the same query — which is not a collapse in sales, it is a lag in reporting. Publishing an "August median sale price" from a third of the closings would be exactly the kind of headline this series exists to avoid.
Inventory has no such lag. An active listing is active today or it is not, and its original price, current price, list date and days on market are facts on the record the moment we pull them. So the September edition counts supply: 8,294 listings, each one's asking price compared with its original asking price, each one's age measured from its list date. Every percentage in this report has a denominator you can name.
The closings edition — August's sales, the sale-to-list ratio, what actually cleared by ZIP — follows around September 21, when the August tape is complete, the same cadence the August report followed for July's sales. If you are deciding on an offer before then, the August report's July closings remain the most recent complete sales data: 991 closings, a $430,000 median across all types, $480,000 for single-family homes, and a median sale at 98.8% of the final list price with 59% of homes closing below list.
How Many Las Vegas Listings Have Cut Price, and by How Much?
3,515 of the 8,294 active listings — 42.4% — carry a current asking price below their original asking price. The median reduction is $20,000, which is 3.9% of the original ask; the mean is higher because the top of the market cuts in bigger dollars. 651 listings, 7.8% of the entire board, have cut by $50,000 or more, and those are concentrated above $850,000 where a 5% reduction is a $50,000 number by arithmetic rather than by distress.
The cut share barely moved from the 43% we counted on August 23, and that stability is itself a reading. In a market where prices are falling fast, the cut share climbs month over month as more sellers chase the market down. In a market that is simply slow, the share plateaus: the listings that were overpriced in spring have already corrected, new listings arrive priced with the correction built in, and the share stops rising. Las Vegas in September looks like the second market. The median new listing this week (the 675 homes listed since September 1) came on at $458,500, about $11,400 under the board's overall median — new sellers are pricing under the existing inventory, not over it.
Where the cuts get large is age. Among the 1,157 listings that are 90-plus days old and have already reduced, the median cut is $28,000, or 6.2% of the original price — nearly double the board-wide median. A seller who has been on the market a full quarter and cut once is, in our experience across the 9,600+ closings we have represented, the seller most likely to accept a second reduction in the form of an offer rather than another price change. Buyers who filter for that combination are working the softest part of the board.
Which Price Bands Are Crowded and Which Are Thin?
Las Vegas inventory is bottom-heavy. 3,139 listings — 37.8% of the board — ask under $400,000, and another 1,526 sit between $400,000 and $500,000. Together the two entry bands hold 56% of everything for sale. That is the practical answer to the question first-time buyers ask most: yes, there is real choice at the entry level, and it is the most competitive part of the board for sellers precisely because there is so much of it.
| Price band | Active listings | Share of board | Cut price | Median days on market |
|---|---|---|---|---|
| Under $400,000 | 3,139 | 37.8% | 43.4% | 26 |
| $400,000 to $500,000 | 1,526 | 18.4% | 43.1% | 20 |
| $500,000 to $650,000 | 1,366 | 16.5% | 44.7% | 23 |
| $650,000 to $850,000 | 825 | 9.9% | 44.4% | 24 |
| $850,000 to $1.5 million | 837 | 10.1% | 41.7% | 28 |
| $1.5 million and up | 601 | 7.2% | 28.0% | 35 |
The band that moves fastest is $400,000 to $500,000: a 20-day median age, the shortest on the board, with the same 43% cut share as everything else. That is the sweet spot where the July median sale of $430,000 lives, where conforming financing is easy, and where the buyer pool is deepest. The $500,000 to $850,000 bands are the most-reduced part of the market, with cut shares of 44.7% and 44.4% — move-up sellers who priced off 2025 comparables and met 2026 buyers.
The top tier behaves differently. Only 28.0% of the 601 listings at $1.5 million and up have reduced, against 42% to 45% everywhere else, and they sit a median 35 days. Luxury sellers in Las Vegas are not chasing the market; they are waiting for it, which is a posture that works when the buyer is a relocating executive on a specific timeline and fails when the home is one of nine similar estates in the same guard-gated village. The full read on that tier is in our luxury market coverage — the September inventory count simply says the patience is widespread.
How Long Are Las Vegas Homes Sitting Right Now?
The median active listing has been on the market 24 days, but the median hides a split board. 41.5% of listings are 14 days old or newer — a fast-turning front end fed by roughly 675 new listings a week. At the other end, 29.6% of the board (2,447 listings) has been sitting 60-plus days and 19.5% (about 1,620 listings) has passed 90 days. Both tails are large because both are true at once: well-priced homes go under contract in two to three weeks, and overpriced homes stay until the price changes.
The aged tail is where the report earns its keep. Of the 2,447 listings past 60 days, 74.3% have already cut at least once, which means 1,817 homes — 21.9% of the entire board — are simultaneously stale and discounted. That combination is the negotiation pool, and it is the first filter we set for every buyer we represent in September: 60-plus days, prior reduction, then sort by price per square foot against the ZIP median. The remaining 630 aged listings that have not cut are the interesting minority: either the seller has a reason to wait, or the listing is about to become the next reduction.
By property type, single-family homes turn in a median 22 days and condos and townhomes in 28. By price, the $400,000 to $500,000 band is fastest at 20 days and the $1.5 million-plus band slowest at 35. By geography, the spread is wider still: ZIP 89108 in the northwest turns in 16 days while 89139 in the southwest sits 41, a difference the ZIP table below unpacks. Days on market in Las Vegas is not one number; it is a distribution, and the buyer who understands the distribution writes better offers than the buyer who reads the headline.
How Fast Is New Inventory Arriving?
Supply keeps coming. 675 homes were listed between September 1 and September 8, 1,261 in the 14 days ending September 8, and 2,441 in the 30 days ending September 8 — roughly 80 new listings every day. Against 8,294 actives, the 30-day inflow equals about 29% of the standing board, which is why inventory can rise 1.5% in two weeks even while homes are going under contract at a normal clip. Sellers who listed in spring are being joined by sellers who waited for the heat to break, and the market is absorbing them slowly rather than quickly.
The price signal from the newest listings is the most useful forward indicator in this report. The 675 homes listed since September 1 came on at a median $458,500, which is $11,400 under the board-wide median ask of $469,900. Sellers entering the market now are pricing below the sellers already on it — a rational response to a 42% cut share that everyone can see, and the mechanism by which the cut share eventually falls: not because old listings stop cutting, but because new listings stop needing to.
For buyers, the practical implication is patience with a plan. A new, correctly priced listing in the $400,000 to $500,000 band will be under contract in about 20 days, so a buyer who wants the best of the fresh inventory needs financing settled and a same-week showing habit. A buyer who prefers leverage over selection should ignore the front end entirely and work the 1,817-home aged-and-reduced pool, where the seller's calendar is the negotiation. Both approaches work in September 2026; what does not work is drifting between them.
How Do Single-Family Homes Compare With Condos and Townhomes?
Of the 7,911 homes on the board, 4,991 are single-family residences and 2,110 are condominiums or townhomes; the remaining 810 are manufactured homes, small multifamily and MLS-coded "other" product, much of which is high-rise inventory near the Strip. The two main categories price and move differently enough that a blended median misleads.
| Property type | Active listings | Median list price | Median $ per sq ft | Cut price | Median days on market |
|---|---|---|---|---|---|
| Single-family residence | 4,991 | $554,999 | $271 | 43.1% | 22 |
| Condominium or townhome | 2,110 | $259,000 | $230 | 44.6% | 28 |
| All active listings | 8,294 | $469,900 | $260 | 42.4% | 24 |
The median single-family listing is a 4-bedroom home of about 2,210 square feet asking $554,999, or $271 per square foot; 16.0% of all listings advertise a private in-ground pool, which is lower than newcomers expect and a reminder that the pool premium is real. Single-family homes also move a week faster than attached product — 22 days against 28 — because the buyer pool is broader and financing is simpler.
Condos and townhomes are the entry tier at a $259,000 median, and they carry the board's highest cut share at 44.6%. Part of that is HOA math: a $259,000 condo with a $350 monthly assessment competes on total payment with a $300,000 townhome carrying a $120 fee, and sellers who price on square footage alone learn that lesson through reductions. Part of it is the Strip-corridor high-rise stock, which lists at a $490 per-square-foot median in ZIP 89109 and turns slowly regardless of price. Buyers comparing attached product across the valley can start with the high-rise inventory if the Strip is the point, and with Summerlin or Henderson townhomes if the HOA package is.
How Do the ZIP Codes Inside Las Vegas Compare?
Forty ZIP codes inside Las Vegas city limits hold 60 or more active listings each, and together they account for 8,134 of the 8,294 homes on the board. The fifteen busiest are below, ranked by listing count, with each ZIP's median asking price, price-cut share, median days on market and median price per square foot — all from the same September 8 sweep.
| ZIP (area) | Active | Median list price | Cut price | Median DOM | Median $ per sq ft |
|---|---|---|---|---|---|
| 89138 (Summerlin West) | 345 | $799,000 | 47.2% | 26 | $349 |
| 89103 (west of the Strip) | 324 | $275,500 | 40.4% | 36 | $289 |
| 89166 (Skye Canyon) | 306 | $544,500 | 48.7% | 25 | $262 |
| 89113 (southwest) | 303 | $568,880 | 46.9% | 32 | $268 |
| 89109 (Strip corridor) | 295 | $355,000 | 39.0% | 29 | $490 |
| 89148 (southwest) | 294 | $516,500 | 51.0% | 29 | $255 |
| 89135 (Summerlin South) | 293 | $887,000 | 37.5% | 28 | $386 |
| 89117 (Peccole Ranch / Canyon Gate) | 291 | $525,000 | 39.5% | 20 | $268 |
| 89139 (south) | 291 | $479,000 | 44.3% | 41 | $243 |
| 89129 (northwest) | 288 | $475,000 | 46.5% | 27 | $246 |
| 89149 (Centennial Hills) | 280 | $625,000 | 49.3% | 28 | $253 |
| 89121 (east) | 256 | $379,900 | 41.0% | 25 | $212 |
| 89141 (Southern Highlands) | 255 | $619,900 | 36.5% | 19 | $262 |
| 89108 (northwest) | 246 | $365,000 | 36.2% | 16 | $242 |
| 89134 (Sun City Summerlin) | 240 | $499,000 | 47.1% | 27 | $311 |
Three patterns stand out. First, the newest master-plan ZIPs carry the highest cut shares: 89148 at 51.0%, 89149 at 49.3% and 89166 at 48.7% are the southwest and northwest growth corridors where resale sellers compete directly with builder inventory and builder incentives — a resale home in Skye Canyon or Centennial Hills is priced against a new build with a rate buydown, and the reductions show it. Second, the established west-side ZIPs move fastest: 89141 in Southern Highlands at 19 days and 89117 at 20 days combine below-average cut shares with quick turnover, which is what a supply-constrained submarket looks like inside a supply-heavy metro. Third, the Strip corridor is its own market: 89109 lists at $490 per square foot on a $355,000 median because the product is high-rise condominium, and it should never be compared with the suburban ZIPs around it.
According to the National Association of REALTORS, school-district quality remains the top stated factor in neighborhood choice for family buyers, and the ZIP table shows that premium priced in: 89138 and 89135 in Summerlin ask $349 and $386 per square foot against a $260 board-wide median, and 89138 still turns in 26 days at a 47% cut share — Summerlin sellers reduce like everyone else, but the buyers are there when they do.

What Does the Median Las Vegas Listing Cost Per Month at Today's Rates?
According to Freddie Mac, the average 30-year fixed rate was 6.71% for the week of September 4, 2026, up from 6.65% on August 20, with the 15-year at 6.04%. Run those rates against the $469,900 median asking price and the monthly picture looks like this, before homeowners association dues.
| Scenario | Loan amount | Rate | Principal and interest | Est. tax and insurance | Total before HOA |
|---|---|---|---|---|---|
| 20% down, 30-year fixed | $375,920 | 6.71% | $2,428 | $340 | $2,768 |
| 20% down, 30-year at the August 20 rate | $375,920 | 6.65% | $2,413 | $340 | $2,753 |
| 10% down, 30-year fixed (excl. mortgage insurance) | $422,910 | 6.71% | $2,732 | $340 | $3,072 |
| 20% down, 15-year fixed | $375,920 | 6.04% | $3,180 | $340 | $3,520 |
The tax line is one of Las Vegas's quiet advantages. According to the Clark County Assessor, Nevada's partial abatement caps the annual increase on an owner-occupied home's tax bill at 3%. According to the Nevada Department of Taxation, the effective rate on a primary residence in Clark County typically lands between 0.5% and 0.6% of value — about $215 a month on the median listing, which is why the table's tax-and-insurance estimate is $340 rather than the $600-plus a Texas or New Jersey buyer would assume. The insurance figure is an estimate of $125 a month for a standard single-family policy; a home in a wildland-adjacent ZIP or with a pool will quote higher.
The six-basis-point rate rise since August 20 costs about $15 a month on the median loan — real, but small next to the $20,000 median price cut, which at 6.71% removes roughly $129 from the monthly payment on a 20%-down purchase. In September 2026, the price negotiation is worth more than the rate watch, and a seller-paid buydown is worth more than either: a $13,000 seller credit applied to points buys roughly three-quarters of a point on this loan size, which is more monthly relief than the same $13,000 taken off the price. Our wait-or-buy rate analysis runs that math in full.
What Share of Las Vegas Inventory Fits a Conforming Loan?
Most of it. According to the Federal Housing Finance Agency, the 2026 baseline conforming loan limit for a one-unit home is $832,750, and 6,804 of the 8,294 active listings — 82.0% — ask that amount or less. A buyer with conventional financing can therefore shop four-fifths of the Las Vegas board without a jumbo loan, and with 20% down the conforming ceiling reaches a purchase price above $1 million. That is the structural reason Las Vegas inventory clears more easily than coastal inventory at the same rate: the financing is ordinary for the vast majority of homes.
The bottom of the board is deep as well. 1,765 listings — 21.3% of everything for sale — ask under $300,000, most of them condos, townhomes and older single-family homes in the east and central valley. That is a genuine entry market, and it is where the FHA and down-payment-assistance conversations happen; the first-time buyer guide walks through the programs. At the other end, 1,083 listings (13.1%) ask $1 million or more, and the $1.5 million-plus tier's 28% cut share says those sellers are the least willing to move.
The middle is where the conforming limit and the median meet. With the median ask at $469,900 and the busiest fast-moving band at $400,000 to $500,000, the typical Las Vegas purchase in September 2026 is a conforming, 20-day-to-contract transaction in a band with 1,526 competing listings. That is a market with choice for buyers and competition for sellers — not a crash, not a boom, and not the frozen market that the national headlines about rates would suggest. According to the U.S. Census Bureau, Clark County added roughly 42,500 residents in the most recent year measured, and those households have to live somewhere; deep, conforming-priced inventory is how the valley houses them.
What Should Las Vegas Buyers Do With This Inventory?
Start with the pool the numbers point to. 1,817 listings are both 60-plus days old and already reduced; 1,157 of them are 90-plus days old with a median cut of $28,000 already on the record. Filter the live Las Vegas homes for sale by days on market, keep the prior-reduction flag on, and sort by price per square foot against the ZIP medians in the table above. A listing that is 90 days old, already cut, and still 10% above its ZIP's per-square-foot median is a negotiation brief written by the seller.
Second, decide which market you are in. If you want the best fresh inventory — the correctly priced new listing in the $400,000 to $500,000 band — you are competing on speed: 20 days median to contract, so the pre-approval, the inspection contingency plan and the showing schedule need to exist before the listing does. If you want leverage, you are competing on patience in the aged pool, where the median seller has already conceded once. The mistake we see most often is a buyer who wants aged-pool pricing on front-end inventory; that buyer loses the fresh listing and then overpays for the stale one out of frustration.
Third, ask for the buydown before the discount. At 6.71%, a seller credit toward points does more for the monthly payment than the same dollars off the price, and in a market where 42% of sellers have already cut, a credit is an easier concession to win than a second reduction. Fourth, respect the ZIP: a home in 89141 or 89117 that has been on the market three weeks is not stale — those ZIPs turn in 19 and 20 days — while a three-week-old listing in 89139 is barely halfway to its 41-day median. According to the U.S. Bureau of Economic Analysis, most California metros carry a higher regional price level than Las Vegas, and buyers relocating from them tend to read every listing as a bargain; the ZIP table is the antidote.
What Should Las Vegas Sellers Do in September?
Price to the first fourteen days, because the data says the market decides in that window. 41.5% of active listings are two weeks old or newer, and a correctly priced home in the busiest band goes under contract in about 20 days; a home that is still active at day 60 joins a 2,447-listing tail where 74% have already cut and the median eventual reduction among the 90-day sellers is $28,000. The cut you make on day 75 is larger, later and less effective than the price you could have set on day one.
Use the ZIP's price per square foot as the anchor, not the neighbor's asking price. The neighbor's ask is 42% likely to be a number that has already been reduced once. Your ZIP's median dollars per square foot — $349 in 89138, $268 in 89117, $246 in 89129 — is where buyers are actually shopping, and the listings above it in ZIPs with 47% to 51% cut shares are the ones doing the cutting. If your home genuinely earns a premium (a private pool, which only 16% of listings have; a corner lot; a renovated kitchen), price the premium explicitly and be ready to defend it with the comparable sale, not the comparable listing.
Read the competition before you list. 675 new listings arrived in the first eight days of September at a median $458,500, under the board median; the sellers you are competing with this month have already accepted that pricing has changed. If you list in the $500,000 to $850,000 range, you are entering the most-reduced part of the board (44% to 45% cut share) and your photography, staging and first-weekend showing schedule matter more than they did in 2024. Our seller playbook covers the launch sequence, and the phone number below reaches the #1 real estate team in Nevada.
How Does September Compare With the August 23 Sweep?
The August report counted the full board on August 23, 2026 and found 8,170 active listings, 43% with a price cut and a $19,901 median reduction. Sixteen days later the board holds 8,294 listings (up 1.5%), 42.4% carry a cut and the median reduction is $20,000. Read together, the two sweeps describe a market that is adding supply slowly, has finished the bulk of its repricing, and is now waiting for demand to catch up — which is what the seasonal calendar suggests it will do modestly in September and October before the holiday slowdown.
On the sales side, the most recent complete month remains July: 991 closings inside city limits, a $430,000 median across all property types and $480,000 for single-family homes, $252 per square foot sold, a median sale at 98.8% of final list, and 59% of homes closing below list. Set the September asking medians against those July sale medians and the negotiating room is visible in the numbers themselves: $469,900 asked against $430,000 sold across all types, and $554,999 asked against $480,000 sold for single-family homes. Part of that gap is mix — the active board skews toward pricier homes because cheaper homes sell faster — and part of it is the discount buyers are winning.
The August closings will settle the question. If the sale-to-list ratio holds near 98.8% and the below-list share stays near 59%, September's 42% cut share is the market's normal friction. If either number worsens, the cut share will start climbing again in the October count. Either way, the September inventory numbers are the baseline against which the next two reports will be read, and the method — every listing counted, every denominator named — is the same each time.
What Does This Mean for Your Las Vegas Move?
If you are buying, September 2026 offers more choice than any month since 2020 and a fifth of the board already discounted and aging. That is a good market to be deliberate in: pick your lane (speed on fresh inventory, or leverage in the aged pool), set your financing up before you shop, and negotiate the buydown before the price. Our team can pull the aged-and-reduced pool for any ZIP in the table, and we do it for every buyer we represent. Call (702) 637-1759, or start with the live Las Vegas listings and send us the addresses you want the history on.
If you are selling, the numbers argue for pricing precision and a fast launch. The board is deep, the newest sellers are pricing under it, and the aged tail is where listings go to lose money slowly. Price to the ZIP's dollars per square foot, launch with the full marketing sequence in week one, and treat day fourteen as the checkpoint. We will show you the comparable sales — not the comparable asks — and tell you honestly where your home sits in its band.
If you are relocating, the Las Vegas relocation guide covers neighborhoods, schools, taxes and the first thirty days, and the Las Vegas real estate hub ranks the neighborhoods by buyer type. The inventory count in this report is the supply side of that decision; the August closings report, due around September 21, will be the demand side. Together they are the most complete picture of Las Vegas housing you will read this month, because we counted.
Frequently Asked Questions
How many homes are for sale in Las Vegas right now?
On September 8, 2026 there were 8,294 active listings inside Las Vegas city limits on the GLVAR-fed MLS — 7,911 homes and 383 lots. That is 124 more than the 8,170 counted on August 23, a 1.5% rise, and according to Las Vegas REALTORS the valley's inventory is at its highest level since 2020. The count refreshes daily on the live Las Vegas homes-for-sale page.
What percentage of Las Vegas listings have reduced their price?
42.4% — 3,515 of the 8,294 active listings — carry an asking price below their original asking price as of September 8, 2026. The median reduction is $20,000, or 3.9% of the original price, and 651 listings have cut by $50,000 or more. The share is essentially flat against the 43% counted on August 23.
Is Las Vegas a buyer's market in September 2026?
It is a negotiable market rather than a collapsing one. Supply is deep (8,294 listings, up 1.5% in two weeks), 42% of sellers have already cut, and 1,817 homes are both 60-plus days old and reduced. But correctly priced homes in the $400,000 to $500,000 band still go under contract in about 20 days, and July's sales closed at a median 98.8% of list. Buyers have leverage on aged inventory and competition on fresh inventory.
How long does it take to sell a house in Las Vegas in 2026?
The median active listing on September 8, 2026 had been on the market 24 days; single-family homes sit a median 22 days and condos or townhomes 28. The spread by ZIP is wide — 16 days in 89108 and 41 in 89139 — and 29.6% of the board has been active 60-plus days. July's closed sales, the most recent complete month, took a median 29 days to go under contract.
What is the median list price in Las Vegas in September 2026?
$469,900 across all 8,294 active listings on September 8, 2026, at a median $260 per square foot. Single-family homes ask a median $554,999 ($271 per square foot) and condos or townhomes $259,000 ($230 per square foot). For comparison, homes that closed in July sold at a $430,000 median across all types and $480,000 for single-family residences.
Which Las Vegas ZIP codes have the most homes for sale?
89138 in Summerlin West leads with 345 active listings, followed by 89103 (324), 89166 in Skye Canyon (306), 89113 (303) and 89109 on the Strip corridor (295). Forty ZIP codes hold 60 or more listings each. The highest price-cut shares are in the newer master-plan ZIPs — 89148 (51.0%), 89149 (49.3%) and 89166 (48.7%) — where resale sellers compete with builder inventory.
When will the August 2026 closings report be published?
Around September 21, 2026, once the August closings are fully posted to the MLS. On September 8 only 462 August closings had been recorded inside city limits against 1,353 for July on the same query, which reflects the normal reporting lag rather than a drop in sales. The closings edition will cover the August median sale price, sale-to-list ratio and results by ZIP.
How Was This Report Built?
We swept the complete GLVAR-fed MLS board through our Repliers data access on September 8, 2026, pulling every listing with an active status and a Las Vegas city address — 8,294 records — with each listing's original asking price, current asking price, list date, days on market, property type, square footage, bedroom count, pool field and ZIP code. Nothing in this report is sampled, modeled or estimated from a subset. The price-cut share is the count of listings whose current price is below their original price divided by all 8,294; the median cut is the median of those differences; days on market is the MLS field as of the sweep date; price per square foot is list price divided by reported square footage for the 7,910 listings that report one.
Two choices deserve a note. The city-limits filter uses the MLS city field, so listings in unincorporated Clark County with a Las Vegas mailing address (Summerlin South, Spring Valley, Enterprise and Paradise, for example) are included when the MLS codes them as Las Vegas, which is how Las Vegas REALTORS reports them as well. And the ZIP table uses a 60-listing floor so every median is drawn from enough homes to mean something; 40 ZIPs clear it, covering 8,134 of the 8,294 listings.
We deliberately did not publish August sale prices or months of supply. The closings tape was about a third complete on September 8, and a months-of-supply figure built on it would disagree with the association's seasonally adjusted number without a methods lecture attached. Both belong in the closings edition, where the denominators will be whole. The August 23 comparison figures come from the same full-board method run for the August report, so the two sweeps are directly comparable. The monthly payment table uses the Freddie Mac Primary Mortgage Market Survey rates for the week of September 4, 2026 and a standard amortization formula; the tax line assumes a 0.55% effective rate and the insurance line is a $125-a-month estimate that your own quote should replace.
Which Sources Inform This Las Vegas Inventory Report?
The inventory counts, price-cut shares, days on market, price bands, property-type splits and ZIP-code medians in this report come from a full-board sweep of the GLVAR-fed MLS through our Repliers data access on September 8, 2026, and the August 23 comparison figures come from the identical sweep run for our August report. Every figure attributed to an outside source below links to that source, and the figures we could not verify against a complete dataset — August sale prices and months of supply — were left out on purpose rather than approximated.
- Las Vegas REALTORS market statistics — association inventory and sales reporting, including the finding that valley inventory sits at its highest level since 2020.
- Freddie Mac Primary Mortgage Market Survey — 30-year fixed 6.71% and 15-year fixed 6.04% for the week of September 4, 2026, and 6.65% for August 20.
- Federal Housing Finance Agency conforming loan limits — the 2026 baseline one-unit limit of $832,750 used to size the conforming share of the board.
- Clark County Assessor — property assessment and the 3% annual abatement cap for owner-occupied homes.
- Nevada Department of Taxation — effective property tax rates on Nevada primary residences.
- U.S. Census Bureau QuickFacts for Clark County — population and the roughly 42,500-resident annual gain.
- National Association of REALTORS — buyer research on school quality as the leading neighborhood-selection factor.
- U.S. Bureau of Economic Analysis — regional price parities used to compare Las Vegas with the markets relocating buyers come from.
- Nevada Real Estate Group August 2026 market report — the July closings figures (991 sales, $430,000 median, 98.8% sale-to-list, 59% below list) and the August 23 board count.
Nevada Real Estate Group is brokered by LPT Realty, license S.181401, at 8945 W Russell Rd, Suite 170, Las Vegas, NV 89148. Market figures describe active MLS listings inside Las Vegas city limits on the dates stated and will change daily; verify any figure that drives a decision against the live listing record, and treat the payment table as an illustration rather than a loan quote.