

Published May 3, 2026 · Updated September 19, 2026
The best time to sell a house in Las Vegas is late February through May, when buyer traffic peaks, well-priced homes go under contract fastest, and sellers hold the most negotiating leverage of the year. But 2026 is not the frenzy market of 2021, and the honest answer is more nuanced than "list in May." Inventory has rebuilt, months-of-supply has loosened, and that means how and when you launch matters more now than it has in years — not less.
I lead a 150-agent team, and our team closed 789 homes across the Las Vegas Valley in 2025. For this update I pulled a full year of Las Vegas MLS data through Repliers on September 19, 2026 — 27,376 closings in Las Vegas, Henderson, North Las Vegas and Boulder City between September 19, 2025 and September 18, 2026 — and sorted it month by month. What follows is the seasonal playbook grounded in those real numbers, including the places where the full-year record is smaller, or larger, than the cliché.
List your Las Vegas home between mid-February and mid-May. In Las Vegas MLS data pulled through Repliers on September 19, 2026, homes that closed March through June went under contract in a median 26 days at 97.9% of original list price; January closings took 39 days at 97.2%, and November closings settled at 96.5%. That 13-day, 1.4-point spread is worth about $6,000 on a $445,000 home and far more on a luxury listing.
- Homes closing March through June 2026 went pending in a median 26 days; January closings took 39 days.
- Spring closings settled at 97.9% of original list versus 96.5% in November — about $6,200 on a $445,000 home.
- May 2026 closings posted the year's top median price at $455,000; October 2025 was the low at $437,000.
- Luxury swings hardest: $1.2 million-plus January closings took 53 days versus 33 to 35 in spring.
- At 6.95% mortgage rates and 5.4 months of supply, pricing to the comps beats waiting for a season.
Why Does Timing Matter So Much for Las Vegas Home Sellers?
In my experience, the single most expensive mistake sellers make is treating the market like it never changes. Across the thousands of transactions we've represented, the ones who time the launch well consistently net more and carry the home for fewer weeks. Seasonal demand shifts are real, they're measurable, and they translate directly into dollars and days. When you sort a full year of Las Vegas REALTORS MLS closings by month, the pattern is consistent: buyer activity rises sharply in late February, peaks between March and mid-June, softens through July and August, holds up reasonably in September and October, then fades into the holiday season.
That rhythm isn't random. It's driven by school calendars, corporate relocation cycles, snowbird activity, and the simple fact that most families with children want to be settled before the new school year. When buyer demand concentrates into a narrow window, sellers have pricing power. When it spreads thin, they don't — and in 2026 that shows up less as a dramatic price swing and more as a longer wait, a lower share of full-price offers, and buyers who ask for repairs and credits they would not have requested in April.
On a $445,000 home — the median valley sale over the 12 months ending September 18, 2026 — the measured spring-versus-winter gap in sale-to-original-list ratio is about 1.4 points, or roughly $6,200, plus the extra two weeks of carrying cost. That is not a car, but it is a year of HOA dues, a full staging budget, or the buyer's closing-cost credit you would otherwise be paying out of pocket. Multiply that by the higher price points common in Summerlin, Henderson, and the master plans of the northwest, and the stakes climb fast: in the $1.2 million-plus segment the January days-on-market figure was 53 against 33 to 35 in spring. Before you weigh staging or photography, the launch date is the first lever worth pulling, and a quick home value estimate is where I have most sellers start.
What Do the Live 2026 Las Vegas Market Numbers Actually Show?
Here is the strongest signal in this entire guide, and it comes straight from the MLS rather than a national headline. Across the 27,376 closings in the Las Vegas MLS data pulled through Repliers on September 19, 2026, the median home went from listing to accepted offer in 30 days and sold at 97.4% of its original list price. Half of all closings sold within their first 30 days; 16.5% took 90 days or longer. The homes that closed in the four spring months, March through June 2026, moved in a median of 26 days, and 55% of them sold inside a month. The homes that closed in January 2026 took 39 days, with only 43% selling inside a month.
Methodology: figures are Las Vegas MLS closed-sale and active-inventory records for Las Vegas, Henderson, North Las Vegas and Boulder City, pulled through Repliers on September 19, 2026; closings dated September 19, 2025 through September 18, 2026, actives as of September 18, 2026. Median values, single-family and attached residential combined, land excluded. These are not official Las Vegas REALTORS statistics. A closing date trails the contract date by 30 to 45 days, so "March closings" were mostly listed in January and February.
The rest of the snapshot fills in the picture. As of September 18, 2026 the four-city market carried 12,404 active listings against a 12-month closing pace of about 2,281 a month — roughly 5.4 months of supply. According to Las Vegas REALTORS, the association's own August 2026 report put Southern Nevada at just over 4.5 months of inventory, with 7,590 single-family homes listed without offers at month-end, up 5.3% from a year earlier, and the single-family median at $475,000, down 1.0% from August 2025 and about 3% below the $490,000 record set in May and June 2026. That is balanced-to-buyer territory, a world away from the sub-two-month frenzy of 2021. Yet the median sale still closed within 2.6% of its original ask. The lesson is not subtle: well-priced homes still move fast and near ask, while overpriced ones now sit and pile up in that overhang.
According to the U.S. Census Bureau, Clark County keeps absorbing tens of thousands of net new residents a year, which sustains a demand floor across all twelve months. That in-migration is why off-peak listings in Las Vegas aren't dead the way they are in seasonal Northern markets — but it does not erase the seasonal curve. It just raises the floor beneath it.
When Is the Best Time to List a House in Las Vegas in 2026?
Mid-February through mid-May is the optimal listing window, and in the desert it opens earlier and closes faster than the national "spring market." We don't have the weather suppression that holds Chicago or Denver back in March, so our buyers start moving in February. The closing record proves it: February 2026 closings — homes that were listed in December and January — already posted a 27-day median, and March through June closings ran 26. But once June flips to July, triple-digit heat and locked-in school enrollment start to slow the pace: July closings ran 28 days and August's ran 30.
The practical rule for Las Vegas sellers: your listing needs to be live by May 1 at the absolute latest, and mid-March is better. You want to be in front of buyers making decisions in April and May, so that you close in May or June — the two months that posted the year's highest median sale prices, $455,000 and $445,000. If your home hits the market on May 20, you've already missed the front edge of the wave. Families with children enrolled in Clark County School District schools are choosing homes in March, April and May; by June most have committed.

According to Freddie Mac, the 30-year fixed averaged 6.95% for the week of September 17, 2026, up from 6.76% the week before and from 6.26% a year earlier. Elevated rates thin the buyer pool year-round, which paradoxically makes peak season more important — the serious, pre-approved buyers who remain in a high-rate market cluster into spring, when relocation budgets are active and family timelines are urgent. A seller who lists in March is presenting to the largest concentration of those buyers the year will offer.
Which Months Produce the Fastest Sales and Highest Prices in Las Vegas?
Rather than blend national averages with local anecdotes, here is the actual month-by-month closing record for the valley. Read the days-on-market column as the seasonal speed signal and the sale-to-original-list column as the seasonal price signal; remember that each month's closings were mostly listed one to two months earlier.
| Month closed | Closings | Median sold price | Median days on market | Sold within 30 days | Sale ÷ original list |
|---|---|---|---|---|---|
| October 2025 | 2,190 | $437,000 | 32 | 49% | 96.8% |
| November 2025 | 1,871 | $447,000 | 35 | 46% | 96.5% |
| December 2025 | 2,269 | $442,000 | 36 | 44% | 96.7% |
| January 2026 | 3,646 | $440,000 | 39 | 43% | 97.2% |
| February 2026 | 2,720 | $441,000 | 27 | 53% | 97.7% |
| March 2026 | 2,693 | $449,900 | 26 | 55% | 97.9% |
| April 2026 | 2,679 | $447,000 | 26 | 55% | 97.9% |
| May 2026 | 2,512 | $455,000 | 27 | 55% | 97.8% |
| June 2026 | 2,406 | $445,000 | 26 | 54% | 97.5% |
| July 2026 | 2,145 | $440,000 | 28 | 52% | 97.3% |
| August 2026 | 1,295 | $440,000 | 30 | 50% | 97.0% |
Three things jump out. First, the speed curve is a clean U: 39 days for January closings, 26 to 27 for February through June, then a slow drift back up to 30 by August. Second, the price curve peaks in May at $455,000 and bottoms in October at $437,000, an $18,000 spread — though part of that is mix, because more move-up and luxury homes close in spring. Third, the sale-to-original-list ratio, which strips out the mix effect because it compares each home to its own ask, moves from 96.5% in November to 97.9% in March and April. That 1.4-point spread is the cleanest measure of seasonal pricing power the MLS offers. According to the National Association of REALTORS, May and June consistently carry the heaviest share of annual closings nationwide, and Las Vegas follows that curve with an earlier spring spike — our February closings already run faster than the national spring.
How Much Money Can Poor Timing Actually Cost You?
Let me put real numbers on this, because abstract percentages let people minimize the actual financial hit — and because, when I first published this guide in May, I cited the conventional 4-to-6% seasonal spread. The full-year record shows a smaller price spread and a bigger time spread than that folk wisdom, and you deserve the measured version.
Scenario: you own a home in Summerlin that the comps support at $840,000, the 12-month median for ZIP 89135. Close in April and the median seller in the valley settled at 97.9% of original list — about $822,400. Close in November and the median ratio was 96.5% — about $810,600. The measured seasonal gap is roughly $11,800, before the extra days: 89135 closings ran a 34-day median for the year, and the winter cohort valley-wide added about 13 days to that, which on an 80% loan at 6.95% is roughly $1,900 of additional principal and interest. Call the all-in cost of a winter close on that home about $13,700.
For luxury sellers in neighborhoods like MacDonald Highlands, The Ridges, or a Four Seasons Private Residences Henderson unit, the math gets more unforgiving because the time spread widens. In the $1.2 million-plus segment, January 2026 closings carried a 53-day median against 33 to 35 days for February through April, and the luxury sale-to-list schedule punishes time harshly: $1.2 million-plus homes that sold in their first 14 days settled at 97.8% of original list, while those that took 61 to 90 days settled at 91.7% — a median $185,000 give-back. An $1,800,000 home that drifts from a two-week spring sale into a two-month winter sale is not losing a rounding error; it is losing a six-figure sum.
This is exactly why I spend so much time counseling clients on launch timing before we ever discuss staging. On a median $445,000 home the measured seasonal spread is about $6,200 plus two weeks of carrying cost; on a $625,000 move-up home it's closer to $8,750; on a $1.5 million luxury property the price-ratio gap alone is $21,000 before the far larger days-on-market penalty kicks in. Run your own number through a home value estimator and multiply by 1.4% for the baseline seasonal swing in your price band — then add the luxury time penalty if you are above $1.2 million.
How Has the 2026 Balanced Market Changed the Seasonal Playbook?
In 2021, timing barely mattered — everything sold above ask within 48 hours. That market is gone. The 5.4-month supply figure as of September 18, 2026 tells you the valley is balanced, even buyer-leaning on the higher-priced overhang. Counterintuitively, that makes seasonal timing more decisive, not less.
Here's why. When inventory is scarce and demand is universal, a December listing still catches enough desperate buyers to sell fine. When inventory is ample — as it is now — buyers can afford to be patient, picky, and aggressive on price in the slow months. The penalty for listing into a soft season is heavier in a balanced market than it was in a frenzy, and the record shows where the penalty lands: the January cohort had only 43% of homes selling inside 30 days, and 16.5% of all closings for the year took 90 days or longer. According to the Federal Reserve, the higher-rate environment of 2026 compounds this by concentrating the remaining qualified buyers into the windows where relocation and family urgency are highest.
The balanced market also rewards precision pricing. The days of listing 10% over comps and waiting for a bid-up are over. In 2026, overpriced homes sit, accumulate days on market, and then require the reductions that signal trouble to buyers: valley-wide, homes that took 31 to 60 days to sell gave back a median $15,000 from their original ask, and homes that took 91 to 180 days gave back $34,900. My advice for this market: price at market, list in peak season, and use seller concessions — 2-3% toward closing costs or a rate buydown — instead of price cuts to keep your comp intact.
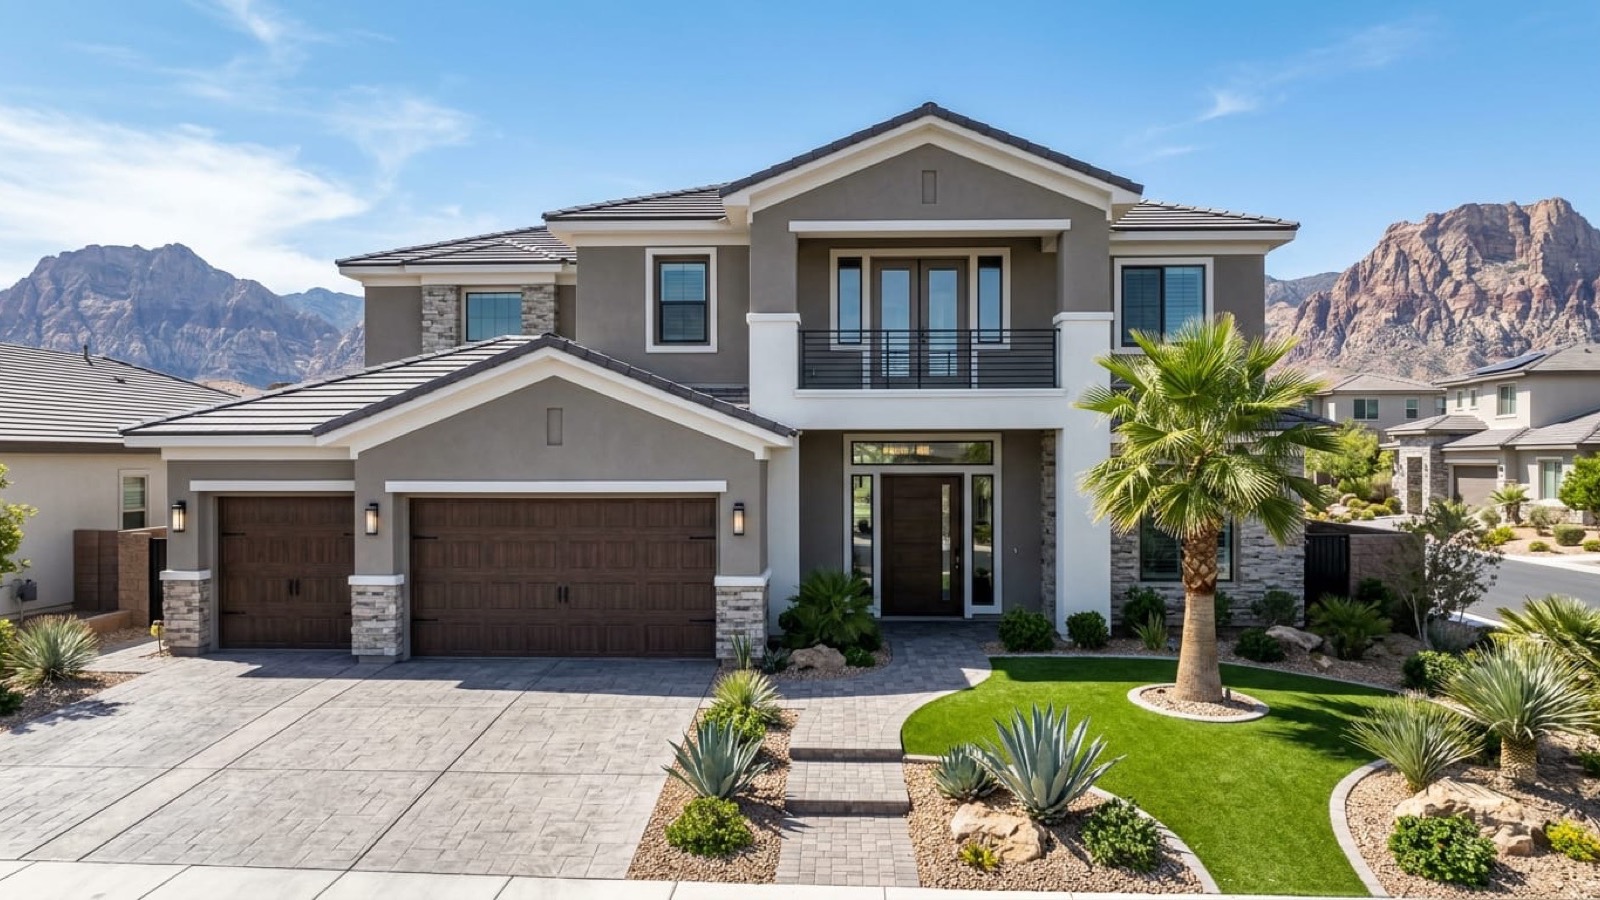
New construction is the other force reshaping the resale calendar. Builders in Henderson, Summerlin, and North Las Vegas launch their biggest incentive packages — flooring, rate buydowns, and closing credits — right as resale peak season opens, and the newest ZIPs show it: 89011 in Henderson, where 40% of the year's closings were built in 2025 or later, carried 6.8 months of supply and a 40-day median as of September 18, 2026. If you're selling a resale home in the same band, counter by pricing to the comps rather than above them, emphasizing mature landscaping and move-in readiness, and highlighting that resales close in 30-45 days versus a builder's longer build-and-close cycle. For the current builder landscape, I break it down in my guide to Las Vegas homebuilder sales.
How Do Peak and Off-Peak Seasons Compare Head-to-Head?
When sellers ask me to justify the spring push, I put the windows side by side across the dimensions that actually move money, using the measured 2025–26 closing record rather than round-number folklore. The comparison below reads down each column as a complete profile of that season; the closing months in each header were mostly listed one to two months earlier.
| Dimension | Peak spring (closed Mar–Jun 2026) | Fall (closed Oct–Nov 2025) | Winter (closed Dec 2025–Jan 2026) |
|---|---|---|---|
| Median days on market | 26 days | 32–35 days | 36–39 days |
| Sold within 30 days | 54–55% | 46–49% | 43–44% |
| Sale ÷ original list | 97.5–97.9% | 96.5–96.8% | 96.7–97.2% |
| Median sold price | $445,000–$455,000 | $437,000–$447,000 | $440,000–$442,000 |
| Luxury ($1.2M+) median DOM | 33–37 days | 41–42 days | 40–53 days |
| Best-fit seller | Family-zone homes, move-up and luxury | Non-school-zone homes, downsizers | Only if circumstances or a niche buyer pool call for it |
The takeaway is that every dimension favors spring, and the gap widens as price rises. Notice, though, that winter's sale-to-list ratio is not the disaster the folk wisdom claims: January closings settled at 97.2%, only 0.7 points behind April. What winter costs you is mostly time and odds — a 43% chance of selling inside a month instead of 55%, and 13 extra median days — and, in the luxury tier, a lot of both. A $310,000 condo seller might see a $4,300 seasonal price gap; a $1.5 million luxury seller can see $21,000 on ratio alone and an additional month or more on the calendar. If you have any flexibility on timing at all, that flexibility is worth real money, and the higher your price band the more it is worth.
How Do Mortgage Rates in 2026 Affect Seller Timing?
According to Freddie Mac, the 30-year fixed averaged 6.95% for the week of September 17, 2026, up from 6.76% the prior week and from 6.26% twelve months earlier. Affordability is compressed relative to the 2020-2021 era, and that changes seller strategy in a specific way: it makes peak demand season even more important. When rates are high, the buyer pool is naturally smaller — some buyers are priced out, others are waiting. The buyers still active are disproportionately serious, pre-approved, and motivated, and they concentrate in spring. Las Vegas REALTORS president George Kypreos made the same point in the association's September 8, 2026 release, noting that rising mortgage rates "can be a drag on the housing market" and tying August's slower sales pace to them.
The table below models how the rate environment interacts with the measured seasonal sale-to-list ratios across price bands. Payments assume a 20% down conventional loan at 6.95%; proceeds apply the spring (97.9%) and November (96.5%) median ratios to the original list price.
| Home type | Original list price | Buyer's monthly principal and interest at 6.95% | Spring proceeds (97.9%) | November proceeds (96.5%) | Seasonal gap |
|---|---|---|---|---|---|
| Condo / townhome | $310,000 | $1,642 | $303,490 | $299,150 | $4,340 |
| Median home | $450,000 | $2,383 | $440,550 | $434,250 | $6,300 |
| Newer resale | $520,000 | $2,754 | $509,080 | $501,800 | $7,280 |
| Move-up home | $625,000 | $3,310 | $611,875 | $603,125 | $8,750 |
| Luxury home | $1,500,000 | $7,943 | $1,468,500 | $1,447,500 | $21,000 |
The buyer's payment column is the part most sellers skip, and it explains the seasonal curve. At 6.95%, the buyer of a $450,000 home is committing to $2,383 a month in principal and interest before taxes, insurance and HOA dues, and every quarter-point move in rates changes that payment by roughly $60 to $75. Buyers who can absorb that payment are a finite group, and in a higher-rate year they are the same group who show up in spring with a relocation deadline and a pre-approval letter. The corollary for trade-up sellers: if you're buying a replacement home after your sale, you'll enter the same rate environment as your buyer. Talk to your lender about bridge financing, temporary rate buydowns, and whether a lease-back from your buyer gives you time to find your next home without carrying two mortgages. In this market I generally advise trade-up clients to sell first and negotiate a 30-60 day lease-back rather than face a weak contingent offer.
Which Las Vegas Neighborhoods Show the Strongest Seasonal Premiums?
Not every ZIP code responds to seasonal timing equally. Neighborhoods dominated by families with school-age children show the sharpest swing, because those buyers have hard enrollment deadlines. The 12-month figures below anchor each submarket's baseline; the seasonal curve in the month table above sits on top of these.
| Neighborhood | ZIP | 12-month closings | Median sold price | Median days on market | Sale ÷ original list | Months of supply |
|---|---|---|---|---|---|---|
| Summerlin (The Ridges, Red Rock CC) | 89135 | 664 | $840,000 | 34 | 95.3% | 5.6 |
| Summerlin West (newer villages) | 89138 | 720 | $769,750 | 39 | 96.0% | 6.0 |
| Henderson / Green Valley south | 89052 | 906 | $635,000 | 34 | 96.2% | 5.1 |
| Henderson / Anthem, Inspirada | 89044 | 741 | $533,000 | 34 | 97.1% | 4.5 |
| Northwest Las Vegas (Skye Canyon) | 89166 | 710 | $510,000 | 33 | 98.1% | 5.5 |
| North Las Vegas | 89031 | 887 | $419,150 | 21 | 98.9% | 3.4 |
Two patterns matter for timing. First, the higher-priced family corridors — 89135, 89138 and 89052 — carry the most supply and the lowest sale-to-list ratios, which means their sellers have the most to gain from launching into peak demand and the most to lose from a winter launch into 5 to 6 months of competing inventory. Second, value-tier North Las Vegas runs so fast — a 21-day median in 89031 with only 3.4 months of supply — that seasonality barely dents it; a well-priced starter home there sells in three weeks in almost any month. According to the Clark County Assessor, parcel data and assessed values for every one of these ZIPs are public, and buyers comparing carrying costs across them do the math. Summerlin and Henderson family corridors show the steepest spring swing because California-origin buyers want enrollment locked before August. Southwest master plans like Mountain's Edge and northwest picks like Centennial Hills sit in between, with a firm spring skew driven by their young-family buyer base.
How Does the Las Vegas Luxury Market Behave Differently by Season?
Luxury real estate operates on its own timeline in some respects, but the seasonal pattern still applies — with greater amplitude on the time axis. Properties above $1.2 million, particularly in guard-gated communities like The Summit Club, The Ridges, and Anthem Country Club, attract high-income relocating professionals and affluent second-home buyers. Both groups are influenced by school calendars and corporate schedules, and the closing record shows it.
| Month closed | $1.2M+ closings | Median days on market | Median sold price |
|---|---|---|---|
| October 2025 | 100 | 42 | $1,650,000 |
| November 2025 | 89 | 41 | $1,715,000 |
| December 2025 | 112 | 40 | $1,800,000 |
| January 2026 | 213 | 53 | $1,725,000 |
| February 2026 | 142 | 35 | $1,810,000 |
| March 2026 | 133 | 34 | $1,760,000 |
| April 2026 | 133 | 35 | $1,800,000 |
| May 2026 | 139 | 37 | $1,600,000 |
| June 2026 | 108 | 33 | $1,780,000 |
| July 2026 | 95 | 38 | $1,850,000 |
| August 2026 | 62 | 42 | $1,785,000 |
The luxury curve is the valley curve with the volume turned up: 33 to 35 days for homes closing in February, March, April and June, drifting to 41 or 42 in the fall and spiking to 53 for January closings. Over the full year, $1.2 million-to-$2 million homes carried a 37-day median and a 94.4% sale-to-original-list ratio, and $5 million-plus homes ran 64 days at 91.9%; as of September 18, 2026 the $2 million-to-$3 million asking band had 271 active listings with 27% of them sitting 90 days or longer. A luxury home listed in February, staged and priced to the comps, typically generates its showings in the first two weeks and closes near ask. The same home listed in November can sit into the new year, take a reduction, and still close below the original number — and the luxury discount schedule is steep, with 91-to-180-day sales settling at 89.7% of original list.

High-rise units tend to show less seasonal volatility than single-family luxury, because their buyer pool skews toward investors and second-home buyers without school-age children — though the Strip-corridor ZIP 89109 ran a 57-day median for the year with 11.2 months of supply, so "less seasonal" does not mean fast. I cover that market in detail in my rundown of the top 10 high-rises on the Vegas Strip — but even there, the spring peak still exists, just with a flatter curve.
How Should Sellers Prepare Their Home Before the Spring Window?
Knowing when to list is only half the equation; being ready is the other half. Sellers who decide in December to list in February — and start prep immediately — consistently outperform those who decide in March and rush to market in two weeks. Here's the timeline I recommend.
- 10-12 weeks out (December for a late-February launch): Order a pre-listing inspection. Catching issues before the buyer's inspector prevents last-minute renegotiations that can cost 1-3% of sale price. Get three contractor bids on anything flagged.
- 8-10 weeks out: Deep clean, declutter, and start staging. According to the National Association of REALTORS 2025 Profile of Home Staging, 49% of sellers' agents said staging reduced a home's time on market, 29% reported a 1% to 10% increase in the dollar value offered, and the median cost of a professional staging service was $1,500. On a $450,000 home, even a 1% benefit is $4,500 against that $1,500 cost.
- 4-6 weeks out: Professional photography, drone footage, and a virtual tour. In 2026, buyers filter online before they ever step inside; phone photos shot on a cloudy afternoon start you at a disadvantage.
- 2-3 weeks out: Final pricing consultation using the most current comps. Pricing is dynamic — what made sense six weeks ago may need adjustment based on what closed in the past 30 days.
- Launch week: Confirm showing instructions and make the home show-ready on day one. The first fourteen days on market are disproportionately important: valley-wide, 30.9% of homes sold within two weeks, and the median one settled at 100% of its original list price.
The single most common prep mistake I see is sequencing the repairs after the photos. If the pre-listing inspection flags a water heater or a roof patch, fix it, then shoot; a listing that launches with "repairs in progress" in the remarks invites the discount you were trying to avoid. First-time sellers who are also buying should read my first-time buyer primer to understand the other side of the transaction they're about to enter.
What Role Do CCSD School Zones Play in Sale-Price Timing?
School-zone premiums are one of the most underappreciated pricing factors in our market. Homes inside the attendance boundaries of high-performing Clark County School District schools — West Career and Technical Academy, Coronado High, and top-ranked elementary feeders — carry a measurable premium year-round. But that premium peaks sharply in spring.
Why? Because families who care about school quality make their purchase decisions in March, April, and May to lock enrollment before the August start. List a top-decile school-zone home in March and you're presenting it to the most motivated buyer segment in the market at the exact moment their urgency peaks. In our experience, homes in these zones sell measurably faster in the spring window than the valley-wide average, and the ZIP table above shows the baseline: 89052 in Henderson's Coronado feeder and 89135 in Summerlin's Palo Verde feeder both carry premium prices and 34-day medians despite 5-plus months of supply, which tells you the family buyer pool is absorbing that inventory.
The flip side is that school-zone homes are the ones most exposed to a late launch. A family that has not found a home by mid-June generally either rents for a year or expands its search to a different attendance zone, and either way your buyer pool shrinks until the next cycle. If your home sits in a top-decile feeder and you are choosing between a May 20 launch and a September launch, the September launch is the better of the two, because it catches the smaller fall cohort of relocating families rather than the tail end of the spring one. And if your home is in a zone that does not carry a school premium — a 55-plus community, a high-rise, a golf-course enclave — the calendar constraint loosens and the off-season case in the section below applies with more force.
Should You Sell Before or After Summer in Las Vegas?
Sell before summer. After summer means July through September, which carries three real liabilities. First, heat perception: 110-plus-degree afternoons deter showings and make walkthroughs uncomfortable, and the buyer who tours at 4 p.m. in July judges your air conditioning before your kitchen. Second, the school-calendar miss: families have already locked August enrollment, and out-of-state relocations drop sharply after mid-June once moving windows close. Third, the absorption climb: the closing record shows the median days on market stretching from 26 for the spring cohort to 28 in July and 30 in August as the summer listings work through a deeper pool of competing inventory.
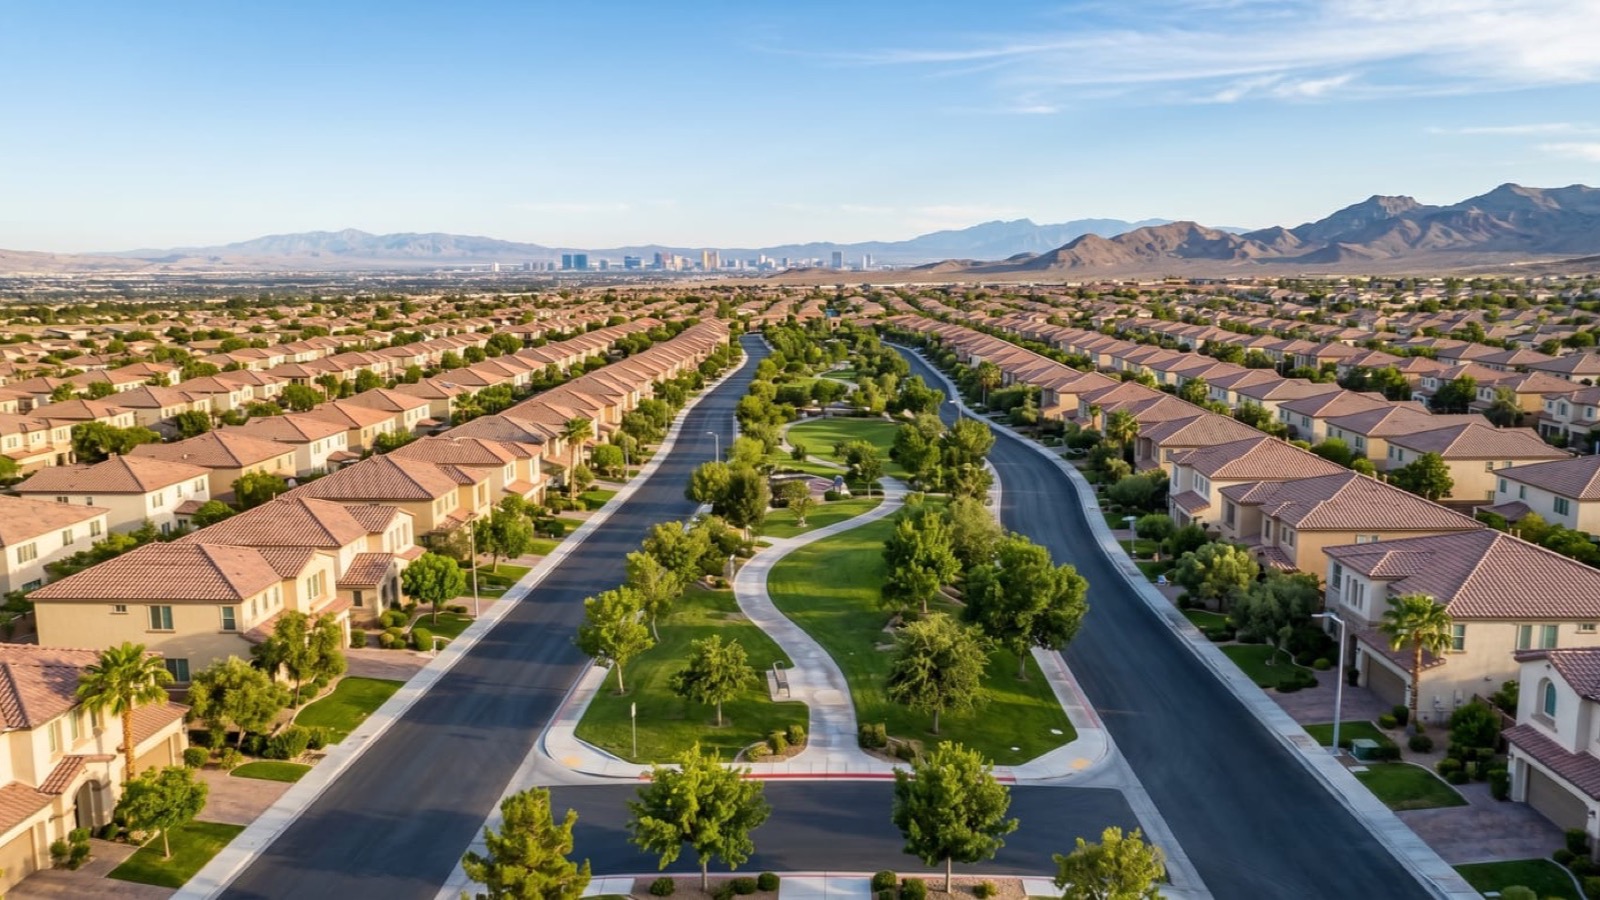
A July sale doesn't necessarily fail — July 2026 closings still settled at 97.3% of original list, and 52% sold inside a month — but it carries meaningfully lower buyer demand than April. If you truly miss the spring peak, target a September launch rather than listing into July heat or the holidays. September and October listings close in October and November, and that fall cohort ran 32 to 35 days at 96.5% to 96.8% of original list: slower and slightly softer than spring, but clearly ahead of the January closing cohort's 39 days. Fall inventory also thins as summer listings expire or withdraw, so a well-presented home gets more attention per showing than it would have in June. For sellers who need a fast, certain exit regardless of season, our Las Vegas sell-my-house options and homes-for-sale market data are the starting point.
Are There Situations When Selling in the Off-Season Makes Sense?
Absolutely, and I'd be doing you a disservice to pretend spring is right for every seller. Life events don't wait for March: divorce, job relocation, estate settlement, and financial hardship all demand action in whatever season they arrive. In those cases, pricing aggressively and marketing hard in any month beats delay — a well-priced December listing still has a 44% chance of selling inside 30 days, and the January cohort's 97.2% sale-to-list ratio shows that winter buyers pay close to ask for the right home.
There are also legitimate strategic reasons to list off-peak. Niche properties with non-family buyer pools — a golf-course estate whose likely buyer is a retiring executive without school-age kids, a 55-plus community home whose buyer is a snowbird touring in January — can perform better in the off-season than spring-biased analysis suggests. In some years and ZIP codes, spring brings so many competing listings that a well-presented home gets lost, while a thin winter inventory environment generates more per-showing attention; the holiday-season buyer is scarce but serious. And tax or estate-planning deadlines sometimes require a December 31 close even at a modest price concession — a real consideration you should run past your CPA. I make the full case for the contrarian calendar in why you should consider selling in the winter; the short version is that winter trades a smaller buyer pool for less competition, and for the right property that trade is a win.
The broader point: peak-season statistics are medians across 27,376 closings, and your property type, price point, and micro-location all matter, which is why a conversation with a local agent beats a national algorithm. If you're also shopping the other side of the trade, the buyer resources hub walks through what your buyer is weighing at the same time.
How Does Nevada's Tax Environment Affect the Timing Decision for Sellers?
One of the reasons I'm glad to operate here is the tax environment, and it's genuinely relevant to timing. According to the Nevada Department of Taxation, Nevada has no state income tax and no state-level capital-gains tax. That means the seasonal equity you capture by launching well — the $6,000 on a median home, the $21,000 on a $1.5 million one — stays in your pocket rather than being partly captured by a state government. In California, that same gain could face state income tax up to 13.3%. The math for Nevada sellers is more favorable than almost anywhere else in the country.
Federal capital-gains rules still apply. If your home has appreciated and you've lived in it at least two of the last five years, you can exclude up to $250,000 in gain ($500,000 for married couples filing jointly) under the Section 121 exclusion. For many Las Vegas homeowners who bought before 2020, that exclusion eliminates federal liability entirely; for those who bought at the 2021–2022 peak, the gain is smaller than they hoped and the exclusion is rarely tested. The timing wrinkle is the calendar year: a sale that closes December 30 is reported on this year's return, and one that closes January 3 lands on next year's, which matters if you expect a different income bracket, a retirement, or a move between states in the new year.
There is also the real-property transfer tax, which in Clark County is charged at closing and is customarily paid by the seller; it is the same in every month, but it is one more line item that a stronger spring sale price covers more comfortably than a discounted winter one. If you're weighing whether to stay invested in the state after selling, I lay out the long-term fundamentals in my analysis of Nevada growth and real estate.
How Long Does Escrow Take in Clark County?
Standard escrow in Clark County runs 30-45 days under normal spring and summer conditions. The timeline breaks down as roughly a 10-day inspection period, 7-10 days for appraisal and title review, 7-10 days of lender underwriting, 3-5 days for final walkthrough and closing prep, and a few days to record and disburse. Spring closings can compress to 25-30 days when buyers waive contingencies; winter closings often stretch to 45-60 days on holiday processing delays and slower underwriting.
Two Nevada-specific items can add or save a week. Under NRS 113.130, the Seller's Real Property Disclosure form must be served on the buyer at least 10 days before the property is conveyed, and a buyer who never receives it can rescind before closing without penalty — so complete it before launch, not during escrow. And if your home is in an HOA, the resale package under NRS 116.4109 gives the buyer until midnight of the fifth calendar day after receipt to cancel; order it the day you accept an offer so that five-day window falls early in escrow rather than in the final week.
For sellers with a hard deadline, add 45 days to your target offer-acceptance date and work backward. An April 15 accepted offer should close by roughly May 30, with funds clearing in the first days of June. FHA financing adds 5-7 days for its extra appraisal layer, so build that buffer if your likely buyer is using an FHA loan — common in the under-$450,000 bands where North Las Vegas and east-side homes trade. Cash buyers, who are more common in the luxury and 55-plus segments, can close in two weeks because the appraisal and underwriting steps disappear.
Ready to Time Your Las Vegas Sale With Nevada Real Estate Group?
Every table in this guide describes the valley as a whole; your home has one ZIP code, one price band, one property type and one launch month, and the combination is what actually sets your outcome. That is the conversation I have with sellers before we ever talk about staging or photography. We pull the same MLS data you have just read — filtered to your subdivision, your square-footage range and the most recent 90 days of closings — and we show you what the market paid, and how fast, for homes like yours in each month of the past year. Sellers who see that record almost never choose to wait for a season that does not fit their price band.
Nevada Real Estate Group is the #1 real estate team in Nevada, with 9,600+ closings, $4.85 billion+ in total sales volume, 150+ agents and 9,061+ verified five-star reviews; in 2025 alone we closed 789 transactions and $440 million+ in volume. That volume across every month of the year is why our timing advice is calibrated to what buyers are actually paying this season, not to a national rule of thumb. Our listing process is built around the two-week window that the data says matters most: pre-listing inspection, staging and photography before launch, a completed disclosure package on day one, and a written plan for a price or concession adjustment at day 14 if the offers have not arrived.
When you're ready to map your own timeline, contact our team, start a no-obligation seller consultation, or call (702) 637-1759. If you're still deciding who should run this process for you, the best real estate agent in Las Vegas guide covers how to vet the person who will — and the market report for your city shows the current month's numbers before we talk.
Frequently Asked Questions
What is the single best month to sell a house in Las Vegas in 2026?
Based on the Las Vegas MLS data pulled through Repliers on September 19, 2026, March and April are the strongest closing months — 26-day medians, 55% of homes selling inside 30 days, and a 97.9% sale-to-original-list ratio — which means the strongest listing months are February and March. May closings posted the year's highest median price at $455,000. If your home can be market-ready by mid-February, listing in late February to capture March and April buyer traffic is the optimal window for most properties.
How much can poor timing actually cost me on a median Las Vegas home?
On a $445,000 home — the 12-month valley median — the measured seasonal spread in sale-to-original-list ratio is about 1.4 points, or roughly $6,200, between spring closings at 97.9% and November closings at 96.5%. Just as important in 2026's balanced market, the January closing cohort ran 39 days against 26 for spring, so off-season sellers also carry the home about two weeks longer and negotiate from weaker footing. In the $1.2 million-plus tier the time gap widens to 53 days versus 33 to 35.
Does the best time to sell vary by neighborhood in Las Vegas?
Yes, meaningfully. Family-dominated neighborhoods — Summerlin's 89135 and 89138, Henderson's Green Valley and Anthem corridors, the northwest master plans — show the sharpest seasonal swing because their buyers have hard school-enrollment deadlines and those ZIPs carry 5 to 6 months of supply. Value-tier North Las Vegas, at a 21-day median in 89031 with 3.4 months of supply, sells briskly in almost any month. Neighborhoods with more retirees, investors, or second-home buyers show less volatility, though spring still outperforms winter in virtually every valley submarket.
Should I wait until fall if I missed the spring 2026 window?
If you miss the February-to-May listing window and your timeline allows, a September launch beats listing into July heat or the holidays. Homes that closed in October and November 2025 ran 32 to 35 days at 96.5% to 96.8% of original list — slower and slightly softer than spring, but clearly ahead of the January cohort's 39 days. Fall inventory thins as summer listings expire, so a well-presented home gets more attention per showing than it would in June.
How much does professional staging actually add to a Las Vegas sale price?
According to the National Association of REALTORS 2025 Profile of Home Staging, 29% of agents reported that staging increased the dollar value offered by 1% to 10%, 49% of sellers' agents said it reduced time on market, and 83% of buyers' agents said it helped buyers visualize the home. The median cost of a professional staging service was $1,500. On a $450,000 Las Vegas home, even a 1% benefit is $4,500 against that $1,500 investment, and in a market where 30.9% of homes sell at full ask inside two weeks, presentation is what gets you into that group.
Is it better to sell first or buy first when trading up in Las Vegas?
In the current market I recommend selling first in most cases. With the 30-year fixed at 6.95% for the week of September 17, 2026, you don't want to carry two mortgages or make a weak contingent offer. Most of my trade-up clients negotiate a 30-60 day lease-back with their buyer, which gives them time to shop for their next home while already in contract on the sale — eliminating double-carry risk and preserving purchasing leverage.
How does Clark County's population growth affect year-round demand?
Clark County adds tens of thousands of net new residents annually per U.S. Census Bureau estimates, which sustains a baseline of buyer demand every month. That in-migration means even off-peak listings aren't completely dead — December 2025 closings still had 44% of homes selling inside 30 days. But population growth lifts all boats; it doesn't erase seasonal patterns. The gap between peak and off-peak stays real even as the off-peak floor rises.
Which Sources Inform This Las Vegas Home-Selling Guide?
Closing volumes, days on market, sale-to-list ratios and median price figures are Las Vegas MLS data pulled through Repliers on September 19, 2026, covering closings from September 19, 2025 through September 18, 2026 and active listings as of September 18, 2026; they are not official Las Vegas REALTORS statistics. Association-level context comes from the Las Vegas REALTORS August 2026 housing report released September 8, 2026. Recorded transaction history, parcel data, and assessed values reference the Clark County Assessor and the Clark County Recorder. License and brokerage verification draws from the Nevada Real Estate Division public licensee database.
Macro housing context references the U.S. Census Bureau American Community Survey, the Bureau of Labor Statistics Las Vegas-Henderson-Paradise MSA employment data, the Federal Housing Finance Agency House Price Index, and the Bureau of Economic Analysis state personal-income data. Mortgage-rate context uses the Freddie Mac Primary Mortgage Market Survey for the week of September 17, 2026 and Federal Reserve rate data. Disclosure and HOA timing reference Nevada Revised Statutes Chapter 113 and Chapter 116; tax math references Nevada Revised Statutes Chapter 361, the Nevada Department of Taxation and the IRS Section 121 exclusion. Staging research references the National Association of REALTORS 2025 Profile of Home Staging. School ratings reference GreatSchools and the Clark County School District, and national timing patterns reference the National Association of REALTORS.
Editorial and advice disclosure: This article reflects Nevada Real Estate Group experience and market data as of September 19, 2026 and is for general information only. It is not legal, tax, or financial advice. Verify specifics with a licensed Nevada real estate professional, attorney, or CPA.
About Chris Nevada
Chris Nevada leads a team of 150+ real estate agents across Las Vegas, Henderson, Summerlin, and North Las Vegas. A 16-year U.S. Navy veteran, Chris brings data-driven discipline to residential and luxury transactions and market analysis. Chris holds Nevada real estate license #S.181401, verified at red.nv.gov.
Contact: Nevada Real Estate Group · 8945 W Russell Rd, Suite 170, Las Vegas, NV 89148 · Phone: (702) 637-1759 · Email: info@nevadagroup.com · Learn more about our team