
Boulder City is the smallest market in this series, and that shapes how to read it. 22 homes closed in September 2026 at a $467,000 median, a count small enough that two or three sales can move the number. The steadier signal is the list itself: 115 residential listings on November 11, 2026, 60.9% of them on the market 60 days or more.
Boulder City's median closed price was $467,000 in September 2026, per the Las Vegas REALTORS MLS (GLVAR) via Repliers, 22 closings. 115 homes were listed on November 11, 60.9% of them for 60 days or more. With so few sales a month, judge any Boulder City price against the last several closings on similar homes, not one month's median.
- Only 22 homes closed in September, so treat any one month's Boulder City median as a rough read.
- The median price cut is $24,900, or 5.1%, and 12 listings cut $50,000 or more.
- Compared with September 2025, the median fell $4,400 (0.9%) to $467,000 and closings went from 13 to 22.
- 40.9% of homes that closed in September had cut price at least once first.
- 26 listings arrived in the 30 days before November 11, against 22 September closings.
What Do the November 2026 Numbers Say About Boulder City?
| Measure | Figure |
|---|---|
| Sale-to-list | 94.8% |
| Listed 60 days or more | 60.9% |
| Condos and townhomes | $170,000 |
| Closed below list | 95.5% |
| Closed above list | 4.5% |
| Listings with a cut | 35.7% |
| Closed per square foot | $256 |
| September median closed | $467,000 |
| Median ask | $500,000 |
| Houses | $530,000 |
| Active listings | 115 |
| Median days, listing to contract | 31.5 |
Boulder City is one ZIP, 89005, so this edition has no ZIP table. With one ZIP there is no neighborhood table to lean on, so the useful comparison is across property types: 70 houses at a $647,450 median ask and 32 condos and townhomes at $354,950. The rest of the 115 listings are other residential styles. The median closing took 31.5 days, but with so few sales that is a loose guide, and one home's story can differ widely from it.
All of these figures come from the Las Vegas REALTORS MLS (GLVAR) via Repliers. Because a month is so small here, the longer record on the Boulder City market page is the better guide, and it shows how far the median can swing between one month and the next. That page groups sales by the MLS sold date, which on this feed is the contract date, so its monthly figures will not match this report's closing-date counts.
How Does September Compare With a Year Earlier in Boulder City?
| Measure | September 2025 | September 2026 |
|---|---|---|
| Median closed | $471,400 | $467,000 |
| Closings | 13 | 22 |
| Sale-to-list | 95.0% | 94.8% |
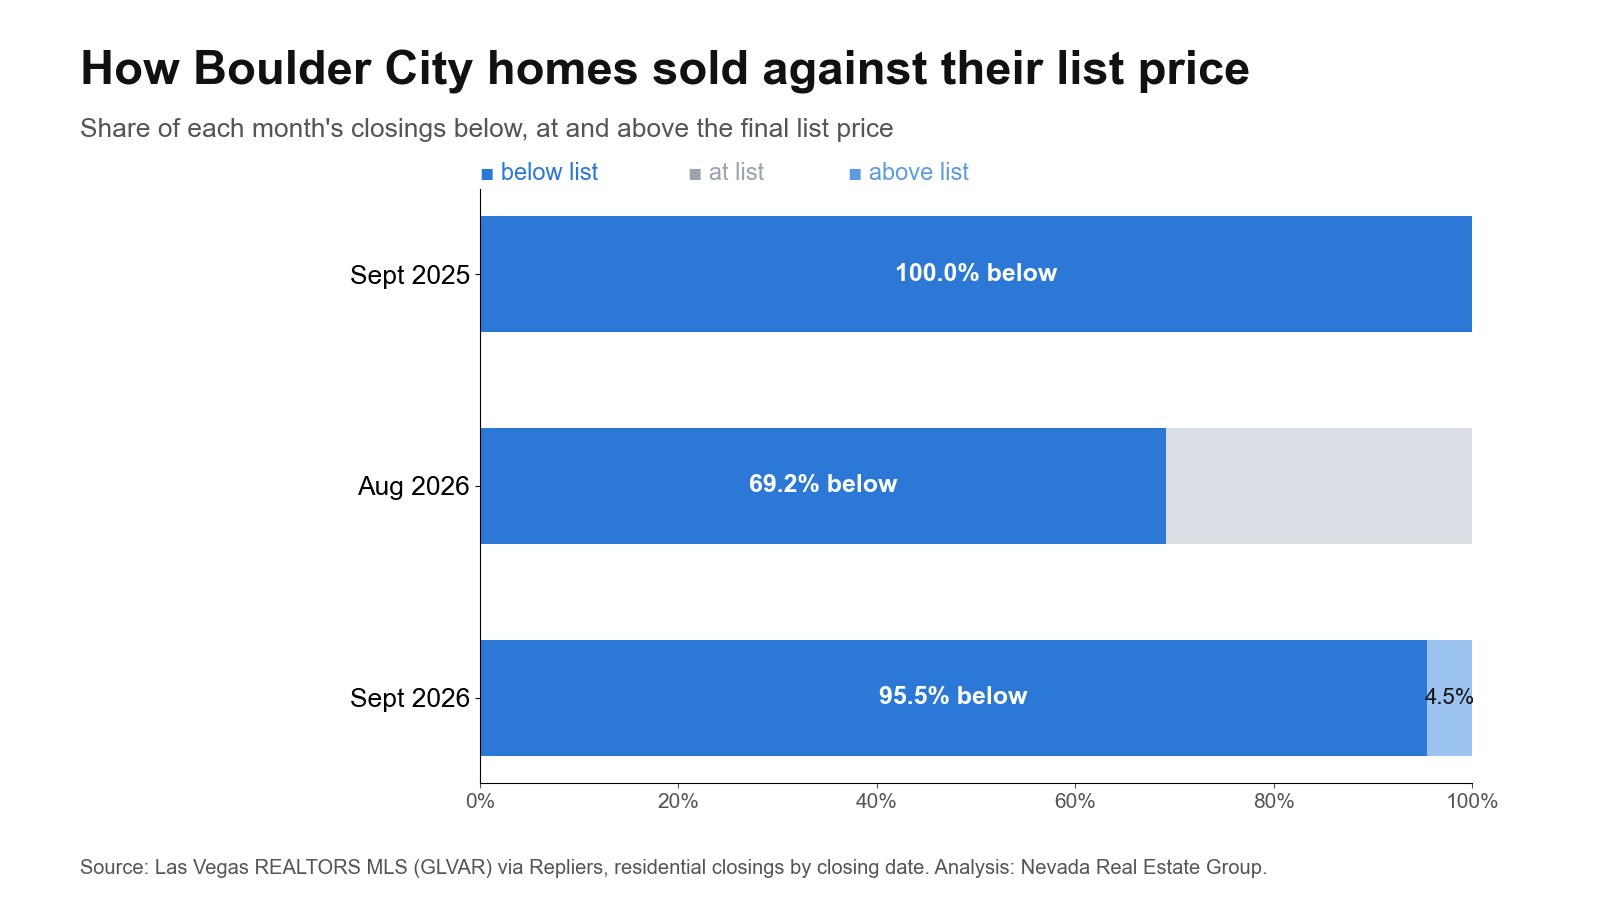
| Closed below list | 100.0% | 95.5% |
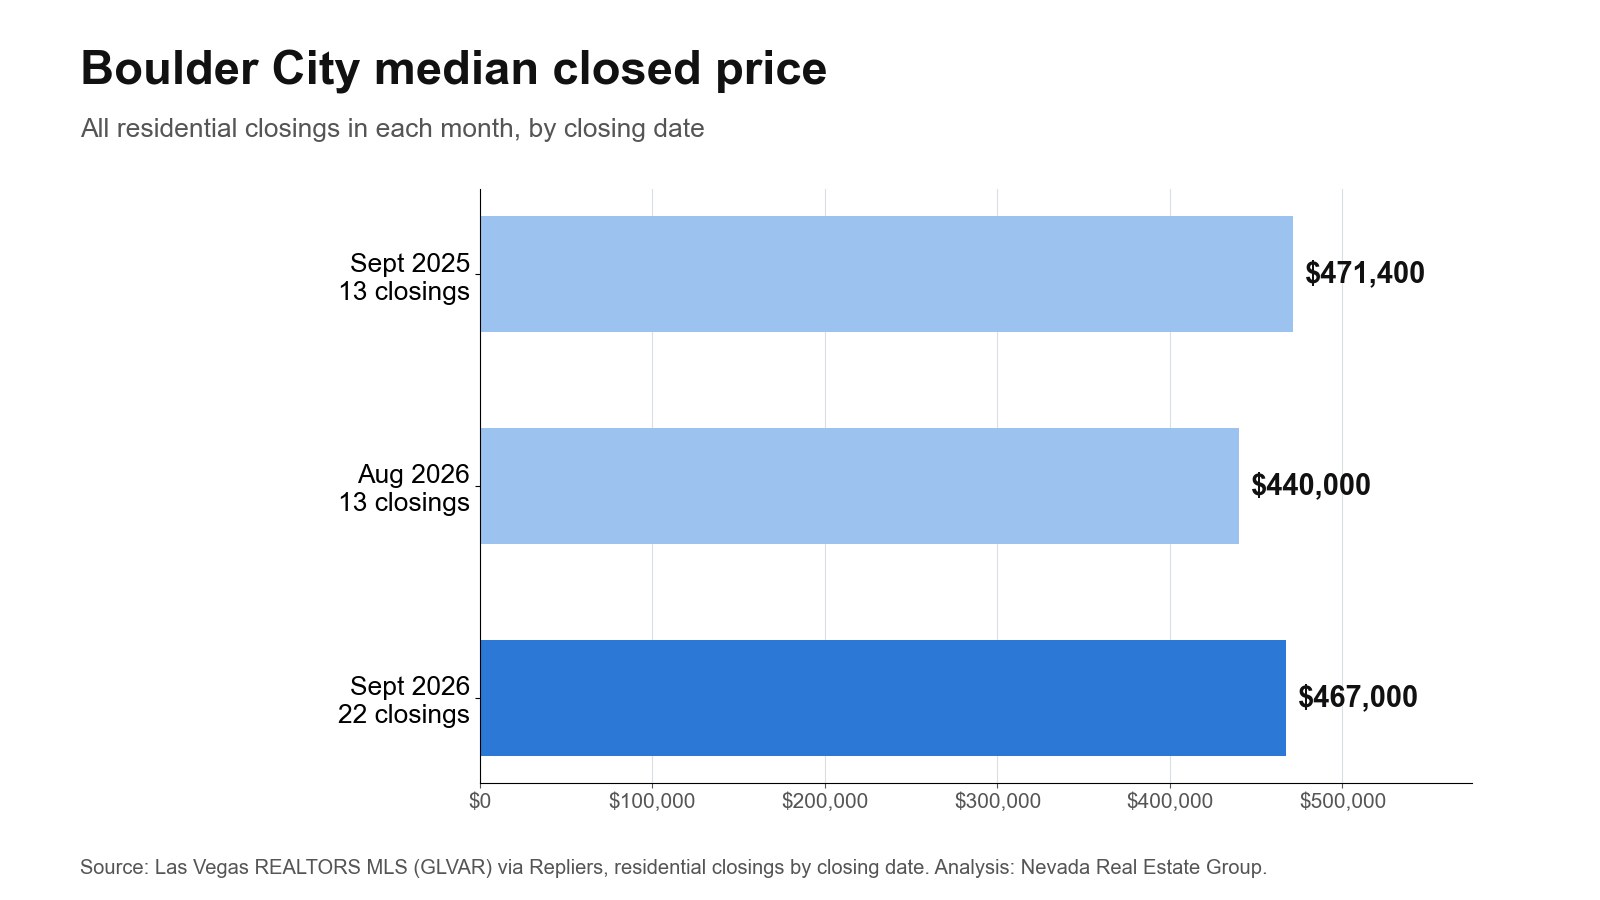
Against September 2025, the median fell $4,400 (0.9%) to $467,000, and the closing count went from 13 to 22. Sale-to-list moved from 95.0% to 94.8%.
A year-over-year read removes the season, which is why I would use it over a month-to-month change. It still is not a price index, because the homes that sold this September are not the ones that sold last September. A lower median can reflect cheaper homes selling as easily as lower values, so check recent closings on similar homes before drawing a conclusion. Younger October data stands at 11 posted closings and $500,000, provisional until it settles.
If you own a home here, this is the comparison to use when someone tells you what your home has gained or lost, and even then it applies to the market and not your address. A home that sold in September 2025 and again this September would give a truer answer, and few do. For a seller, the useful question is how your own street's closings moved over the same 12 months, which any recent sales report can show. For a buyer, the table is a check on any claim that prices are collapsing or racing away, since neither would show up as a one-point change in sale-to-list.
How Big Are the Price Cuts in Boulder City?
| Measure | Figure |
|---|---|
| Median cut | $24,900 |
| As a share of the original ask | 5.1% |
| Cut $50,000 or more | 12 |
| Median ask, all listings | $500,000 |
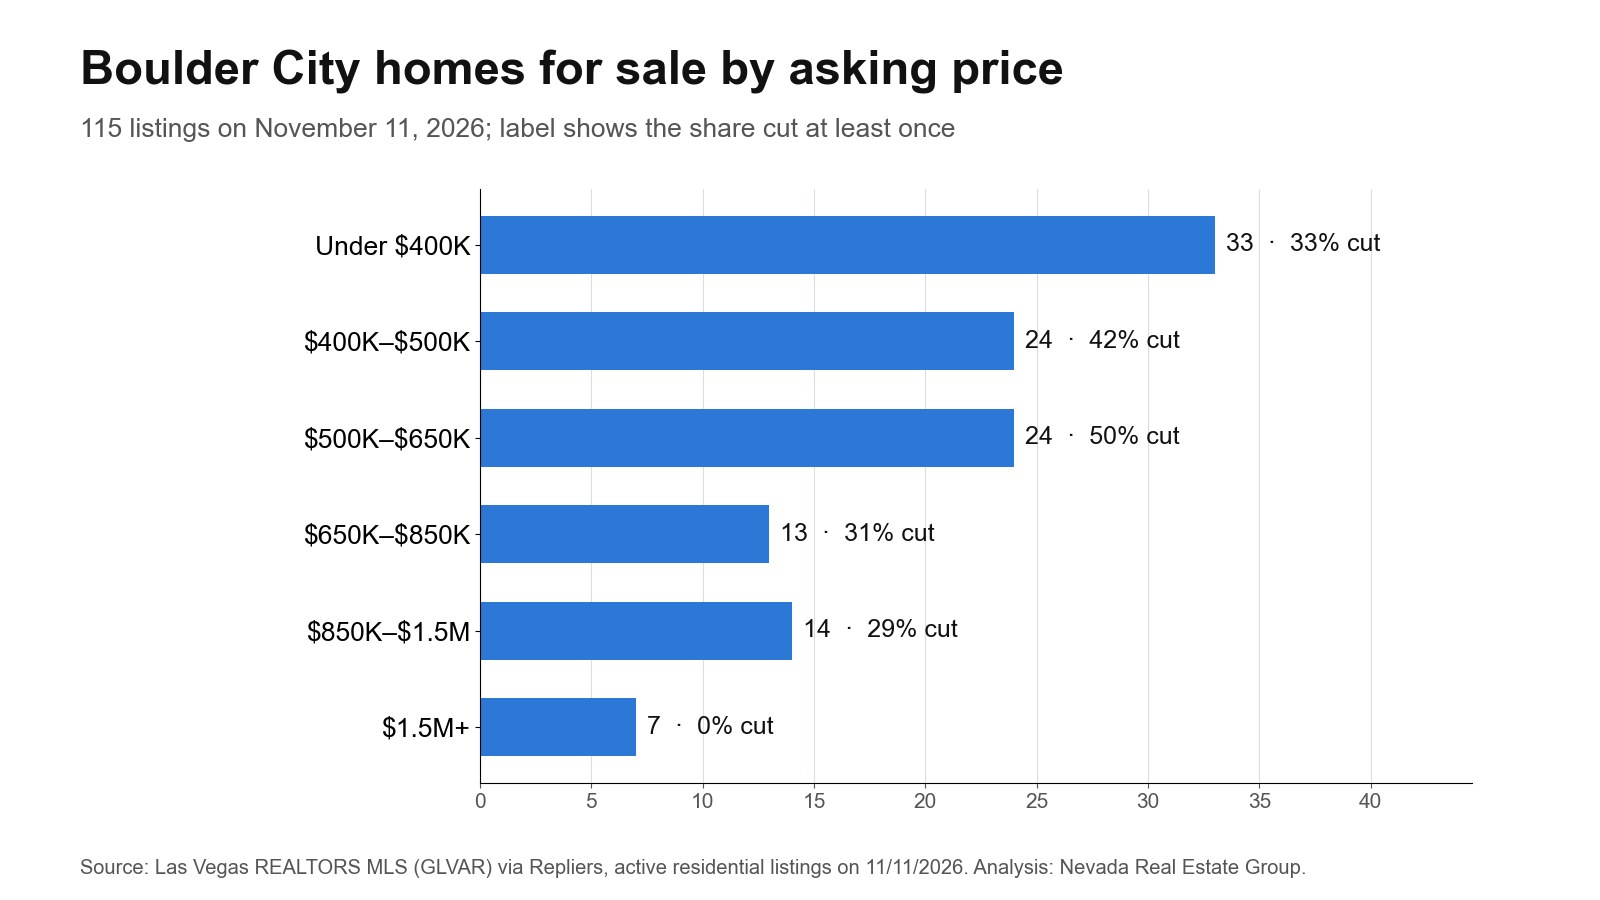
The median reduction on a cut Boulder City listing is $24,900, or 5.1% of the original ask. 12 listings have come down $50,000 or more.
Set that against what closed. A $24,900 cut from the $500,000 median ask gets to about $475,100, while the median home actually closed at $467,000 in September. One typical cut does not close that gap on its own, which is why some listings go through a second reduction. Those medians describe different homes, so use them as a rough scale and not a formula. Read a listing's history before you read its current price, because a home that has come down twice is in a different position from one that has never moved.
For a buyer, $24,900 is a useful yardstick. A listing that has come down much less than that may have further to go, and one that has come down far more may already be near its real price. For a seller, the same figure tells you what a typical correction costs, which is worth comparing with the extra weeks a high opening price would buy you.
Are Builders Keeping Pace With Boulder City Sales?
| Type | 2026 | 2025 |
|---|---|---|
| Single-family units | 48 | 9 |
| Units in buildings of five or more | 0 | 0 |
Single-family permits in Boulder City are running at about 5 a month this year, going by the Census Building Permits Survey, against 22 total closings in September, resale and new together. The city reported directly for only part of one of these periods, so Census estimated the rest and the comparison is approximate. Over the same months of 2025 the pace was about 1 a month.
The two numbers do not measure the same homes, since a closing can be a house built decades ago. Still, the ratio gives a feel for how much of the market's activity new building could replace. Permits are running below closings, so resale still sets the tone here. Builder pricing, incentives and lot costs are a separate conversation, and our new homes page is the place to start it.
For the newer month, Las Vegas REALTORS reported a $475,000 median price for existing single-family homes sold across Southern Nevada in October 2026, up 0.1% from October 2025, with 1,895 homes, condos and townhomes sold and nearly a six-month supply of homes, as FOX5 reported on November 6. That is a board-wide figure, not this report's own count.
A permit count also lags the decisions behind it, because builders commit to land long before they pull a permit. So the current pace says more about what builders expected a year ago than about what they expect now. Check the same figure again in a few months, and treat any single month of permits as noise, since one large project can land in a single report.
Are New Boulder City Listings Outpacing Sales?
| Window | Listings |
|---|---|
| Last 7 days | 3 |
| Last 14 days | 8 |
| Last 30 days | 26 |
| Closings in September | 22 |
26 of the homes on the November 11, 2026 list came on in the prior 30 days, against 22 closings in September. More homes came on than closed, though the two do not have to balance: listings also leave when they go under contract, expire or are withdrawn, and this count sees only homes still active.
The last seven days added 3 listings at a $483,000 median ask, at or below the $500,000 list median. New sellers set the current asking price, so that gap is worth watching from month to month. A rising figure with a flat closed median would mean sellers are opening further from where deals are getting done. Buyers can use that as a warning about fresh listings, and sellers should see it as a reason to check the closings first.
Watch this number along with the cut share. If new listings keep arriving at prices above recent closings, the share of homes that have to cut will keep climbing. If fresh listings come in closer to where deals are closing, the list will start to clear without help from a lower rate.
How Many Boulder City Homes Cut Their Price Before They Sold?
| Group | Share with a cut |
|---|---|
| Homes that closed in September | 40.9% |
| Homes still listed on November 11 | 35.7% |
40.9% of September's closings had been reduced at least once before going under contract, the fourth-lowest of the eight shares in this series. So in Boulder City, a cut is not unusual, but not the usual path either on the way to a sale.
For sellers, that makes the opening price a decision with a cost attached. The homes in that group spent time at a price the market would not pay, and the listing clock kept running. For buyers, it means a reduced home is not a damaged one: the cut tells you the first price was wrong, and nothing else.
On the list today, 35.7% of homes carry a reduction, and the median one is $24,900. A seller deciding between a higher opening price and a likely reduction later can weigh that figure against the extra weeks on the market.
Compare the two rows above and you can see how the list differs from the sales. When the active share runs ahead of the closed share, the homes still waiting are the ones that opened furthest from the market, and buyers can expect more of them to come down. When the two sit close together, cuts are simply part of how deals get done in Boulder City.
How Much Does the Mortgage Rate Change a Boulder City Payment?
| Rate | Monthly | Change |
|---|---|---|
| 6.18% | $2,591 | -$281 |
| 7.18% | $2,872 | today |
| 8.18% | $3,165 | +$292 |
Freddie Mac's survey put the average 30-year fixed rate at 7.18% for the week of 2026-11-05. With 20% down on $530,000, the payment is $2,872 a month. A rate one point lower would save $281 a month, and one point higher would add $292.
That is why waiting for a lower rate is a real bet and not a free option: the saving is plain, and so is the risk of a higher price or a higher rate by the time you buy. Use the mortgage calculator with your own numbers. The Federal Housing Finance Agency set the 2026 baseline conforming limit at $832,750, and loans at this price fall under it.
Lenders price each loan individually, so credit, down payment and points will put your rate above or below this average. Get quotes on the same day from at least two lenders, because a rate is only comparable with another taken at the same time. If a seller offers a credit, ask your lender what it would buy on your loan, and then compare the result with these rows.
What Can Boulder City Buyers Ask a Seller For?
More than a lower price. 95.5% of September closings finished below list, but a deal has other terms: a credit toward closing costs or a rate buydown, a repair after inspection, a closing date, and what stays with the home. At the 94.8% median sale-to-list, a $467,000 home closes about $24,300 under its final list, which gives you a sense of scale.
Decide which term is worth most to you before you offer. A buyer short on cash may want a credit, and one worried about the payment may want a buydown. Ask your lender how much credit your loan allows, since programs set limits. A seller who has been listed for a while, like the 60.9% of Boulder City homes past 60 days, may have more reason to say yes than one who listed last week.
With 115 listings, you can see the whole Boulder City market in a weekend of searching, so open the price history on each one.
Put every request in writing, with a deadline, and keep the inspection period intact. See current Boulder City listings, and read our buyer guide before you write your first offer.
Know what the seller can see, too. Your agent will send your pre-approval with the offer, and a seller comparing two offers will weigh the terms as well as the number. A clean request is more likely to get a yes than a long list.
Who Are Boulder City Sellers Competing With?
A seller listing today joins 115 active homes, 26 of them new in the last 30 days. Your real competition is the handful in your price band and neighborhood, not the citywide count, so pull those listings before you set a number.
Look at three things. What have the closest homes cut to? The median reduction here is $24,900. How long have they sat? The median listing has been up 77 days. And what do they offer that yours does not? A buyer will tour yours against those homes, not against a report.
Comparable sales are scarce: 22 closings in September. Go back further than usual for comparisons, and expect an appraiser to do the same. Then get a pre-listing look at condition, so you know what an inspection is likely to raise before a buyer does. Call or text (702) 637-1759 for a list of the homes you would compete with, or see how we work on our sellers page.
Your competition changes weekly, so check the list again the day before you go live. A neighbor's price cut can change your best opening number overnight, and it costs nothing to look. Nor does asking your agent who has gone under contract nearby since you last checked.
What Would Change the Boulder City Picture?
Because one month means so little here, read three together. August had 13 closings at $440,000; September had 22 closings at $467,000; October (provisional) had 11 closings at $500,000. Those medians can jump by tens of thousands of dollars on one sale, so look at the counts first.
The list is the steadier gauge. With 115 homes for sale and 26 new in the last 30 days, a real change would show up as a sustained rise or fall in that total over several editions, or as the 60.9% aged share moving. If it falls while closings hold, sellers gain ground, and if it climbs, buyers do. Until then, the Boulder City homes page and a few recent sales on similar homes will tell you more than any citywide figure. For the broader picture, the market page carries the settled history. Buyers should expect few choices at any one time, and sellers should expect a small pool of buyers, so patience works for both sides here. The next few editions matter more together than any one of them does alone, and I would not read a trend into fewer than three.
Frequently Asked Questions
What did the typical Boulder City house sell for in September?
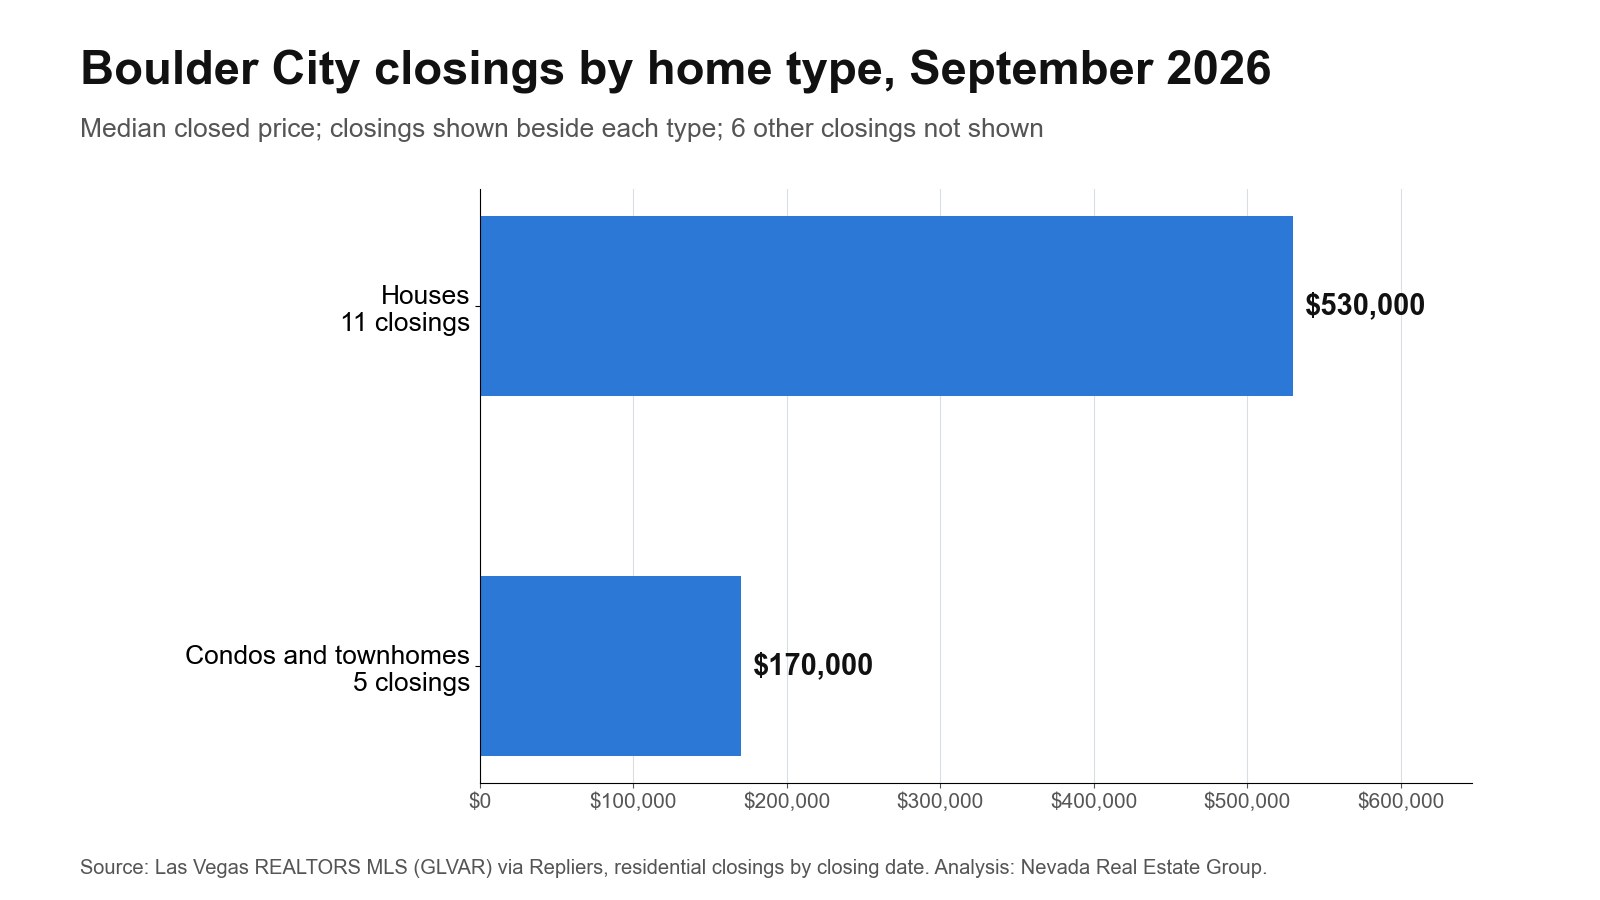
$530,000 across 11 single-family closings, at 97.9% of list. With condos and townhomes included, the median was $467,000.
Do Boulder City homes sell for less than asking?
95.5% did in September, and the median sale reached 94.8% of final list. 4.5% closed over list. Those figures come after any price cuts.
Are there more homes for sale in Boulder City than buyers?
There is no count of buyers, but listings ran 5.2 times September closings on November 11, 2026, with 115 homes active.
How long do Boulder City listings stay on the market?
The middle active listing has been up 77 days. 42.6% have passed 90 days and 7.0% are 14 days old or newer.
Are Boulder City home prices going up or down?
Year over year, the September median fell $4,400 (0.9%) to $467,000 from $471,400. One month is a thin read, so use the live market page for the longer trend.
How much cash do you need to buy in Boulder City?
On the $530,000 single-family median, 5% down is $26,500, 10% is $53,000 and 20% is $106,000. Closing costs and reserves are extra.
Which Sources Inform This Boulder City Report?
- Las Vegas REALTORS MLS (GLVAR) via Repliers: counted November 11, 2026.
- Freddie Mac PMMS: week of 2026-11-05.
- Census permits through September 2026 and the prior year.
- Las Vegas REALTORS October 2026 figures, reported by FOX5: the board's October 2026 figures.
- Our September 2026 report.
- More on Boulder City: area guide, homes for sale, new homes, housing guide, market page, ZIP reports, buying, payments, down payment help, selling.
Listings are counted one by one on the sweep date, residential only. Closings are counted by MLS closing date, and a month counts as settled once its last day is 40 days old; a younger month appears only as provisional. Listing age runs from the list date. This is market analysis, not a valuation of any specific property.
The latest citable figures, with method, sample size and a downloadable chart, are on our Las Vegas market data page. Based on information from the Greater Las Vegas Association of REALTORS® Multiple Listing Service for the period September 1, 2025 through November 11, 2026.
Thinking of selling in Boulder City? See how November’s numbers apply to your home