
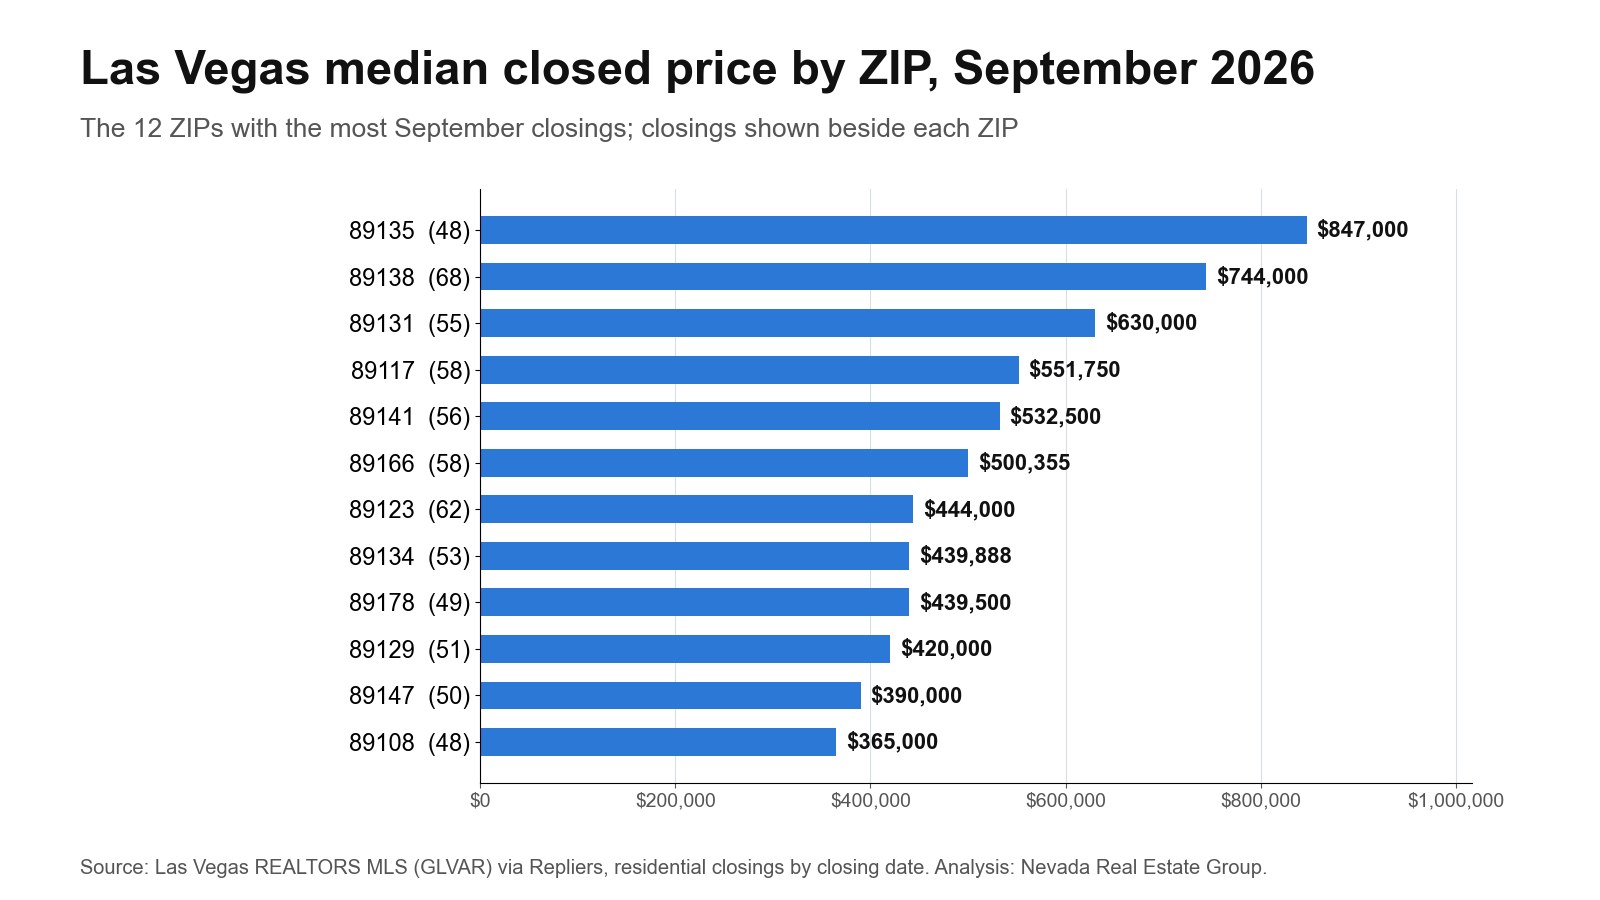
The MLS city of Las Vegas is dozens of ZIP markets reporting as one. Across 1,437 closings in September 2026, medians in the 35 ZIPs with 15 or more closings ran from $280,000 in 89101 (Downtown) to $847,000 in 89135 (Summerlin South), so the $435,000 headline is a blend of very different markets. The 8,144 homes still for sale on November 11, 2026 are the other half of the picture, and 45.6% of them have already come down.
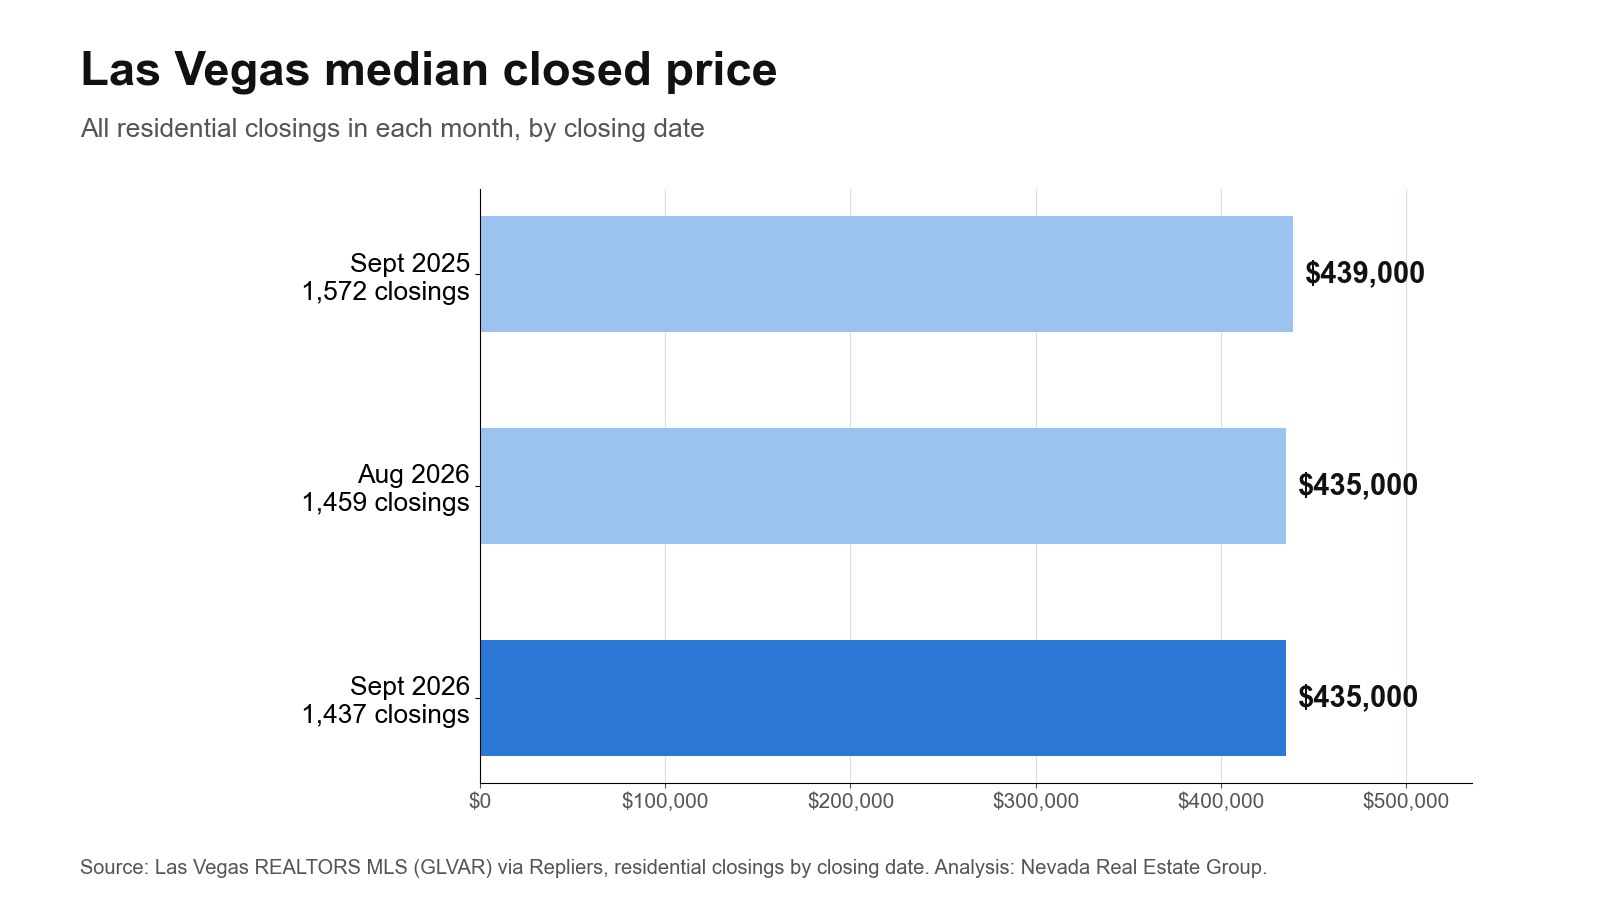
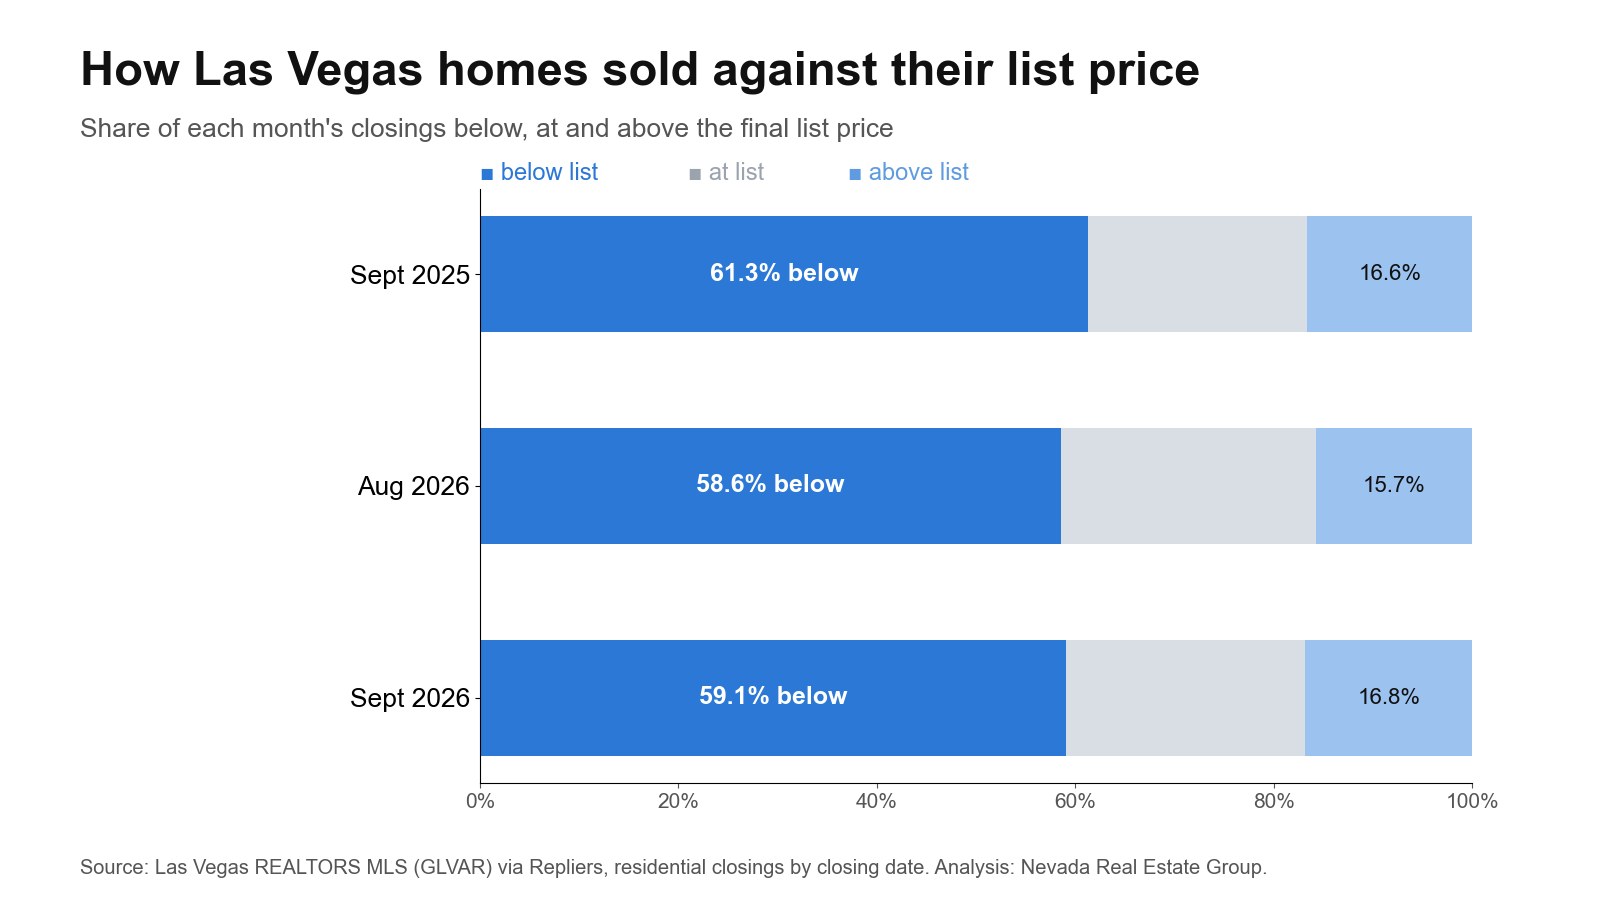
Las Vegas's median closed price was $435,000 in September 2026, per the Las Vegas REALTORS MLS (GLVAR) via Repliers, 1,437 closings. Under $400K is the biggest slice of the 8,144 listings counted November 11, at 40.0%. 59.1% of closings came in below list, so price against your ZIP's closings, not the city median.
- 8,144 Las Vegas homes were listed on November 11, at a $450,000 median ask.
- Buyers had most room in 89138, where 82.1% of closings landed below list.
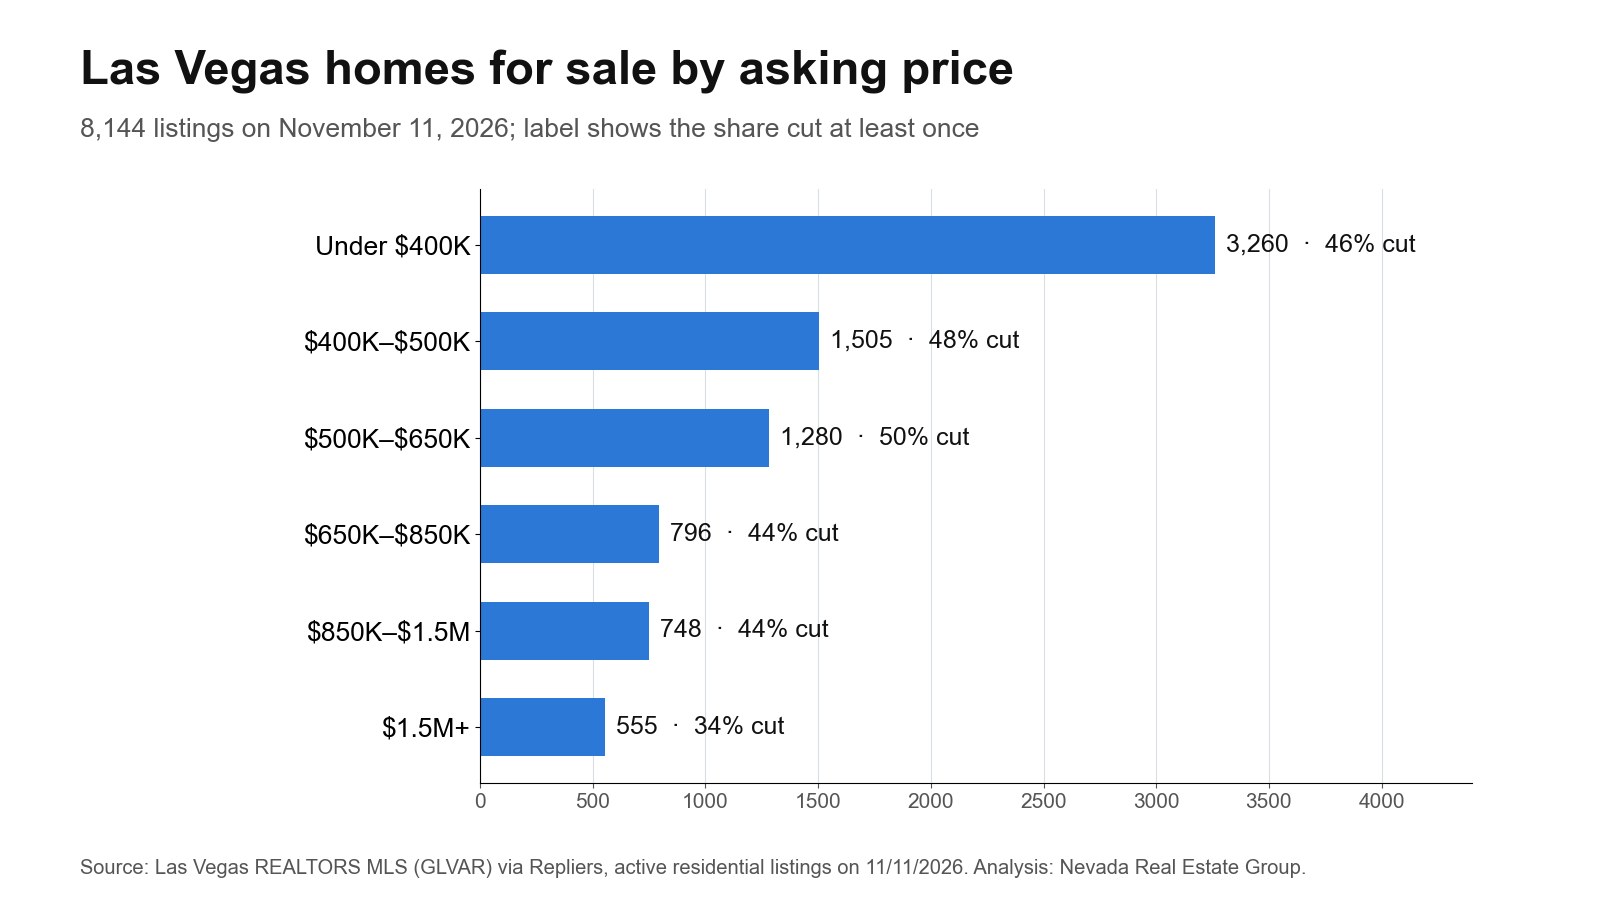
- $500K–$650K is the most-cut price band, at 50.2% of 1,280 listings.
- September closings ran $252 a square foot; homes listed on November 11 ask $257.
- The median clock went from 29 days in August to 28 days in September, listing to contract.
What Do the November 2026 Numbers Say About Las Vegas?
| Measure | Figure |
|---|---|
| Active listings | 8,144 |
| Closed per square foot | $252 |
| Median ask | $450,000 |
| September median closed | $435,000 |
| Houses | $480,000 |
| Condos and townhomes | $265,000 |
| Listed 60 days or more | 54.0% |
| Listings with a cut | 45.6% |
| Closed above list | 16.8% |
| Sale-to-list | 98.8% |
| Closed below list | 59.1% |
| Median days, listing to contract | 28 |
The figures follow the MLS city field, which goes by mailing address, so they take in unincorporated addresses as well as the City of Las Vegas. The ZIP spread is the local story here. 89138 (Summerlin West) logged the most closings at 68, and 89135 (Summerlin South) set the top ZIP median, so a citywide change often says more about which ZIPs happened to close than about what any one home is worth. With 8,144 listings and 2,043 of them new in the last 30 days, this is also the deepest list of the eight markets in this report series, so a buyer here has the most to compare and a seller the most to compete with.
All of these figures come from the Las Vegas REALTORS MLS (GLVAR) via Repliers. For the month-by-month series behind this table, open the live Las Vegas report, which covers the settled 12 months. That page groups sales by the MLS sold date, which on this feed is the contract date, so its monthly figures will not match this report's closing-date counts. That is the place to check whether this month's $435,000 is part of a run or a one-off.
Are Las Vegas Homes Selling Faster or Slower?
| Group | August | September |
|---|---|---|
| All homes | 29 | 28 |
| Still listed, days since list date | n/a | 66 |
Faster: the median went from 29 days in August to 28 days in September. That clock runs from listing to contract and counts only homes that sold, so it says nothing about the listings still waiting.
The other half of speed is on the active list, where the median home has been for sale 66 days. That is well past the 28 days a typical sale took, so the homes still sitting are not the ones that sold. A year ago the closing clock read 31 days. A seller can use that as a test: a home that goes well past the closing clock without an offer is telling you the price or the presentation is off. Provisional October closings, 1,301 so far, show 33 days.
Speed can change before prices do. If the median stretches for two or three months in a row, sellers may have to adjust, and if it shortens, buyers may lose room. One month is not a pattern, so keep this figure next to the August reading and the next edition's reading before you draw any conclusion from it.
In Which Las Vegas ZIP Codes Do Buyers Have the Most Room?
| ZIP | Below list | Sale-to-list | Closings |
|---|---|---|---|
| 89138 (Summerlin West) | 82.1% | 97.6% | 68 |
| 89118 (Southwest, west of I-15) | 80.0% | 96.8% | 25 |
| 89113 (Southwest) | 77.5% | 98.2% | 40 |
| 89109 (Strip corridor) | 76.2% | 95.2% | 21 |
| 89145 (Queensridge) | 73.3% | 97.5% | 30 |
| 89135 (Summerlin South) | 72.9% | 97.6% | 48 |
| 89183 (St. Rose corridor) | 40.5% | 100.0% | 37 |
| 89110 (East Las Vegas) | 38.5% | 100.0% | 26 |
| 89108 (Northwest central) | 37.5% | 100.0% | 48 |
| 89149 (Centennial Hills west) | 36.8% | 100.0% | 38 |
| 89107 (West Charleston) | 33.3% | 100.0% | 28 |
| 89156 (Sunrise Mountain) | 31.6% | 100.0% | 19 |
82.1% of September closings in 89138 (Summerlin West) landed below list, the most in this table, at a 97.6% median sale-to-list. At the other end, 89156 (Sunrise Mountain) saw 31.6% below list at 100.0%.
That is the difference between opening under asking and paying close to it. It is a ZIP-level average and not a rule for one house: a well-priced home in 89138 can still draw full price, and an overpriced one in 89156 can still sit. Use these rows to set your expectations before you write an offer, then pull the sales on the street itself. Sellers can read the same table the other way, since it shows where a buyer is likely to ask for something. Every ZIP has a page on the ZIP report index.
The busiest ZIPs in September, one line each:
- 89138 (Summerlin West): 68 closings at $744,000, 97.6% of list, 308 listed with 55.2% cut.
- 89123 (Silverado Ranch): 62 closings at $444,000, 98.1% of list, 239 listed with 43.5% cut.
- 89117 (Peccole Ranch and The Lakes): 58 closings at $551,750, 98.5% of list, 309 listed with 45.0% cut.
- 89166 (Skye Canyon): 58 closings at $500,355, 100.0% of list, 297 listed with 53.5% cut.
- 89141 (Southern Highlands): 56 closings at $532,500, 99.1% of list, 246 listed with 44.7% cut.
- 89131 (Iron Mountain): 55 closings at $630,000, 98.7% of list, 209 listed with 51.7% cut.
Which Las Vegas Price Bands Are Cutting the Most?
| Band | Cut share | Listings |
|---|---|---|
| $500K–$650K | 50.2% | 1,280 |
| $400K–$500K | 47.8% | 1,505 |
| Under $400K | 45.5% | 3,260 |
| $850K–$1.5M | 44.0% | 748 |
| $650K–$850K | 43.8% | 796 |
| $1.5M+ | 34.2% | 555 |
$500K–$650K has the highest cut share at 50.2% of 1,280 listings, and $1.5M+ the lowest at 34.2% of 555. The citywide figure of 45.6% sits between them.
A cut share shows where sellers have already conceded once. In $500K–$650K, more than half of the competition has reduced its price, so a new listing there is being compared with homes that have already adjusted. Where few have cut, the asking prices are less tested, and a buyer should not assume they reflect what those homes will close for. Bands under 10 listings are left out because a percentage on so few homes means little. See the homes for sale in Las Vegas to check a specific band against recent closings.
For sellers in the most-cut band, the lesson is that buyers there have a long list of reduced homes to compare yours with. For sellers in the least-cut band, the opposite warning applies: asking prices there have not been tested, and an unchanged price is not the same as a sale. In either case, recent closings in the same band are the better guide.
What Did Las Vegas Buyers Pay Per Square Foot in September?
| Group | Closed | Asked |
|---|---|---|
| All homes | $252 | $257 |
| Single Family Residence | $258 | $266 |
| Condo / Townhouse | $223 | $225 |
Price per square foot takes some of the size mix out of a median. Across all homes the closed figure was $252 and the asking figure $257, a $5 premium on the asking side. On a 2,000-square-foot home that is $10,000. The homes for sale are not the homes that closed, so treat that as a guide to the distance and not as a discount on offer.
A condo that looks cheap in total can still sit close to a house per foot, so compare both numbers before ruling either out. To value one home, take closed sales of similar size and age nearby and use their per-foot number, because this citywide figure mixes every age and finish level in Las Vegas. If a seller's price works out far above recent closings per foot, the burden is on the home to show why.
Per-foot comparisons work best inside one neighborhood and one age of home. Across a whole city they are a rough scale, and a large lot or a recent remodel can justify a figure well above the median. Ask for the per-foot number on the three closest sales, and compare those with the listing you are looking at.
Are Builders Keeping Pace With Las Vegas Sales?
| Type | 2026 | 2025 |
|---|---|---|
| Single-family units | 1,547 | 1,621 |
| Units in buildings of five or more | 861 | 283 |
Single-family permits issued by the City of Las Vegas are running at about 172 a month this year, going by the Census Building Permits Survey, against 1,437 total closings in September, resale and new together. Over the same months of 2025 the pace was about 180 a month. The MLS area behind those closings also takes in unincorporated Clark County, which the Census counts separately: 1,236 single-family units through September 2026, not all of them at Las Vegas addresses.
The two numbers do not measure the same homes, since a closing can be a house built decades ago. Still, the ratio gives a feel for how much of the market's activity new building could replace. Permits are running below closings, so resale still sets the tone here. Builder pricing, incentives and lot costs are a separate conversation, and our new homes page is the place to start it.
For the newer month, Las Vegas REALTORS reported a $475,000 median price for existing single-family homes sold across Southern Nevada in October 2026, up 0.1% from October 2025, with 1,895 homes, condos and townhomes sold and nearly a six-month supply of homes, as FOX5 reported on November 6. That is a board-wide figure, not this report's own count.
A permit count also lags the decisions behind it, because builders commit to land long before they pull a permit. So the current pace says more about what builders expected a year ago than about what they expect now. Check the same figure again in a few months, and treat any single month of permits as noise, since one large project can land in a single report.
What Does the Median Las Vegas Home Cost Per Month?
| Down payment | Cash down | Loan | Monthly |
|---|---|---|---|
| 5% | $24,000 | $456,000 | $3,089 |
| 10% | $48,000 | $432,000 | $2,927 |
| 20% | $96,000 | $384,000 | $2,601 |
Freddie Mac's survey put the average 30-year fixed rate at 7.18% for the week of 2026-11-05. On Las Vegas's $480,000 single-family median, moving from 5% down to 20% down cuts the monthly principal and interest by $488 and takes another $72,000 in cash up front. Taxes, insurance, any HOA dues and mortgage insurance come on top, and mortgage insurance applies at the lower down payments.
These are illustrations, not quotes. Run your own price and rate in the mortgage calculator, then compare lenders on full Loan Estimates, because the rate on an advert is not the cost of the loan. Property tax on a resale needs its own line, because a new owner has to claim the primary-residence abatement cap; the property tax guide explains how.
The cash column is worth a second look. Beyond the down payment, plan for closing costs and for reserves after you move in, since an inspection can turn up repairs and the first year of ownership can bring more. A lower down payment leaves more cash in hand at a higher monthly cost, and neither choice is right for everyone. Decide with your lender which one fits your income and savings.
How Do You Win a Well-Priced Las Vegas Listing?
Be ready before it comes on. 16.8% of September closings went over list, and only 11.5% of the current list is 14 days old or newer, so the good new homes are a small group and buyers notice them at the same time. Get a full pre-approval, not a quick pre-qualification, and set up an alert so you see a new listing the day it arrives.
When you do write an offer, price it against the closest recent sales, and know your limit. The median sale took 28 days from listing to contract, so a home with several buyers around it can go much faster than that. Beyond price, a shorter inspection period or a closing date that suits the seller can make an offer stronger without adding a dollar, as long as you are comfortable with the risk.
Pick two or three ZIPs before you pick a house. With 8,144 listings spread across more than 40 ZIPs, 89101 (Downtown) and 89135 (Summerlin South) are not the same search.
If you lose one, the next may be closer than you think: 457 homes came on in the final week before this count. Start with current Las Vegas listings and the buyer guide.
Set your limit before you see the other offers, and put it in writing for yourself. It is much easier to walk away from a number you chose calmly at home than one you reach under a deadline.
When Should Las Vegas Sellers List?
When the home is ready and your numbers work, more than on any date. 1,459 homes closed in August and 1,437 in September, so buyers are in the market through the year, and 2,043 sellers listed in the 30 days before this count. Waiting for a better month means betting on rates, on demand and on how many others decide the same thing.
What you can control is the first impression. A listing that goes live with good photos, a fair price and repairs done gets a stronger start than one that goes up early and is corrected later. If you have to sell by a set date, work back from it: listing to contract took 28 days at the median in September, and escrow comes on top of that.
Your comparison is your ZIP and not the city. 89138 (Summerlin West) alone closed 68 homes, so in most of the valley there is plenty of nearby evidence.
Before you decide, get a list of what has closed near you and what you would compete with. Call or text (702) 637-1759, or start with our sellers page.
If you are also buying, plan the two sides together, since the date you can leave and the date you can move in rarely line up by themselves.
Which Las Vegas ZIPs Should You Watch Next?
Start with the two ends of the supply table. 89109 (Strip corridor) had 332 homes listed against 21 closings in September, the most crowded ratio among the reporting ZIPs. 89143 (Northwest Centennial Hills) had 86 listed against 31 closings, the tightest.
If the crowded ZIP keeps adding listings faster than it closes them, more of those sellers will have to cut, and the price pressure there should show up first in its sale-to-list figure, which stood at 95.2%. If the tight ZIP stays tight, its $555,000 median has support. Citywide, I would watch whether the 45.6% cut share rises or falls next month, since a falling share would mean sellers have finished adjusting. That matters more than a small move in the $435,000 headline, and the live Las Vegas ZIP pages will show it first. For owners who are not selling, none of this requires action. For anyone planning a sale in the next year, the crowded ZIPs are the place to be early and realistic. The next edition will also show whether October's provisional count holds up, and how far it moved as late closings posted.
Frequently Asked Questions
How much do homes sell for in Las Vegas?
Half of September 2026 closings went above $435,000 and half below. Attached homes centered on $265,000, and sales ran $252 per square foot overall.
Who has the advantage in Las Vegas, buyers or sellers?
Going by finished deals, buyers have an edge. 16.8% of September closings beat list and 59.1% fell short of it.
Is Las Vegas inventory high right now?
8,144 homes were listed on November 11, 2026 against 1,437 closings in September. We do not publish months of supply, because the boards calculate theirs differently.
How quickly should a Las Vegas home get an offer?
The September benchmark is 28 days, listing to contract. A home well past that, like the 54.0% of listings up 60 days or more, needs a closer look at price.
Is the Las Vegas market slowing down?
Closings went from 1,459 in August to 1,437 in September, and the median clock from 29 days to 28 days. Two months cannot prove a turn.
What is the monthly payment on a median Las Vegas home?
On $480,000 at 7.18%, principal and interest is about $2,927 with 10% down and $2,601 with 20% down, before taxes, insurance and dues.
Which Sources Inform This Las Vegas Report?
- Las Vegas REALTORS MLS (GLVAR) via Repliers: counted November 11, 2026.
- Freddie Mac PMMS: week of 2026-11-05.
- Census permits through September 2026 and the prior year.
- Las Vegas REALTORS October 2026 figures, reported by FOX5: the board's October 2026 figures.
- Our September 2026 report.
- More on Las Vegas: area guide, homes for sale, new homes, housing guide, market page, ZIP reports, buying, payments, down payment help, selling.
Listings are counted one by one on the sweep date, residential only. Closings are counted by MLS closing date, and a month counts as settled once its last day is 40 days old; a younger month appears only as provisional. Listing age runs from the list date. This is market analysis, not a valuation of any specific property.
The latest citable figures, with method, sample size and a downloadable chart, are on our Las Vegas market data page. Based on information from the Greater Las Vegas Association of REALTORS® Multiple Listing Service for the period September 1, 2025 through November 11, 2026.
Thinking of selling in Las Vegas? See how November’s numbers apply to your home