
Henderson closed $70,000 above Las Vegas at the median in September 2026, $505,000 against $435,000, and the premium came with a slower clock: 36 days from listing to contract against 28 days. On the active side, 46.4% of 2,299 listings had taken a cut by November 11, 2026, and 46.0% of the homes that closed had done the same first.
Henderson's median closed price was $505,000 in September 2026, per the Las Vegas REALTORS MLS (GLVAR) via Repliers, 470 closings. 46.0% of those homes cut price before they sold, and 62.5% closed under list at 98.8%. Treat the premium as real and the opening ask as negotiable, ZIP by ZIP.
- Henderson closed $70,000 above Las Vegas at the median, on a 36-day clock against 28 days.
- ZIP medians ran from $450,000 in 89014 to $621,250 in 89052 this month.
- Compared with September 2025, the median rose $9,800 (2.0%) to $505,000 and closings went from 468 to 470.
- Attached homes were 16.4% of September closings and 21.2% of the active list.
- 1,022 of 2,299 listings, 44.5%, ask less than $500,000.
What Are Henderson's Key Housing Numbers for November 2026?
| Measure | Figure |
|---|---|
| Closed per square foot | $260 |
| Listed 60 days or more | 50.4% |
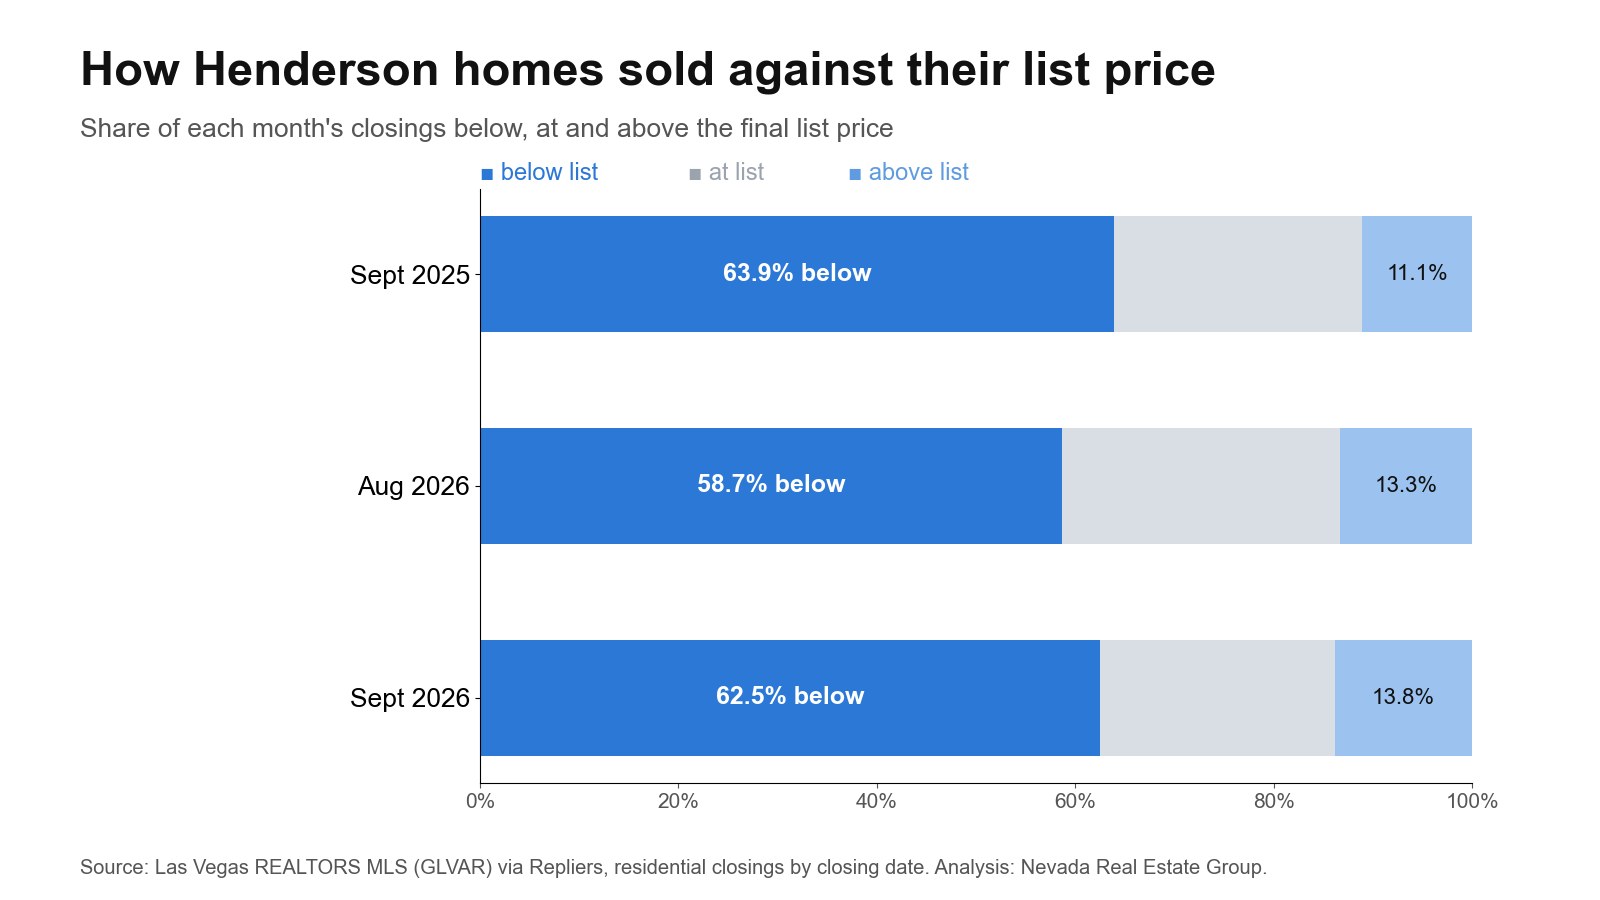
| Closed above list | 13.8% |
| Active listings | 2,299 |
| Houses | $539,000 |
| September median closed | $505,000 |
| Median ask | $534,997 |
| Closed below list | 62.5% |
| Condos and townhomes | $335,000 |
| Sale-to-list | 98.8% |
| Listings with a cut | 46.4% |
| Median days, listing to contract | 36 |
The figures follow the MLS city field for Henderson. Master-planned ZIPs do not move together here. 89014 (Green Valley North) ran the shortest clock at 26 days, while 89015 (East Henderson) took 39 days, a difference a citywide median hides. Asking prices tell the same story: the median house asks $599,995 and the median attached home $357,450, and at the top of the market 266 homes ask $1.5 million or more. Buyers should read each ZIP on its own terms.
All of these figures come from the Las Vegas REALTORS MLS (GLVAR) via Repliers. The Henderson market page has the settled trend, month by month, for anyone who wants more than this snapshot. That page groups sales by the MLS sold date, which on this feed is the contract date, so its monthly figures will not match this report's closing-date counts.
How Does September Compare With a Year Earlier in Henderson?
| Measure | September 2025 | September 2026 |
|---|---|---|
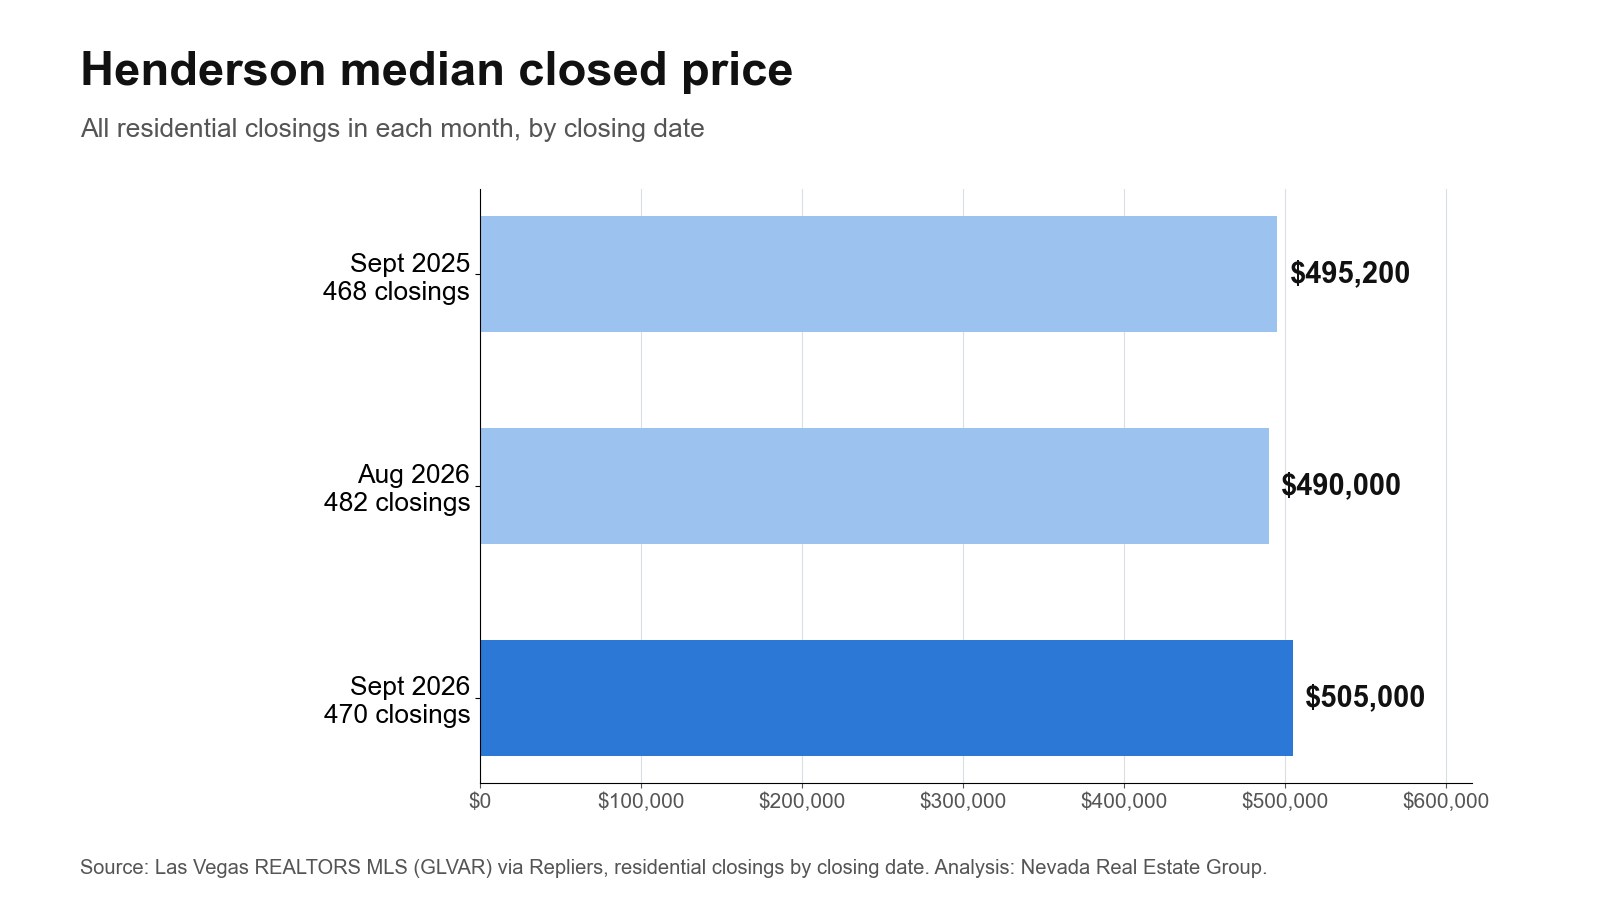
| Median closed | $495,200 | $505,000 |
| Closings | 468 | 470 |
| Sale-to-list | 98.5% | 98.8% |
| Closed below list | 63.9% | 62.5% |
Against September 2025, the median rose $9,800 (2.0%) to $505,000, and the closing count went from 468 to 470. Sale-to-list moved from 98.5% to 98.8%.
A year-over-year read removes the season, which is why I would use it over a month-to-month change. It still is not a price index, because the homes that sold this September are not the ones that sold last September. Check your own ZIP before leaning on the citywide read. Younger October data stands at 412 posted closings and $489,875, provisional until it settles.
If you own a home here, this is the comparison to use when someone tells you what your home has gained or lost, and even then it applies to the market and not your address. A home that sold in September 2025 and again this September would give a truer answer, and few do. For a seller, the useful question is how your own street's closings moved over the same 12 months, which any recent sales report can show. For a buyer, the table is a check on any claim that prices are collapsing or racing away, since neither would show up as a one-point change in sale-to-list.
Which Henderson ZIP Codes Cost the Most and the Least?
| ZIP | Median closed | Closings | Median ask |
|---|---|---|---|
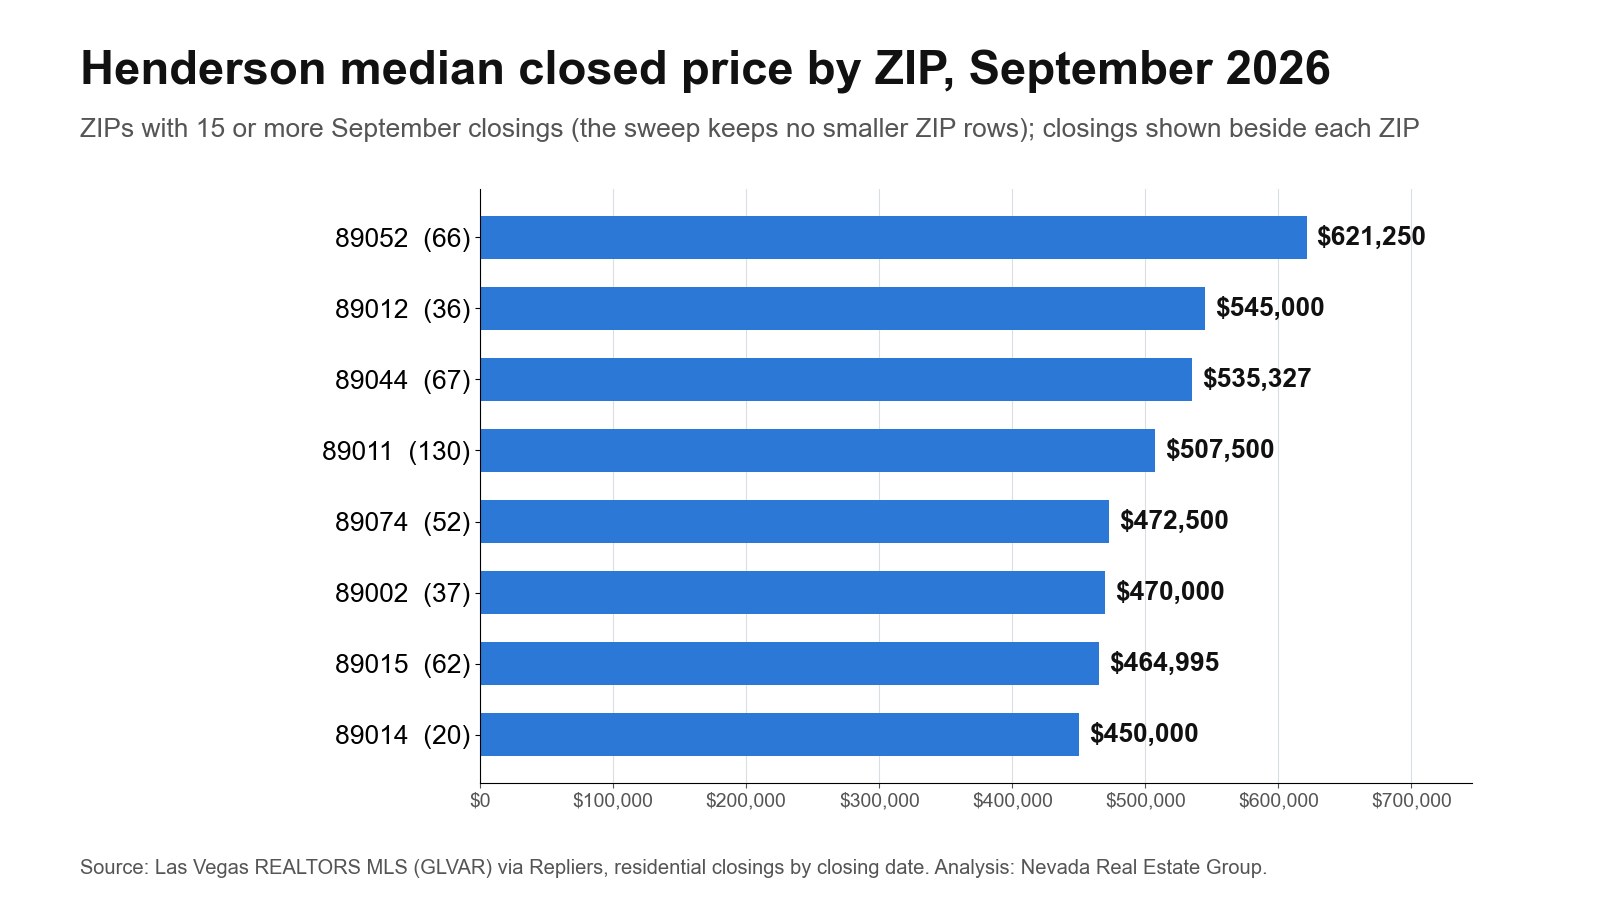
| 89052 (Green Valley South and Anthem) | $621,250 | 66 | $672,500 |
| 89012 (MacDonald Ranch and Green Valley) | $545,000 | 36 | $649,900 |
| 89044 (Inspirada) | $535,327 | 67 | $549,100 |
| 89011 (Cadence and Lake Las Vegas) | $507,500 | 130 | $548,000 |
| 89074 (Green Valley) | $472,500 | 52 | $499,995 |
| 89002 (Black Mountain and Mission Hills) | $470,000 | 37 | $489,450 |
| 89015 (East Henderson) | $464,995 | 62 | $459,990 |
| 89014 (Green Valley North) | $450,000 | 20 | $429,900 |
89052 (Green Valley South and Anthem) closed at $621,250 and 89014 (Green Valley North) at $450,000, a spread of $171,250 inside one market. The top ZIP sold 66 homes and the bottom 20, so neither is a one-off.
For a buyer, that spread is the budget question. A $505,000 budget is below the median in 4 of these 8 ZIPs, so a citywide price tells you little about where that money works. For a seller, it means the only comparison that counts is the one inside your own ZIP row. ZIPs with fewer than 15 closings are left out rather than printed on a handful of sales. Each ZIP has its own page on the ZIP report index.
The busiest ZIPs in September, one line each:
- 89011 (Cadence and Lake Las Vegas): 130 closings at $507,500, 99.4% of list, 631 listed with 48.2% cut.
- 89044 (Inspirada): 67 closings at $535,327, 98.5% of list, 246 listed with 49.6% cut.
- 89052 (Green Valley South and Anthem): 66 closings at $621,250, 97.6% of list, 382 listed with 43.7% cut.
- 89015 (East Henderson): 62 closings at $464,995, 99.7% of list, 251 listed with 42.6% cut.
- 89074 (Green Valley): 52 closings at $472,500, 98.6% of list, 218 listed with 51.8% cut.
- 89002 (Black Mountain and Mission Hills): 37 closings at $470,000, 99.0% of list, 162 listed with 51.9% cut.
How Many New Houses Are Coming to Henderson?
| Type | 2026 | 2025 |
|---|---|---|
| Single-family units | 1,587 | 2,075 |
| Units in buildings of five or more | 0 | 595 |
The Census Building Permits Survey shows 1,587 single-family units permitted in Henderson through September, down from 2,075 over the same months of 2025. A permit is a plan to build and not a finished home, so this number points to next year's competition more than this month's list.
For a resale seller, fewer permits mean less new competition coming. For a buyer, new construction is the alternative to weigh against the 2,299 homes already listed, and it comes with its own costs, from lot premiums to upgrades. Permits count the city's own permit office only, so homes going up just outside the line do not appear here. Our new homes page tracks what is being built.
For the newer month, Las Vegas REALTORS reported a $475,000 median price for existing single-family homes sold across Southern Nevada in October 2026, up 0.1% from October 2025, with 1,895 homes, condos and townhomes sold and nearly a six-month supply of homes, as FOX5 reported on November 6. That is a board-wide figure, not this report's own count.
These counts cover what the city's own office issued, and homes in nearby unincorporated areas are counted elsewhere. For anyone buying here for the long term, the direction over two or three years matters more than one year's change, because that is what sets how much new competition a resale home will face when it is time to sell.
Which Homes Made Up Henderson's September Closings?
| Type | Share of closings | Share of listings | Median closed | Median ask |
|---|---|---|---|---|
| Single Family Residence | 81.5% | 76.9% | $539,000 | $599,995 |
| Condo / Townhouse | 16.4% | 21.2% | $335,000 | $357,450 |
Attached homes were 16.4% of September closings and 21.2% of the active list. They take up more of the list than of the sales, so condos and townhomes have more competition for each buyer than houses do.
The pairs in the table are the more useful read. The median house asks $599,995 and closed at $539,000, a $60,995 difference. The median attached home asks $357,450 and closed at $335,000, a $22,450 difference. The bigger gap marks the side of the market where sellers and recent buyers are furthest apart. A buyer shopping one type should ignore the blended figure and use that type's closings.
This also explains why two honest reports can show different numbers for the same month. A report that counts only single-family homes would show $539,000, and one that counts everything would show $505,000. Neither is wrong. When you read any Henderson figure, check the property types first, then the date window, and then whether it is a closing date or a contract date. Check all three before you compare two reports.
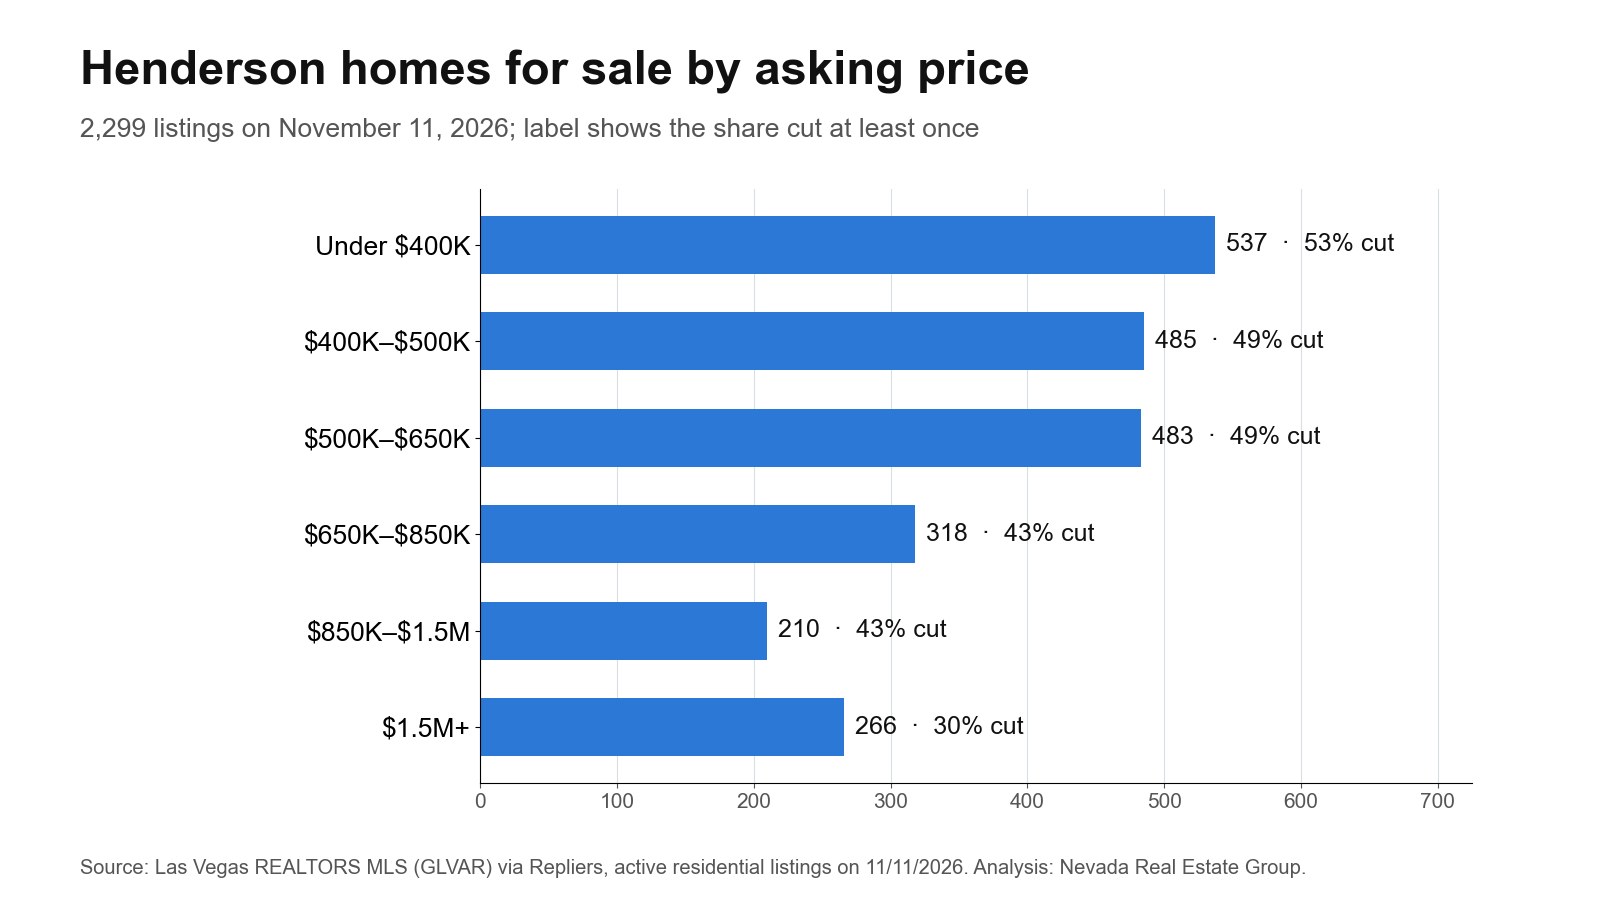
How Much of Henderson Is Listed Under $500,000?
| Band | Listings | Share of list | Cut share |
|---|---|---|---|
| Under $400K | 537 | 23.4% | 53.3% |
| $400K–$500K | 485 | 21.1% | 48.7% |
| $500K–$650K | 483 | 21.0% | 48.9% |
1,022 of 2,299 listings, or 44.5%, ask less than $500,000: 537 under $400,000 and 485 between $400,000 and $500,000. 53.3% of the first group and 48.7% of the second have already cut.
Those are the bands a payment-minded buyer shops first. Check the home type before you count on them: the median attached ask is $357,450 and the median house asks $599,995, so a good part of the cheaper list may be attached homes with dues on top. Compare the full monthly cost, not the price. The first-time buyer guide covers what to line up before you compete at this level, and it is worth reading before the first tour rather than after the first lost offer.
In these bands, small price differences move a home in or out of many buyers' search filters, so round-number pricing matters to a seller. For a buyer, a home just above your limit may be worth a look, since 46.4% of the list has already come down. Watch the price history on those homes, because a cut can bring one into range within weeks of your search starting.
How Does Henderson's Inventory Compare With Its Neighbors?
| Market | Active | Closings | Listings per closing | Cut share |
|---|---|---|---|---|
| Las Vegas | 8,144 | 1,437 | 5.7 | 45.6% |
| Boulder City | 115 | 22 | 5.2 | 35.7% |
| Summerlin | 1,146 | 227 | 5.0 | 49.1% |
| Henderson | 2,299 | 470 | 4.9 | 46.4% |
| North Las Vegas | 972 | 259 | 3.8 | 46.5% |
Divide listings by a month's closings and Henderson comes out at 4.9. Las Vegas is highest at 5.7, and North Las Vegas is lowest at 3.8.
This is a plain comparison and not a months-of-supply figure, which the boards calculate on their own basis. It still answers a useful question: how crowded is the list a seller is joining? A higher ratio means more homes competing for each buyer, so the first price has to do more of the work. A lower ratio gives a seller more room, for a while. It says nothing about which homes are selling, so pair it with the ZIP and price-band figures above. The linked pages show each market's current list.
At 4.9 listings per closing, a Henderson seller can test that figure in a simple way: take the listings in your price band and ZIP, divide by the closings in the same slice, and see whether your part of the market is more or less crowded than the citywide figure. A local ratio well above 4.9 means the opening price has very little room for error.
Should Henderson Buyers Wait or Buy Now?
The numbers do not settle that alone, but they frame it. The median moved from $490,000 to $505,000 between August and September, and 46.4% of today's list has come down. That is plenty of negotiating room for a buyer who is ready.
Waiting has a clear cost and an unclear payoff. Rates and prices can both move either way, and nobody knows which comes first, so the better question is whether the home works at today's payment. If it does, compare it with the Henderson listings that have sat longest, because that is where the deal is likely to be. If it does not, keep saving and let the list come to you.
Compare 89015 (East Henderson) with 89014 (Green Valley North) before you commit: one took 39 days and the other 26 days, so they give you very different time to negotiate. The first-time buyer guide walks through both paths, and the mortgage calculator will show what a rate change would do to your payment.
A practical way to decide is to set the payment you would be comfortable with for several years and test it against a home you actually like. If that works, the question of where the market goes next matters less.
What Should Henderson Sellers Do If the Home Isn't Selling?
You would have company: 50.4% of Henderson listings have been up 60 days or more. The median September sale took 36 days, so past about twice that, the market has seen the home and given its answer.
Start with what the showings say. Few showings mean the price or the photos are losing the click. Plenty of showings and no offers mean the home is not matching what the price promises. Those call for different fixes, and only one of them is a cut.
If price is the problem, make the reduction large enough to reach a new group of searches. A small cut can leave you inside the same search filters with a lower number. 228 Henderson listings have come down $50,000 or more, so buyers are used to seeing it. The Henderson premium over Las Vegas was $70,000 in September, but a premium does not protect an ambitious ask: 46.0% of those who sold had to come down first. For a second opinion, call or text (702) 637-1759, or see our sellers page.
Before you change anything, ask your agent to show you what sold near you while your home sat. If those homes closed below your price, that is the answer. If they closed above it, the problem is in the presentation, and a price cut would give away money for no reason.
Will Henderson's Premium Over Las Vegas Hold?
The premium was $70,000 at the median in September, up from $55,000 in August. For houses alone, Henderson closed at $539,000 against $480,000 in Las Vegas. That is the number to watch over the next few editions, because it answers the question most Henderson buyers are really asking: what am I paying for the address?
One month's gap moves with the mix of homes, so look for a run of months before calling a change. What would worry a Henderson seller is the gap narrowing while the 46.4% cut share keeps climbing, since that would mean buyers are no longer paying up. A widening gap with a slower clock would be the opposite story: sellers holding out, and getting it, at the cost of time. The Henderson market page tracks the settled months, and new construction in Henderson is the alternative a resale seller has to price against. Either way, the comparison that counts for your own home is the ZIP row above, since a Henderson-wide premium can sit on top of very different local results across Inspirada, Green Valley and the east side of the city. I would judge the premium by the house figures first.
Frequently Asked Questions
What is the median home price in Henderson?
$505,000 for closings in September 2026, the latest settled month, on 470 sales. Houses alone were $539,000, and the median ask on November 11, 2026 was $534,997.
Who has the advantage in Henderson, buyers or sellers?
Going by finished deals, buyers have an edge. 13.8% of September closings beat list and 62.5% fell short of it.
How many homes are for sale in Henderson?
2,299 residential listings on November 11, 2026: 1,768 houses at a $599,995 median ask and 488 condos and townhomes at $357,450.
Are Henderson homes selling fast?
Homes that sold in September took 36 days at the median, but 50.4% of the current list has been up 60 days or more. Price decides which group a home joins.
Is the Henderson market slowing down?
Closings went from 482 in August to 470 in September, and the median clock from 37 days to 36 days. Two months cannot prove a turn.
How much cash do you need to buy in Henderson?
On the $539,000 single-family median, 5% down is $26,950, 10% is $53,900 and 20% is $107,800. Closing costs and reserves are extra.
Which Sources Inform This Henderson Report?
- Las Vegas REALTORS MLS (GLVAR) via Repliers: counted November 11, 2026.
- Freddie Mac PMMS: week of 2026-11-05.
- Census permits through September 2026 and the prior year.
- Las Vegas REALTORS October 2026 figures, reported by FOX5: the board's October 2026 figures.
- Our September 2026 report.
- More on Henderson: area guide, homes for sale, new homes, housing guide, market page, ZIP reports, buying, payments, down payment help, selling.
Listings are counted one by one on the sweep date, residential only. Closings are counted by MLS closing date, and a month counts as settled once its last day is 40 days old; a younger month appears only as provisional. Listing age runs from the list date. This is market analysis, not a valuation of any specific property.
The latest citable figures, with method, sample size and a downloadable chart, are on our Las Vegas market data page. Based on information from the Greater Las Vegas Association of REALTORS® Multiple Listing Service for the period September 1, 2025 through November 11, 2026.
Thinking of selling in Henderson? See how November’s numbers apply to your home