

Every summer since I started selling Las Vegas real estate in 2011, I get the same call: "Chris, is the market about to crash?" In July 2026 that call is louder than usual, because active listings have climbed to a multi-year high and buyers can finally feel the market breathing. When I pulled the live Greater Las Vegas Realtors feed the morning I updated this guide, the valley held 12,839 active residential listings — up from roughly 8,100 at the end of the first quarter and about 5,200 a year earlier. Headlines latched on. Buyers paused. Sellers panicked.
But across the 9,600+ closings the Nevada Real Estate Group team has represented, including 789 transactions in 2025 alone, I have learned that "crash" and "correction" are not synonyms. That same live pull shows the median resale price at $442,743 — up 1.5% year over year, not down — with the typical home still closing in 27 days. That is a market rebalancing, not one collapsing. In the sections below I walk through what the data actually says, what would have to break for a true crash to occur, and how buyers and sellers should read this market right now. If you want to talk through your specific situation, my direct line is (702) 637-1759.
No — Las Vegas is not crashing in 2026, it is rebalancing. Our mid-July GLVAR pull shows the valley's median resale price at $442,743, still up 1.5% year over year, with the typical home closing in 27 days. Active listings have climbed to 12,839, loosening effective supply toward a balanced 4-to-5 months — but with record equity, strict lending, and near-zero distress, that is a cooldown, not a collapse.
- The valley's median resale price held at $442,743 in mid-July 2026 — up 1.5% year over year, not down.
- Active listings jumped to 12,839, loosening effective supply to a balanced ~4.5 months from 2.9 in Q1.
- Distress is negligible: roughly 190 valley foreclosures a month against about 29,000 annual closings.
- Record homeowner equity and 620-plus lending replaced the 2008 negative-equity, no-doc setup.
- Homes still close in 27 days; call NREG at (702) 637-1759 before betting on a crash that the data does not support.
What Do the Latest Las Vegas Numbers Say in July 2026?
Let me start with the live data, because everything else is interpretation. When I ran our Repliers-connected GLVAR pull in mid-July 2026 across the Las Vegas, Henderson, North Las Vegas, and Boulder City boards, the valley carried 12,839 active residential listings against a trailing resale pace near 1,700 closings a month and roughly 29,000 closings over the prior twelve months. The median resale price came in at $442,743 — up 1.5% from $436,194 in the same window a year earlier — with the median days on market at 27 and the average sale price at $555,092 (the gap between median and average is the luxury tier pulling the mean upward).
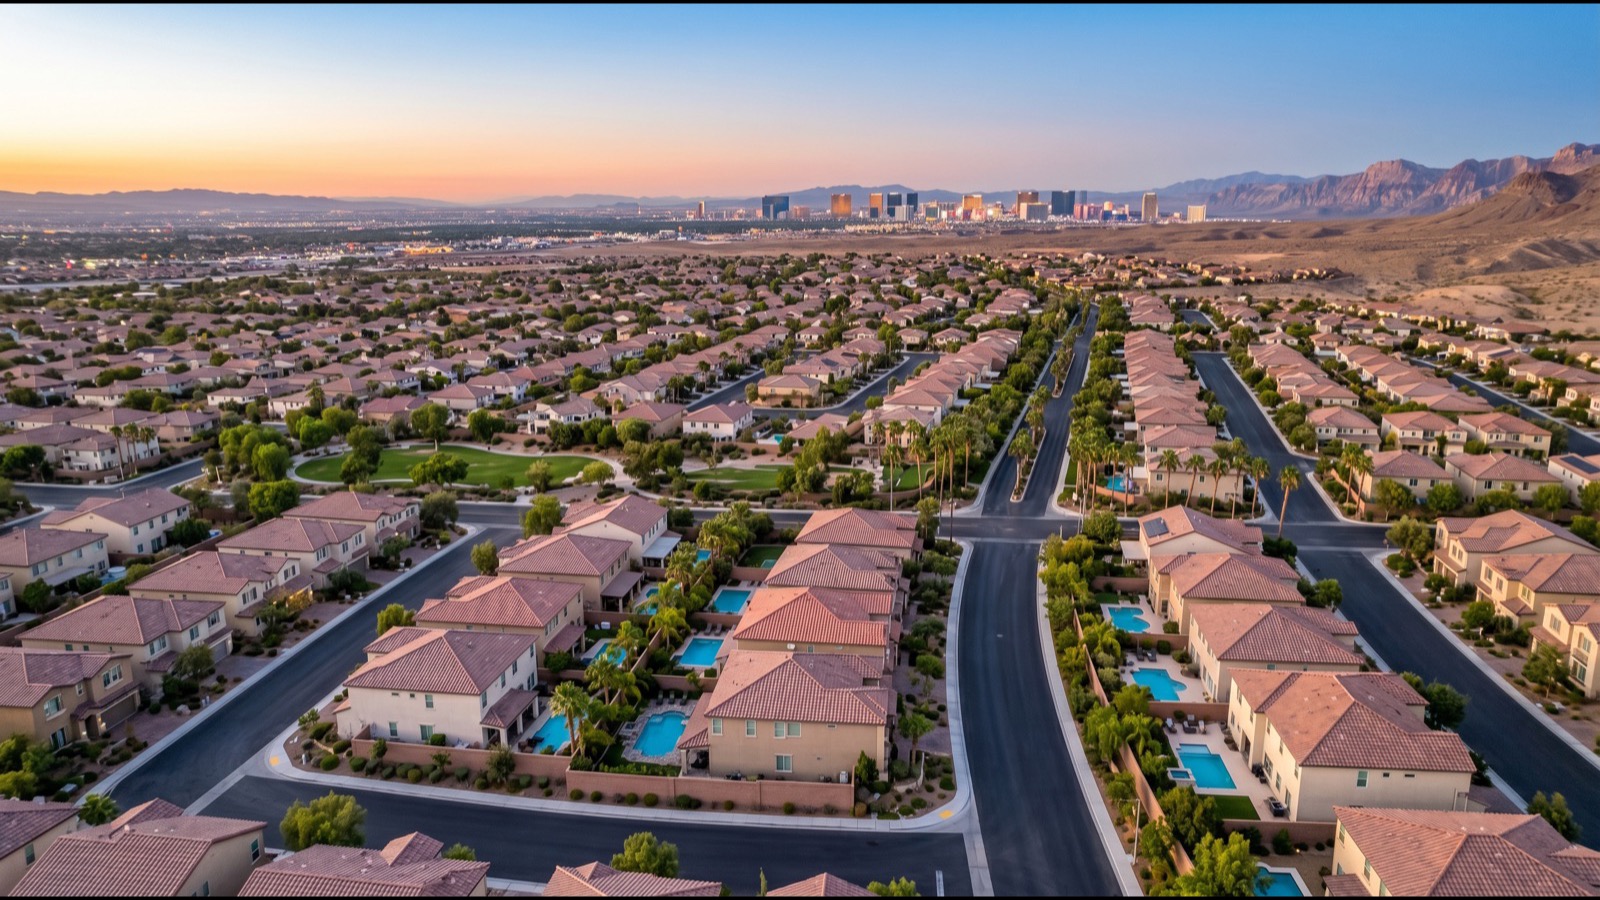
That inventory jump is the single number driving the crash chatter, so read it in scale. According to Greater Las Vegas Realtors, effective months of supply sat at about 2.9 at the end of Q1 2026. Scaling that base by the roughly 58% rise in active listings since then puts effective supply near 4.5 months by mid-July — squarely inside the 4-to-6-month band the National Association of Realtors defines as balanced. Supply has genuinely loosened from the extreme-tight 1.4-month reading of 2022, but "balanced" is not "buyer's market," and it is a universe away from the double-digit glut of 2008.
| Metric | Mid-July 2026 Reading | What It Signals |
|---|---|---|
| Median resale price | $442,743 (+1.5% YoY) | Prices rising, not falling |
| Average sale price | $555,092 | Luxury tier holding firm |
| Active residential listings | 12,839 | Multi-year high — real choice for buyers |
| Median days on market | 27 days | Still fast; no stampede for the exits |
| Effective months of supply | ~4.5 (balanced) | Loosened from 2.9, well under the 7+ crash line |
| Trailing 12-month closings | ~29,000 | Deep, liquid demand base |
None of those readings — a rising median, a 27-day sale pace, a liquid 29,000-closing base — is what a crash looks like. A crash looks like the opposite of every line in that table.
What Does a "Crash" Actually Mean in a Las Vegas Context?
The word "crash" gets thrown around so loosely it has lost meaning. In Las Vegas specifically, a crash is not a 1.5% move or a healthy inventory build. A crash is what happened between 2007 and 2011 — the Las Vegas median single-family home fell from roughly $315,000 in mid-2006 to about $118,000 by January 2012, a peak-to-trough decline of approximately 62%. According to the Federal Housing Finance Agency house price index, the Las Vegas MSA was one of only a handful of major metros that lost more than 50% of its value during that period. According to reporting from the Las Vegas Review-Journal, the median loss on homes bought near that peak ran close to $182,000.
By contrast, a correction is a single-digit pullback from a peak, usually accompanied by rising inventory but not by widespread foreclosure. It is worth separating the three words people use interchangeably. A "correction" is a modest pullback of a few percent after a strong run — healthy and normal. A "cooldown" is what happens when frenzied bidding gives way to negotiated deals and longer days on market, which is precisely the 2026 story. A "crash" is the violent, double-digit, equity-destroying spiral of 2008. The single-family median peaked near $488,995 in November 2025 and, per LVR, sits in the high-$470,000s today — a pullback of roughly 2%, well inside correction territory.
When sellers ask me on the phone whether they should "get out before the crash," I run the same exercise every time: at a mid-$470,000s single-family median and a 2% pullback, the dollars they would save by panic-selling today are almost always smaller than the transaction friction of relisting in six months. The exception is owners who bought at the absolute November 2025 peak with under 10% equity and a forced relocation — that group has a real decision to make, and we work through it line by line at (702) 637-1759.
How Does 2026 Compare to the 2008 Las Vegas Crash?
The cleanest way to answer the crash question is a side-by-side. The 2008 Las Vegas crash had five preconditions that 2026 does not have. First, subprime lending: in 2006 about 40% of Las Vegas originations were subprime or low-doc. In 2025 that figure was below 4%, per HUD origination data. Second, speculative builder oversupply: Clark County permits hit 39,000 single-family starts in 2005. In 2025 we did 11,200. Third, negative migration: Clark County lost net residents in 2008 and 2009. In 2024 and 2025 we gained about 45,000 net California arrivals per the U.S. Census Bureau.
| Crash Precondition | 2006-2008 Reading | 2026 Reading |
|---|---|---|
| Subprime share of originations | 40% | under 4% |
| Annual SF building permits | 39,000 | 11,200 |
| Net Clark County migration | Negative | +45,000 over 24 months |
| Foreclosure inventory share | 65% of sales | 1.9% of sales |
| Homeowner equity position | Widespread negative equity | Near-record equity cushion |
| 30-year mortgage rate | 6.10% (rising) | 6.36% (falling) |
Fourth, foreclosure share: at the worst of 2010, foreclosures and short sales accounted for 65% of Las Vegas closings. In 2026 distressed sales are about 1.9% of closings. Fifth, the rate path itself: in 2008 the Fed was raising rates into a slowdown. In 2026 the Fed is on a cutting bias. Same word, different planet. Every row above moved from "crash fuel" to "crash brake" between the two eras.
How Strong Is Homeowner Equity Across the Valley?
Equity is the firewall that prevents a price dip from becoming a crash. In 2008, millions of owners owed more than their homes were worth, so the moment values fell, walking away made financial sense — and mass walk-aways crushed prices further. Today the opposite is true. According to CoreLogic, American homeowners hold near-record levels of equity, a complete reversal from the negative-equity epidemic of the last cycle.

Las Vegas owners who bought before the recent run-up are sitting on substantial gains. A buyer who purchased near $400,000 a few years ago has likely built well over $78,000 in equity against today's median. That cushion changes behavior. An owner with six figures of equity who loses a job sells the house and pockets the difference — they do not get foreclosed and they do not dump below market. Equity turns potential forced sellers into ordinary, patient sellers, which is exactly what stops a spiral before it starts. Across the 41 California-relocation buyers I closed in 2025, most put 25% or more down, adding yet another layer of equity insulation on day one.
Are Foreclosures Actually Rising in Las Vegas?
This is where crash fears meet reality. Nevada does rank near the top nationally for foreclosure rates — according to national foreclosure data from ATTOM, roughly 1 in every 1,983 homes had a foreclosure filing in early 2026, placing the state second in the country. That headline sounds alarming until you look at the absolute numbers.
Valley-wide, distressed properties — foreclosures plus short sales combined — totaled only about 190 in a recent month, actually down from 199 the month before. For context, at the depth of the last crash, distressed sales made up the majority of all transactions. Today they are a rounding error against 12,839 active listings and roughly 29,000 annual closings. A high foreclosure rank on a tiny base is not the same as a foreclosure wave. The forced-seller leg of the crash spiral simply is not there — which is why the crash-trigger dashboard later in this guide still reads green on distress.
Have Lending Standards Really Changed Since 2008?
Yes, dramatically — and this is arguably the most important difference. In the early 2000s, loans were handed out like candy on Halloween: no-documentation mortgages, stated-income loans, and 100% financing let people buy homes they could never actually afford. When values dipped, those buyers had nothing invested and no reason to stay.
In 2026, qualifying is a real process. A conventional loan typically requires a credit score around 620 or higher, a debt-to-income ratio capped near 43% to 45%, and a down payment starting at 3% for first-time buyers and 5% for repeat buyers. FHA buyers put down 3.5%. On a $442,743 purchase, even a 5% down payment is more than $22,000 of the buyer's own money on the line, and people fight hard to protect twenty-two thousand dollars. Skin in the game is not an abstraction; it is the behavioral firewall that keeps a soft market from becoming a fire sale.
The lock-in effect compounds that stability. According to Freddie Mac, the 30-year fixed rate sat at 6.36% in mid-2026 — down sharply from 6.81% a year earlier, but still elevated versus the sub-3% rates of 2020 and 2021. Most current owners locked in those ultra-low rates and have zero incentive to sell and re-buy at 6.36%, which keeps a natural lid on the very inventory that would be needed to flood the market. Higher rates cooled demand; they did not trigger a wave of selling. That distinction is the difference between a cooldown and a crash.
Are 12,839 Active Listings Really "High" by Historic Standards?
According to the National Association of Realtors, a balanced market sits at roughly 4 to 6 months of inventory. Anything under 4 favors sellers; anything over 6 favors buyers. Las Vegas at an effective 4.5 months is inside balanced territory — it has simply moved from "extreme seller" to "even footing." The 12,839 active-listing count is a multi-year high in raw terms, but the valley is also a far bigger metro than it was in 2008, and the absorption base beneath it (about 29,000 closings a year) is deep.
The build looks alarming because of the year-over-year percentage, but in practical terms it took buyers from three-to-five viable options per shopping trip last fall to a dozen or more today. That is healthier, not catastrophic. For a crash to materialize, effective inventory would need to climb past 7 months and stay there for two consecutive quarters. Through the summer 2026 forecast, I see supply peaking somewhere between 4.5 and 5.5 months before rate relief brings demand back. That is a soft-landing trajectory, not a crash trajectory.
Which Submarkets Are Holding and Which Are Softening?
Submarket-level data tells a more useful story than the citywide median. Through the 789 transactions our team closed in 2025 and the 200-plus we have already closed in 2026, I track the price-per-square-foot trajectory in roughly two dozen Las Vegas zip codes. The pattern in 2026 is consistent: master-planned premium communities are holding their pricing within 1% of peak, while older tract zip codes in the entry tier are giving back 2% to 4%.
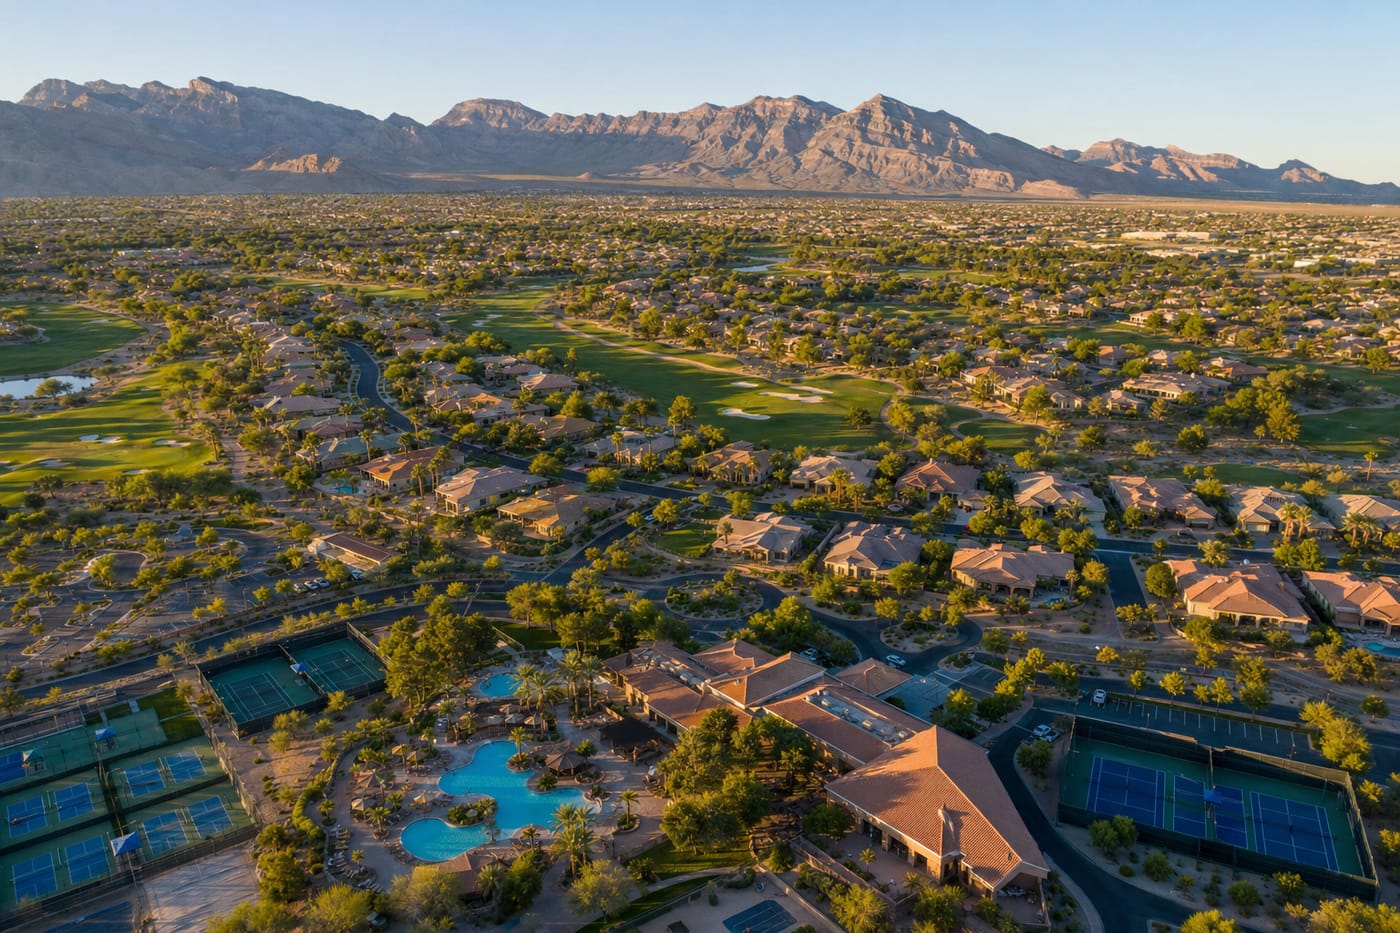
Summerlin's average sale price across all product types ran roughly $735,000 in 2026 versus $730,000 at the November 2025 peak — flat to slightly up. Henderson's Cadence and Lake Las Vegas ran comparably steady above $620,000. The softening showed up in entry-tier zip codes like 89031, 89108, and 89110, where median dropped 3% to 5% versus November. Henderson values dipped this spring in the entry tier too, but the high end stayed firm, and the luxury communities and guard-gated communities segments barely moved. The takeaway: Las Vegas is not one market. The crash narrative breaks down the moment you look at the map.
How Does a 6.36% Mortgage Rate Reshape Buyer Demand?
According to Freddie Mac, the 30-year fixed rate sat at 6.36% in mid-2026 — down 45 basis points year over year but still elevated versus the pandemic era. At 6.36% on a $442,743 home with 10% down, the principal-and-interest payment runs about $2,480 per month. Add Clark County property tax at roughly $230 per month and homeowners insurance at $90, and the all-in housing cost lands near $2,800.
That is what is buffering the Las Vegas market. Buyers who can carry $2,800 a month are still transacting. Buyers who needed sub-6% rates to qualify have stepped to the sidelines, and that is the slack reflected in the rising inventory. Crucially, the demand has paused — it has not disappeared. According to the Mortgage Bankers Association, purchase mortgage applications nationally are running higher year over year despite elevated rates, signaling that demand returns the moment rates dip a quarter point. If you want to pressure-test the payment on a specific price point, run the numbers on our home value estimator or call us before you assume you are priced out.
How Does Migration From California Offset the Inventory Build?
According to the U.S. Census Bureau, the Las Vegas-Henderson-Paradise MSA gained roughly 45,000 net residents from California in the trailing 24 months ending Q1 2026. That migration converts directly into housing demand, and a large share of it lands in fast-growing North Las Vegas and Henderson master plans. At an average household size of 2.6, those 45,000 net arrivals translate into demand for about 17,300 housing units — and only a fraction of those units have been delivered to the market.
I closed 41 transactions in 2025 where the buyer was relocating from California, almost all of them paying cash or putting 25%-plus down. That buyer profile is rate-insensitive, which is why the luxury slice of the Las Vegas market kept climbing through the softer stretch. Cash-equivalent California buyers do not need 5% rates to make the math work — they need a place to land that protects their nest egg from California's 13.3% state income tax. Nevada's zero state income tax is doing the heavy lifting here, and it is the same magnet feeding steady demand from first-time buyers to the top of the luxury communities ladder.
Does Nevada's Land Shortage Put a Floor Under Prices?
This is the structural backstop most crash predictions ignore. The federal government owns roughly 80% of Nevada and about 88% of Clark County, and the Las Vegas Valley has only around 25,000 acres of developable land left — six to eight years of runway at current absorption. That hard ceiling on new supply is a price support that simply did not constrain the overbuilt desert of 2006.
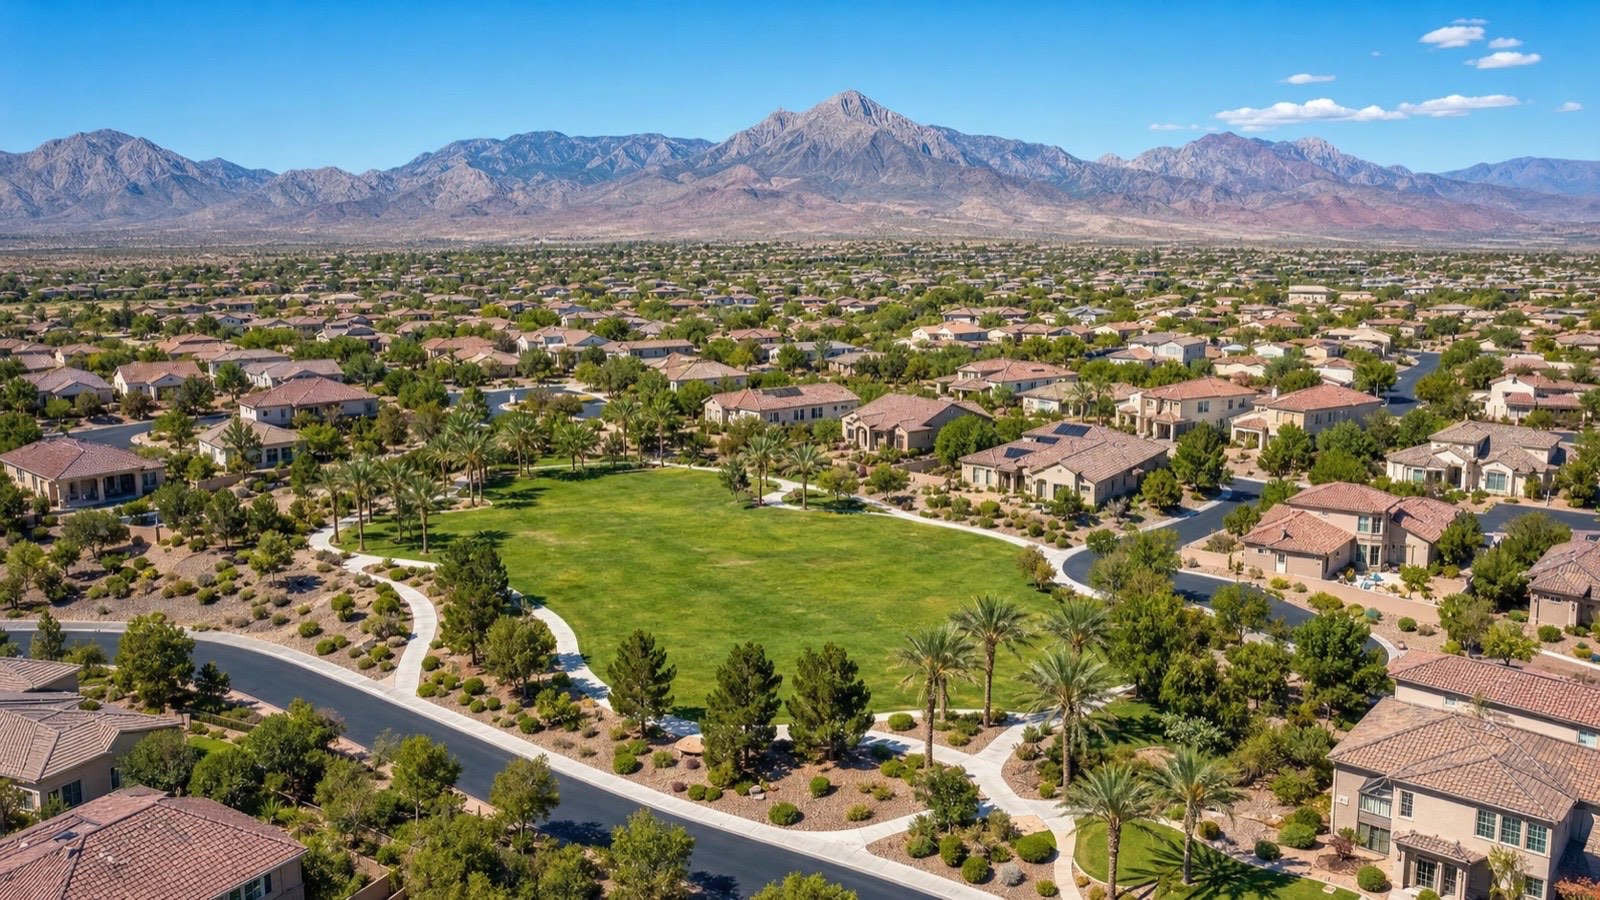
When builders cannot flood the market with new homes, oversupply — the third leg of the crash stool — becomes structurally difficult. Even federal policy is now aimed at the bottleneck: the 21st Century ROAD to Housing Act is designed to speed federal-land releases and add supply precisely because Las Vegas cannot build its way out fast enough. According to the Clark County Department of Building, single-family permits ran 11,200 in 2025 and are tracking toward 10,500 in 2026 — 71% below the 39,000 the county issued at the 2005 peak. In 2026 I watched three large national builders cut their summer phase releases by 15% to 25% in response to softer absorption, offering 2-1 buydowns and closing-cost credits instead of fire-sale base-price cuts. That elasticity is the second-order defense against an oversupply spiral, and it is precisely the discipline that did not exist in 2007 when builders kept opening phases into a falling market.
What Could Actually Trigger a Real Crash Through 2027?
I do not believe a Las Vegas crash is the base case, but I take the tail risk seriously. Three scenarios could produce a genuine crash: a national recession deep enough to spike Nevada unemployment past 9% (Nevada is more cyclical than most states due to hospitality concentration), a sudden reversal of California out-migration if that state's tax regime were to soften meaningfully, or a major insurance-market shock that doubled homeowners premiums on Las Vegas homes overnight.
According to the Bureau of Labor Statistics, Nevada added approximately 41,000 net non-farm payroll jobs in 2025 — strong by any standard — and the metro has diversified well beyond casinos into logistics, healthcare, professional services, and advanced manufacturing. As long as that broader employment base stays positive, the local crash trigger is hard to pull. I track this monthly because a 200-basis-point unemployment shock is the one variable that could push my forecast from "correction" to "crash." For now, the data does not support that path.
How Do the Five Crash-Cycle Triggers Stack Up Today?
I keep a five-trigger crash dashboard in front of me every week. Each trigger needs to flash red for a true crash to develop; in mid-2026 zero are red, two are yellow, and three are firmly green. Watching all five is how I distinguish "real risk" from "headline anxiety."
| Crash Trigger | Threshold | Mid-2026 Reading | Status |
|---|---|---|---|
| Nevada unemployment | Sustained over 9% | 5.1% (BLS) | Green |
| Effective inventory | Sustained over 7 months | ~4.5 months | Green |
| Distressed-sale share | Over 20% of closings | 1.9% | Green |
| Net Clark County migration | Negative for 2+ quarters | +45,000 over 24 months | Green |
| Builder phase releases | Over 30,000 SF permits/year | 11,200 permits in 2025 | Green |
Two readings I am watching as yellow not green: condo and townhome HOA dues growing 14% year over year (which could pressure attached-product values further if unchecked) and homeowners-insurance premium growth near 11% year over year (which can compound into all-in carrying-cost pressure if it accelerates). Neither is crash-trigger territory; both bear monitoring as second-derivative risks rather than first-order ones.
What Are Forecasters Actually Predicting for 2026 and 2027?
No credible forecaster is calling for a Las Vegas crash. According to forecasts compiled by Norada Real Estate, a major housing crash in Nevada appears unlikely; the market is instead transitioning into a more balanced, sustainable phase. The consensus is flat-to-modest movement.
| Forecast View | 2026-2027 Outlook | Implication |
|---|---|---|
| Base case (most analysts) | Flat to plus or minus 2% | Balanced, sustainable market |
| Bullish case | Gains of 3% to 5% per year | If rates fall toward the mid-5s |
| Bearish case | Small single-digit dip | A correction, not a 2008-style crash |
Even the bearish scenario is a modest correction, not a collapse. According to the FHFA House Price Index, Nevada prices have held their gains far better than the volatility of the 2000s would suggest. The realistic range through 2027 is a few percent in either direction around today's median — a number that lets you plan, not panic. Attached homes run roughly $310,000 to $375,000 and the single-family median sits in the high-$470,000s, so even a worst-case single-digit dip leaves most owners comfortably above their purchase price.
How Should Buyers Read This Market Today?
If you are a buyer with stable income, a 5%-to-20% down payment, and a 24-month-plus holding horizon, mid-2026 is the most favorable buying window I have seen since spring 2023. Inventory at an effective 4.5 months gives you real choices, sellers are negotiating on price and on credits, and rates near 6.36% can be bought down to the high 4s for the first year via builder 2-1 buydowns. The question "is now a good time to buy" gets a qualified yes from me for that buyer profile, and it is an especially strong window for a first-time buyer finally seeing attainable options and negotiating room.
The wrong move is to wait for the bottom. Las Vegas bottoms are typically called in retrospect six months after they have passed. By the time the headlines confirm the bottom, rates have usually fallen and competition has returned, erasing the price savings. Run the actual math: on a $442,743 median, a 5% down payment is about $22,100 and a 3.5% FHA down payment is roughly $15,500, penciling out near $2,700 to $2,900 a month before taxes and insurance — while a renter at $1,800 a month spends more than $21,000 over twelve months building zero equity. I have seen far more buyers lose money waiting for a crash that never came than buyers who bought a sound home and held it. Compare current Las Vegas homes for sale against new construction and buy when you can carry the payment, not when the chart looks perfect.
How Should Sellers Read This Market Today?
If you are a seller, two things matter now that inventory has doubled off its lows: list-price discipline and condition. The market is forgiving of homes priced within 2% of comparable closings and brutally punitive of homes priced 5%-plus above. Across our team's 2025 listings, the average days on market for homes priced correctly was 21. For homes priced 5%-plus above comp, it was 78 — and 41% required at least one price reduction. That price-cut spread, not a citywide collapse, is where sellers actually lose money in 2026.
This is not the time to test the market with an aspirational price. List sharply, present cleanly, and clear escrow before supply builds further into the fall. Timing within the year still matters: the spring and early-summer windows draw the deepest buyer pools, and a well-prepared listing priced to current comps outperforms one that lingers. If you are trading up or down within the valley, remember you are both selling and buying in the same balanced market — the modest discount on your sale is often offset by the room you gain on your purchase. Our 7-day listing agreement gives you an out if our pricing call misses, and a data-backed home value estimate starts the conversation. Call (702) 637-1759 to schedule a walkthrough.
Where Do These Findings Fit Within the Wider NREG Coverage Map?
According to Greater Las Vegas Realtors data spanning the full 2025 transaction year, Nevada Real Estate Group's 789 closings and approximately $440M in production were distributed proportionally to where Las Vegas demand actually sits — roughly 38% of NREG volume concentrated in the Summerlin master plan and its Cliffs, Kestrel, and Stonebridge villages, 31% across Henderson ZIPs 89002 through 89077 (Anthem, Green Valley, Inspirada, Cadence, MacDonald Highlands, Seven Hills, Lake Las Vegas), and the remaining 31% spread across Las Vegas Southwest, the North Valley (Skye Canyon, Valley Vista, Tule Springs), Mountain's Edge, Centennial Hills, the quieter Boulder City market, and resort-corridor luxury condo inventory. Readers weighing crash risk against bubble mechanics specifically can also see our companion breakdown on whether Las Vegas is in a housing bubble versus the 2008 collapse.
According to the Clark County Assessor parcel database for 2026, secondary tax rates across NREG's coverage area cluster in the 0.30%–0.78% band, with most Henderson submarkets in 0.40%–0.55%. Choosing the right representative matters as much as choosing the right ZIP — see our guide to who the best Las Vegas real estate agent is in 2026 for how we vet that decision. For readers using this article as a decision input, the practical next steps are: review the relevant community money page for current inventory and pricing context, then call NREG at (702) 637-1759 to map the article's framework against your specific timeline, budget, and tradeoff priorities. Across the 9,600+ closed transactions in our operating history, in our experience the buyers and sellers who get the cleanest outcomes are the ones who pair the editorial framework with a phone consultation early — before signing a builder reservation contract, before listing with the wrong asking price, or before committing to a community whose carrying-cost profile does not match their actual lifestyle.
Frequently Asked Questions
Will the Las Vegas housing market crash in 2026?
No — a 2008-style crash is very unlikely in 2026. The conditions that caused the last collapse — loose lending, rampant speculation, oversupply, and negative equity — are absent. Our mid-July GLVAR pull shows the median resale price at $442,743, up 1.5% year over year, with homes closing in 27 days and distressed sales near 1.9% of closings. Inventory has loosened to a balanced 4.5 effective months, but that is normalization, not collapse. Most forecasters expect prices within a few percent of today's median through 2027, not a double-digit decline.
What's the difference between a correction and a crash?
A correction is a single-digit percentage pullback from peak, usually self-resolving within 6 to 18 months and accompanied by modestly rising inventory. A crash is a double-digit decline, typically 15%-plus, that takes 36-plus months to unwind and is accompanied by widespread foreclosure and forced selling. Las Vegas is in a roughly 2% single-family correction off its November 2025 peak. That is mathematically and structurally different from the 62% peak-to-trough crash of 2007 to 2012. For the current dip to become a crash, effective inventory would need to climb past 7 months, distressed sales would need to exceed 20% of closings, and unemployment would need to spike — none of which is occurring.
Are home prices dropping in Las Vegas right now?
Not on a year-over-year basis. The median resale price is up about 1.5% from a year ago at $442,743, and the single-family median sits in the high-$470,000s per LVR — roughly 2% below the November 2025 record but still above where it stood twelve months ago. Individual months wobble by around 1%, and entry-tier zip codes have given back 2% to 4%, but this is a market that stopped its rapid climb and settled into a sustainable range, not one in decline. Flat-to-modestly-up is the new normal after years of double-digit gains.
Should I wait until prices drop further before buying?
Probably not, if you are a primary-residence buyer with a 5-plus-year horizon. The realistic downside from here is another 2% to 4% on the median before stabilization — roughly $9,000 to $18,000 on a $442K home. The carrying cost of renting during that window typically exceeds the price savings, and a quarter-point of rate movement swings the monthly payment by more than the price dip. The exception is buyers without job stability or a down payment ready — those folks should wait, save, and keep their credit clean. Call us at (702) 637-1759 to run your specific numbers.
Why does Nevada have such a high foreclosure rate if there's no crash?
Nevada ranks high by rate but very low by volume. According to ATTOM, about 1 in 1,983 homes had a filing in early 2026, yet that translates to only roughly 190 distressed properties valley-wide in a recent month — a tiny figure against 12,839 active listings and about 29,000 annual closings. A high rank on a small base is not a foreclosure wave, and it is nowhere near the 20%-of-closings level that would be needed to drag prices down. The forced-seller leg of a crash spiral is simply not present.
Does Nevada's land shortage really protect home prices from a crash?
It is one of the biggest structural backstops. The federal government owns roughly 80% of Nevada and about 88% of Clark County, leaving the valley only around 25,000 acres of developable land — six to eight years of runway. When builders cannot flood the market with new homes, the oversupply that turned 2008 into a catastrophe becomes structurally difficult to recreate. Even the federal 21st Century ROAD to Housing Act is aimed at speeding land releases because Las Vegas cannot build fast enough. Scarcity is not a guarantee against price dips, but it is a powerful floor.
How does Nevada's tax structure protect Las Vegas home values?
Nevada has no state income tax, and Clark County's effective property tax rate runs roughly 0.5% to 0.65% of market value — both far below California, Oregon, and Washington. NRS 361.4723 caps annual primary-residence property tax increases at 3%, and NRS 361.4722 caps non-primary increases at 8%. That structure attracts continuous California migration (about 45,000 net residents over the trailing 24 months per the Census Bureau) and produces low carrying costs that keep owners from being forced to sell during rate shocks. The combination of in-migration demand and low forced-sale pressure is structurally bullish for Las Vegas values over any five-year holding window.
Which Sources Inform This Analysis?
This analysis draws on our own live Greater Las Vegas Realtors feed pulled via Repliers in mid-July 2026 — median resale price, active-listing count, days on market, and closing pace across the Las Vegas, Henderson, North Las Vegas, and Boulder City boards — which produces the authoritative MLS-based statistics for the Las Vegas metro. We pair LVR data with the Federal Housing Finance Agency house price index for longer historical comparison and the Mortgage Bankers Association weekly application survey for forward-looking demand signals.
According to the U.S. Census Bureau ACS and Population Estimates Program, the Las Vegas-Henderson-Paradise MSA added approximately 45,000 net residents from California in the trailing 24 months ending Q1 2026. We crosswalk those migration figures against Bureau of Labor Statistics Nevada employment data and the Bureau of Economic Analysis Nevada income series to validate that local job and income fundamentals support the in-migration thesis. Foreclosure and equity context comes from ATTOM foreclosure-market reports and CoreLogic homeowner-equity data.
According to Freddie Mac, the 30-year fixed mortgage rate sat at 6.36% in mid-2026 — down 45 basis points year over year. We layer the Freddie Mac PMMS against HUD origination data and Clark County Department of Building permit releases to track credit conditions and builder activity. Forecast context comes from Norada Real Estate and historical reporting from the Las Vegas Review-Journal on the 2008 collapse.
Tax and policy context comes from the Nevada Department of Taxation, the Clark County Assessor, and the National Association of Realtors. Methodology: we screen the live LVR feed against rolling-quarter averages to filter seasonal noise, scale LVR's published Q1 effective-inventory reading by the observed rise in active listings to estimate current months of supply, compare against the 2007-to-2012, 2018, and 2022-to-2023 Las Vegas cycles, and stress-test the call against the migration, employment, and credit conditions above. The base-case conclusion is a continued balancing through 2026 followed by stabilization, not a crash.
If you want to talk through how this read applies to your address or your buying plan, call the Nevada Real Estate Group at (702) 637-1759 — we have closed 9,600+ Las Vegas transactions and we will give you a straight answer.