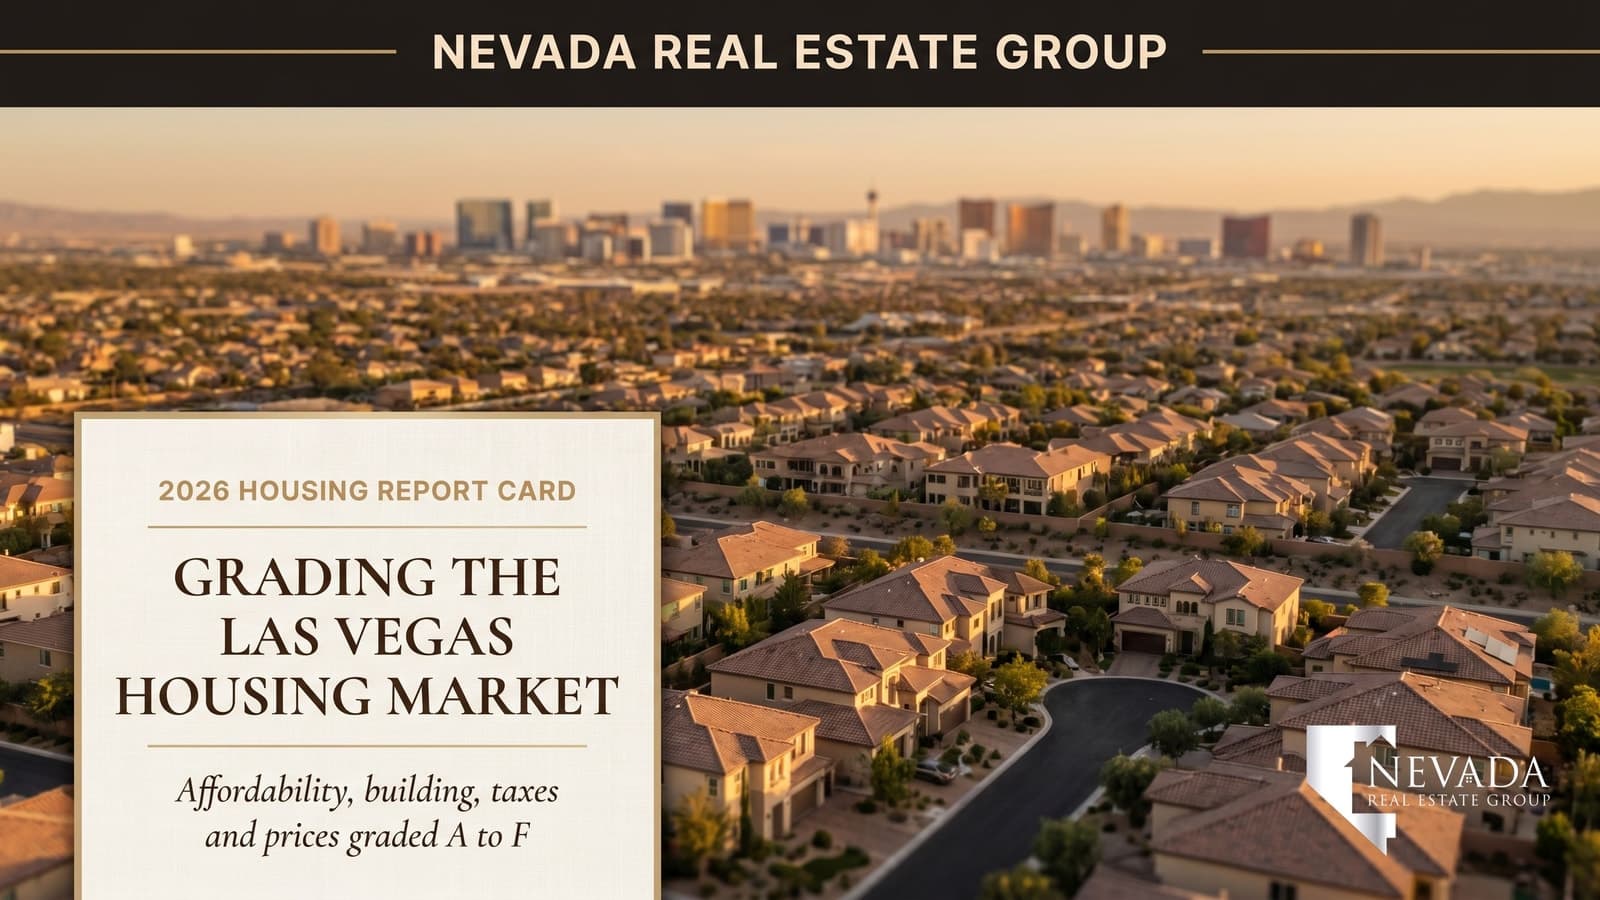

When Realtor.com published its 2026 State Report Cards in June, Nevada walked away with a C- and a total score of 45.7 out of 100 — a middling mark that lumped Las Vegas, Reno, and every rural county into one statewide grade. That is useful for a national headline, but it is the wrong altitude for anyone actually buying or selling a home in the Las Vegas valley this year.
So I rebuilt the report card at the metro level. Using the same two pillars Realtor.com weights most heavily — housing affordability and homebuilding — plus six more metrics that decide real outcomes for Clark County buyers and sellers, here is how Las Vegas actually scores in 2026, graded A to F with the local numbers behind every mark.
Las Vegas earns an overall C+ on our 2026 housing report card — a notch above Nevada's statewide C- from Realtor.com. The median price sits near $472,000, so affordability grades a weak C-. But the valley pulls its GPA up with strong marks for new construction (B), property taxes (A — no state income tax, a 0.5% effective rate), and jobs (B). Affordability is the drag; supply and taxes are the lift.
- Overall grade: C+ — Las Vegas beats Nevada's statewide C- on homebuilding, taxes, and jobs.
- Affordability earns a C-: a $472,000 median against roughly $72,000 income eats about 38% of gross pay.
- Homebuilding scores a B: Nevada issues 1.4% of U.S. permits on just 1.0% of population.
- Property taxes earn the only A: no state income tax, a 0.5% effective rate.
- Inventory at 2.6 months and a 36-day pace give buyers their best leverage since 2022.
What Grade Does the Las Vegas Housing Market Earn in 2026?
The headline number is a C+. That is a deliberate, weighted blend of eight metrics rather than a gut feeling, and it lands one full step above the C- that Realtor.com assigned Nevada as a whole. According to Realtor.com research, Nevada's 45.7 score reflected a state caught between weak affordability and merely average homebuilding. Las Vegas, the engine that drives roughly three-quarters of Nevada's population and home sales, scores higher because its construction pipeline, tax structure, and job base are stronger than the rural counties dragging the statewide average down.
Here is the full report card. I assigned each grade from the underlying data sources cited throughout this guide, then weighted affordability and homebuilding most heavily — exactly as Realtor.com does — while folding in the local metrics that matter on the ground.
| Metric | Grade | What drives the mark |
|---|---|---|
| Affordability | C- | $472,000 median vs about $72,000 income; about 38% of gross pay to the mortgage |
| Homebuilding | B | Nevada permits 1.4% of U.S. homes on 1.0% of population |
| Price growth | B | Appreciation cooled to a sustainable low-single-digit pace |
| Inventory | C+ | 2.6 months of supply — improving, still under balanced |
| Market pace | B- | 36 days on market — healthy, not frenzied |
| Property taxes | A | No state income tax; about 0.5% effective property-tax rate |
| Job market | B | Diversifying beyond tourism into sports, logistics, and tech |
| Investor returns | B- | Solid rents near $1,650 median, but cash flow tightened |
A C+ is not a complaint — it is an honest "solid, with one weak subject." The valley does most things well and one thing poorly. If you want to see how the live numbers behind these grades move month to month, our Las Vegas market report tracks the medians, inventory, and days-on-market that feed this scorecard. For homes available right now against these conditions, start a home search or reach the team through our contact page.
How Did We Grade the Las Vegas Market?
The methodology borrows directly from Realtor.com's national framework and then adds local depth. According to Realtor.com research, the national report cards rest on two equally weighted pillars. The first is affordability, measured through the REALTORS Affordability Score (a 0-to-2 index of how many listings a median earner can actually buy) and the share of median household income a median-priced home consumes. The second is homebuilding, measured by the permit-to-population ratio and the new-construction premium — the price gap between a brand-new home and an existing one.
Those two pillars carry the most weight here too, because they are the structural forces that decide whether prices stay reachable. But a buyer in Summerlin or a seller in Henderson also lives with inventory, days on market, property taxes, job security, and rent dynamics. So I added six metrics, scored each from authoritative local data, and converted everything to a familiar A-to-F scale. According to the U.S. Census Bureau, the Las Vegas metro's demographic and income baselines anchor the affordability math, while Las Vegas REALTORS supplies the monthly price, inventory, and pace data that drives the rest.
| Score band | Letter | Plain-language meaning |
|---|---|---|
| 90 to 100 | A | Best-in-class; a genuine competitive advantage for the metro |
| 80 to 89 | B | Strong; clearly above the national middle |
| 70 to 79 | C | Average; neither a draw nor a deterrent |
| 60 to 69 | D | Weak; a real friction point for buyers or sellers |
| Under 60 | F | Failing; a structural problem with no near-term fix |
One note on honesty: a metro-level grade is sharper than a state grade but still an average. Buying a $1.2 million estate in The Ridges and a $360,000 starter condo in the northwest are two different report cards. I flag where the valley splits later in this guide.
How Affordable Is Las Vegas Real Estate in 2026?
Grade: C-. This is the valley's weakest subject and the single biggest reason the overall mark is not a B. According to Realtor.com research, Nevada's median listing price reached $492,789 against a median household income of just $71,942, producing a REALTORS Affordability Score of 0.49 — well under the 1.0 line that signals a balanced market for middle earners. A score below 0.5 means a typical household can comfortably afford fewer than half the listings weighted to its income.
The Las Vegas metro tells a slightly gentler version of the same story. With a median sale price near $472,000 and the area's median household income hovering around $72,000, a buyer putting 10% down on a 30-year loan at prevailing rates faces a principal-and-interest payment that eats roughly 38% of gross monthly income before taxes and insurance. According to the U.S. Department of Housing and Urban Development, anything above 30% of income on housing is the federal definition of cost-burdened — and on the median math, the typical Las Vegas buyer is squarely there.
| Input | Figure |
|---|---|
| Median sale price (metro) | $472,000 |
| Median household income | about $72,000 |
| 10% down payment | $47,200 |
| Estimated annual income to qualify | about $125,000 |
| Income gap for the median household | roughly $53,000 |
There are real offsets that keep the grade a C- rather than a D. Nevada levies no state income tax, so a $72,000 salary stretches further here than the same salary in California or New York. And builders have responded: according to reporting on the local market, Las Vegas homebuilders spent early 2026 shrinking floor plans and trimming base prices, with some entry products dropping back under $400,000. If you want the deeper decision framework, our guide on whether 2026 is a good time to buy in Las Vegas walks through the rate-versus-price tradeoff in detail. First-time buyers should also study North Las Vegas, where median prices near $430,000 keep the entry door open.
Is Las Vegas Building Enough New Homes to Meet Demand?
Grade: B. This is where Las Vegas earns back the points affordability costs it. According to Realtor.com research, Nevada issued 1.4% of all U.S. housing permits while holding only about 1.0% of the national population — meaning the state builds at roughly 1.4 times its demographic share. Almost all of that production happens in the Las Vegas valley, where master-planned communities still have land to grow.
That is a genuinely strong number. According to the National Association of Home Builders, most large metros build well below their population share, which is precisely why national affordability has deteriorated. Las Vegas is one of the few major Western markets where the construction pipeline is keeping partial pace with demand. According to the U.S. Census Bureau building-permits survey, Clark County remains among the more permissive large counties for new residential approvals.

The second half of the homebuilding grade is the new-construction premium — how much more a brand-new home costs than a comparable resale. Nationally that gap has historically run 15% to 20%. In Las Vegas through 2026 it narrowed sharply: builders deployed rate buydowns, closing-cost credits, and design-center incentives worth $15,000 to $40,000 to keep contracts moving, which compressed the effective premium and, in some submarkets, erased it. Our breakdown of the 2-1 buydown on Las Vegas new construction shows exactly how those incentives cut the first two years of payments. That is a buyer's-market signal hiding inside a supply statistic. Explore the full pipeline on our new construction hub, and note that the valley's biggest builders concentrate in Summerlin and the southwest.
How Fast Are Las Vegas Home Prices Growing?
Grade: B. A B here is a compliment, because the goal in 2026 is not fast appreciation — it is durable appreciation. After the whipsaw of 2021's roughly 25% surge and 2023's correction, Las Vegas prices have settled into a low-single-digit annual pace. The median moved from about $465,000 to $472,000 over the trailing year, a gain of roughly 1.5% that keeps owners building equity without re-igniting the affordability crisis.
According to the Federal Housing Finance Agency house-price index, Nevada's appreciation has tracked close to the national average after years of outsized swings — a sign the market has matured. Steady is the right grade because it protects both sides: sellers still gain equity, and buyers are not chasing a runaway number. According to Freddie Mac's Primary Mortgage Market Survey, mortgage rates remain the swing factor — every half-point move reshapes monthly payments far more than this year's modest price drift.
The grade is a B rather than an A because the appreciation is uneven. Luxury submarkets like Summerlin, where medians run past $650,000, and Henderson at roughly $525,000 have held value better than the broad valley, while some condo and townhome segments have been flat. Across the 6,225-plus closings the Nevada Real Estate Group team has represented, we see the same pattern: well-located, move-in-ready homes appreciate; dated or poorly priced inventory stalls.
How Much Inventory Does the Las Vegas Market Have?
Grade: C+. Inventory is the metric that has improved most for buyers. The valley now carries about 2.6 months of supply, up sharply from the sub-one-month famine of 2021 and 2022. A balanced market sits at four to six months, so 2.6 still tilts toward sellers — but it is a different planet from the bidding wars of three years ago.
That climb is why buyers have leverage again. With more than two months of homes on the shelf, contingencies are back, inspection requests are honored, and a $472,000 list price is increasingly a starting point rather than a floor. According to Las Vegas REALTORS, active listings have risen steadily through 2026 as more owners list and as new construction adds standing inventory. According to the U.S. Census Bureau housing-vacancy data, Nevada's for-sale supply has normalized faster than many coastal markets.
| Measure | 2021-2022 peak frenzy | 2026 |
|---|---|---|
| Months of supply | under 1.0 | 2.6 |
| Median days on market | about 10 | 36 |
| Typical buyer leverage | none | moderate |
| Concessions common? | no | yes |
The grade stays a C+ rather than a B because supply is still below balanced and remains tight at the affordable end. Sub-$400,000 inventory moves fastest, which is exactly where first-time buyers compete hardest.
How Quickly Do Homes Sell in Las Vegas?
Grade: B-. Median days on market sit at about 36 — a healthy, deliberate pace. That is up from the roughly 10-day blur of the frenzy and down from the 50-plus days the valley saw during the 2023 rate shock. A 36-day market is the sweet spot a report card should reward: homes priced correctly still sell briskly, but buyers finally have time to tour, inspect, and negotiate.
According to Las Vegas REALTORS, the pace varies by price band. Move-in-ready homes under $500,000 in commuter-friendly suburbs often go pending inside two weeks, while luxury listings above $1 million can sit 60 to 90 days as that pool of buyers shops carefully. The grade is a B- rather than a B because mispriced listings now linger conspicuously — a $50,000 overreach on a $472,000 home can mean an extra month and an eventual price cut. In our experience across thousands of valley closings, accurate first-week pricing is worth more than any other single seller decision.

Do Property Taxes Help Las Vegas Score Higher?
Grade: A. This is the valley's only A, and it is well earned. Nevada is one of a handful of states with no state income tax, and its property-tax burden is among the lightest in the nation. According to the Nevada Department of Taxation, the state's tax abatement caps annual increases on owner-occupied homes at 3%, shielding long-term owners from the kind of tax shock that hits California and Texas owners. According to the Clark County Assessor, the effective property-tax rate in the Las Vegas valley runs near 0.5% to 0.6% of market value.
The dollars are real. On a $472,000 home, an effective rate of roughly 0.55% produces an annual property-tax bill near $2,600 — compared with $5,000 to $9,000 on an equivalent home in many coastal metros. Stack the absent state income tax on top, and a household earning $100,000 can keep several thousand dollars more each year than it would across the state line. That tax advantage is a quiet but powerful driver of the relocation wave into the valley, and it materially improves the true cost of ownership even when the sticker price feels steep.
| Location type | Effective rate | Annual tax bill |
|---|---|---|
| Las Vegas valley | about 0.55% | about $2,600 |
| Typical coastal metro | 1.1% to 1.9% | $5,200 to $9,000 |
| State income tax (NV) | 0% | $0 |
How Strong Is the Las Vegas Job Market Behind the Housing Score?
Grade: B. A housing market is only as durable as the paychecks behind it, and Las Vegas has spent a decade deliberately reducing its dependence on the Strip. According to the U.S. Bureau of Labor Statistics, the Las Vegas metro's employment base has broadened into logistics, healthcare, professional services, and a growing sports-and-entertainment economy anchored by the Raiders, the Golden Knights, the Athletics' ballpark, and Formula 1.
Big-employer momentum supports the grade. Regional manufacturing and logistics investment — including the multibillion-dollar expansion ecosystem around the Tahoe-Reno corridor to the north and continued distribution growth in the south — keeps wage growth positive. According to the Bureau of Economic Analysis, Nevada's GDP growth has outpaced the national average in recent years. The grade is a B rather than an A because tourism still swings the local economy more than a fully diversified metro would like; a national travel slowdown remains the valley's clearest macro risk. Still, for buyers weighing a Henderson relocation or a Summerlin move-up, the job base is meaningfully sturdier than its reputation.
What Do Investors and Renters See in the Las Vegas Report Card?
Grade: B-. Las Vegas remains a magnet for buy-and-hold investors, but the math has tightened. With a median rent near $1,650 and median prices around $472,000, gross rent-to-price ratios have compressed from the standout cash-flow days of the mid-2010s. According to the U.S. Census Bureau, the valley's renter share remains high, sustaining steady demand for well-located single-family rentals and townhomes.
The investor grade is a B- because appreciation and tax efficiency now do more of the heavy lifting than monthly cash flow. A $472,000 rental returning $1,650 a month no longer clears the classic 1% rule, but Nevada's zero income tax, light property taxes, and steady in-migration keep total returns competitive. Investors who buy new construction with builder rate buydowns can engineer cash flow that resale cannot match — another reason the new construction channel is so active. For owner-occupants, the same rent figures make the rent-versus-buy decision a genuine toss-up that turns on how long you plan to stay.
How Does Las Vegas Compare to Reno and Other Western Metros?
Grade context: B overall versus its peers. Within the Western region that Realtor.com flagged as broadly underperforming, Las Vegas grades better than most. The valley's combination of active homebuilding and zero income tax separates it from supply-starved California metros, while its larger scale and deeper job base give it an edge over smaller Nevada markets.
| Metric | Las Vegas | Reno | Phoenix |
|---|---|---|---|
| Median price | about $472,000 | about $615,000 | about $470,000 |
| State income tax | 0% | 0% | 2.5% |
| Homebuilding | strong (B) | moderate | strong |
| Months of supply | 2.6 | about 2.9 | about 3.2 |
| Report-card lean | C+ overall | C overall | C+ overall |
According to the Federal Housing Finance Agency, all three Sun Belt metros have cooled to sustainable appreciation, but Las Vegas pairs that with the lowest entry price among the no-income-tax options. For buyers comparing Nevada markets, our team also covers the north — if a Reno move is on your radar, the same report-card logic applies, just with a higher median.
Which Las Vegas Neighborhoods Score Best on Each Metric?
A metro grade hides enormous variation, so here is where the valley splits. Affordability scores highest in North Las Vegas and the far northwest, where medians near $430,000 keep the entry door open. Homebuilding is strongest in Summerlin and the southwest, where master-planned land still feeds the pipeline. Value retention and luxury concentrate in Henderson, Green Valley, and the guard-gated communities, where medians run $525,000 and up.

If you are buying for the best overall report card — reasonable price, strong schools, and durable value — Henderson and the Summerlin villages consistently grade highest on the blended scorecard. If you are optimizing purely for the affordability metric, point your search north. According to GreatSchools, the school-rating gradient also tracks these submarket lines, which feeds directly into resale strength.
How Can Buyers and Sellers Use This Report Card in 2026?
For buyers, the report card says: use your leverage. A C+ market with 2.6 months of supply, 36-day pace, and builder concessions worth $15,000 to $40,000 is the most negotiable Las Vegas has been since 2022. Lead with the affordability metric — get pre-approved, target the sub-$500,000 bands where inventory is deepest, and ask for rate buydowns on new construction. Our buyer resources walk through each step. The A-grade tax structure means your true monthly cost is lower than the sticker price implies.
For sellers, the report card says: price to the data, not to 2021. With pace at 36 days and buyers holding moderate leverage, a correctly priced home in Summerlin or Henderson still sells quickly, but a $50,000 overreach now costs you a month and a price cut. Lean on the strong-grade metrics — taxes, location, value retention — in your marketing, and see our seller resources for the full listing playbook. Our team has guided 6,225-plus closings through every phase of this cycle; if you want a free, data-backed read on your home's grade, call (702) 637-1759 or use our contact page. You can also browse current valley inventory through our home search to see exactly how your competition is priced.
Frequently Asked Questions
What overall grade does the Las Vegas housing market get in 2026?
Las Vegas earns an overall C+ on our 2026 report card — one step above the C- that Realtor.com gave Nevada statewide. The valley loses points on affordability (a $472,000 median against a roughly $72,000 income) but gains them on homebuilding, an A-grade tax structure, and a diversifying job base.
Why did Realtor.com give Nevada only a C-?
According to Realtor.com research, Nevada scored 45.7 out of 100, dragged down by weak affordability — a median listing price near $492,789 against a $71,942 median household income, for a REALTORS Affordability Score of just 0.49. The statewide grade blends Las Vegas with Reno and rural counties, so it understates the metro's stronger homebuilding and tax marks.
Is Las Vegas affordable for first-time buyers in 2026?
It is challenging but workable. The median home costs about $472,000, requiring roughly $125,000 in income to qualify comfortably — well above the area median. The offsets are real: no state income tax, builder rate buydowns, and sub-$400,000 new product. Targeting North Las Vegas, where medians sit near $430,000, keeps the entry door open.
How much are property taxes in Las Vegas?
Property taxes are a genuine advantage. The effective rate runs about 0.55% of value, so a $472,000 home carries an annual bill near $2,600 — far below the $5,200 to $9,000 typical of coastal metros. Nevada also caps annual increases on owner-occupied homes at 3% and levies no state income tax.
Is now a good time to buy a home in Las Vegas?
For buyers who plan to stay several years, the conditions are favorable. Inventory at 2.6 months, a 36-day pace, and builder concessions worth $15,000 to $40,000 give buyers their best leverage since 2022. The main hurdle is the monthly payment at current rates, which a builder rate buydown can soften meaningfully.
How fast are Las Vegas home prices rising?
Slowly and sustainably. The median moved from about $465,000 to $472,000 over the trailing year — roughly 1.5% appreciation. That measured pace, after the 25% surge of 2021 and the 2023 correction, is exactly why price growth grades a B: owners still build equity without re-igniting the affordability crisis.
Which Las Vegas neighborhoods score best on the report card?
It depends on your priority. For affordability, North Las Vegas and the northwest grade highest near $430,000. For new construction, Summerlin and the southwest lead. For value retention and schools, Henderson and Green Valley top the blended scorecard with medians from $525,000 up.
Which Sources Inform This Las Vegas Report Card?
This report card is built from authoritative national and Nevada data, applied to the Las Vegas metro and graded on a transparent A-to-F scale. Market figures are deemed reliable but not guaranteed; confirm current numbers before acting.
- Realtor.com 2026 State Report Cards — national affordability and homebuilding framework and Nevada's grade
- U.S. Census Bureau — Las Vegas QuickFacts — income and demographic baselines
- U.S. Census Bureau — Building Permits Survey — Clark County permit activity
- Las Vegas REALTORS — median price, inventory, and days-on-market data
- Nevada Department of Taxation — property-tax abatement and rate structure
- Clark County Assessor — effective property-tax rates
- Federal Housing Finance Agency House Price Index — appreciation trends
- Freddie Mac Primary Mortgage Market Survey — mortgage-rate context
- U.S. Bureau of Labor Statistics — Nevada — employment and wage data
- Bureau of Economic Analysis — Nevada GDP growth
- U.S. Department of Housing and Urban Development — cost-burden definitions and income limits
- National Association of Home Builders — construction and permit benchmarks
- GreatSchools — Nevada — school-rating gradient by submarket