
Southern Nevada's first half of 2026 will be remembered as the year the Las Vegas market stopped climbing and started balancing. Through six months, the region's median sale price landed near $434,725 — statistically flat against the same stretch of 2025 — while active inventory rebuilt above 15,000 homes and days on market stretched from the mid-20s into the low 30s. After years of a seller-dominated market, the data now shows a valley finding equilibrium: still healthy, still transacting at volume, but no longer moving in only one direction.
Across our 9,600+ closings at Nevada Real Estate Group since 2011 — including the 789 homes we closed in 2025 as the #1-ranked team in Nevada — we have watched Las Vegas cycle through boom, correction, and recovery, and the mid-2026 picture is the clearest "balancing" signal we have seen in three years. This report recaps the first half by the numbers and by submarket, then lays out what the second half of 2026 holds for buyers and sellers. If you want the exact comparable sold data for your specific neighborhood before you make a move, our direct line is (702) 637-1759.
Through the first half of 2026, the Las Vegas metro median sale price held near $434,725 — essentially flat (about +0.5%) year-over-year — on roughly 16,921 closings. Active inventory rebuilt to about 15,141 homes and median days on market lengthened to 30, both signs of a market rebalancing toward buyers. Prices are stable rather than falling; the leverage shift, not a price crash, is the mid-year story heading into a slower, more negotiable second half.
- H1 2026 metro median: about $434,725, about +0.5% year-over-year — flat, not falling.
- Roughly 16,921 closings in H1, down about 2.6% from 2025's 17,369 — steady demand.
- Active inventory rebuilt to about 15,141 homes; days on market rose to 30 (from 27).
- June submarket medians: Summerlin $537.5K, Henderson $480K, North Las Vegas $395K.
- Second half favors prepared buyers — more choice, more negotiating room, stable prices.
What Did the First Half of 2026 Look Like for Las Vegas Housing?
The headline number is stability. According to Greater Las Vegas REALTORS closing data, the Southern Nevada metro recorded roughly 16,921 closed sales in the first half of 2026 at a median of $434,725 — against 17,369 closings at $432,390 in the first half of 2025. That is a +0.5% year-over-year move in median price and a −2.6% dip in sales volume: statistically, a flat market. Median days on market rose from 27 to 30, and price per square foot eased slightly from $271 to $267.
In our experience, a flat median masks a meaningful shift underneath. The market that produced 2023–2024's bidding wars ran on scarcity; the mid-2026 market runs on choice. With 15,141 active listings at midpoint — versus the sub-4,000-home inventory of the peak — buyers finally have options, and that alone changes the negotiating dynamic even when prices barely move. According to Las Vegas REALTORS, the valley crossed back toward a balanced months-of-supply reading in H1, the clearest such signal since 2022.
Where Is the Momentum Hiding in the Las Vegas Market?
Read the national coverage at the halfway mark of 2026 and a phrase keeps recurring: the housing market is showing surprising signs of momentum. Activity still sits below pre-pandemic norms, but bright spots keep surfacing — and Southern Nevada is one of the clearer ones once you look past the headline that prices "went flat."
Flat is the story people are misreading. Through 2024 and into 2025, a large share of forecasters expected Las Vegas to give back a meaningful slice of its run-up once rates stayed higher for longer. That correction did not arrive. According to Greater Las Vegas REALTORS closing data, the metro median finished the first half at $434,725 against $432,390 a year earlier — a market that absorbed the most aggressive rate environment in four decades and still held its value. In a cycle where the bear case was a price reset, holding is not a neutral outcome. It is the bullish one.
Volume tells the same story more quietly. 16,921 closings in the first half against 17,369 in 2025 is a 2.6% difference — a rounding error in a market this size, not a demand collapse. Roughly 17,000 Southern Nevada households still moved in six months at rates north of 6%. That is a floor of genuine, need-driven demand: job changes, growing families, retirements, relocations. Those buyers were never waiting for a perfect rate; they were waiting for enough inventory to have a real choice.
They now have it, and that is the second bright spot. Active listings rebuilt above 15,141 homes while the median price held. Buyers spent three years asking for leverage and were repeatedly told they could have it only if values fell. Las Vegas has quietly delivered the rarer version: more selection, more negotiating room, longer decision windows, and stable pricing at the same time. A buyer in August 2026 can tour a genuine shortlist, ask for a rate buy-down or a repair credit, and still buy into a market that has not been marking down its comparables.
The third bright spot is that strength is not evenly distributed, which is good news for anyone willing to be specific. Summerlin held a June median near $537,500 while North Las Vegas sat near $395,000 — a spread of roughly $142,500 inside one metro. Averages hide that. A seller in a tight submarket is not operating in the same market as the valley-wide median suggests, and neither is a buyer targeting an entry-level ZIP.
The honest counterweight, and the reason this is momentum rather than a boom: transaction activity across the country — Las Vegas included — is still running below its pre-pandemic pace. Nobody should read a stabilizing median as a signal to expect 2021 conditions again. What the first half actually proved is narrower and more useful: Las Vegas found a floor, held it through the worst of the rate cycle, and rebuilt the inventory that a functioning market requires. Across the 9,600-plus closings our team has handled, the stretches that rewarded clients most were rarely the frantic ones. They were the ones like this — where good inventory sat long enough to be negotiated properly.
How Did Prices Move Through the First Half?
Prices did not crash, and they did not surge — they flattened. According to the Federal Housing Finance Agency, Las Vegas home values compounded strongly over the prior five years, and a flat-to-slightly-positive first half of 2026 represents a healthy digestion of those gains rather than a reversal. The metro median sat at $434,725 for H1; on a monthly basis, the valley median ran higher (the June valley reading was around $472K on a city-of-Las-Vegas basis), reflecting the mix of homes trading and the premium submarkets carrying more weight month to month.
The important read for a seller: your home is worth roughly what it was a year ago, but it will take longer to sell and buyers will negotiate. The read for a buyer: you are not catching a falling knife — prices are stable — but you have leverage you did not have in 2024. According to Freddie Mac, stable prices plus rebuilt inventory is the textbook setup for a negotiable market, and that is precisely where Las Vegas sits at mid-year.
What Happened to Sales Volume and Inventory?
Volume held remarkably steady. The 16,921 H1 closings were within about 2.6% of last year's pace — demand did not collapse, it normalized. What changed dramatically is the supply side: 15,141 active listings at mid-year versus the extreme scarcity of the recent past. That inventory rebuild is the single most important 2026 development, because it is what returns choice and negotiating power to buyers without requiring prices to fall.
On the current sales pace, that translates to a months-of-supply reading in the balanced 4–5 month range across most of the valley — a stark change from the one-to-two-month, seller-dominated readings of the recent boom. According to the U.S. Census Bureau, the Las Vegas metro continues to add population and households, which underpins the durable demand beneath the rebalancing.
How Did Each Las Vegas Submarket Perform in June?
The valley is not one market, and the June closing data shows real dispersion by submarket. Here is where the big Southern Nevada submarkets stood — each with a full monthly report if you want the detail.
| Metric | Summerlin | Henderson | North Las Vegas |
|---|---|---|---|
| June median | $537,500 | $480,000 | $395,000 |
| Days on market | 35 | 29 | 19 |
| Active inventory | 1,465 | 2,506 | 1,077 |
| Median $/sq ft | $327 | $277 | $233 |
| Best for | Move-up + luxury | Families + value luxury | Value + first-time |
The pattern is intuitive: Summerlin commands the premium ($537.5K median, $327/sq ft), Henderson sits in the value-luxury middle, and North Las Vegas remains the valley's affordability and speed play — its June median of $395,000 and 19-day pace were the fastest of the major submarkets. For the full monthly detail, see the June reports for Summerlin, Henderson, and North Las Vegas.
What Are Mortgage Rates Doing at Mid-Year?
Rates remain the swing factor for the second half. According to Freddie Mac's Primary Mortgage Market Survey, 30-year fixed rates spent the first half of 2026 elevated relative to the pandemic-era lows, which is the primary reason sales volume normalized rather than accelerated even as inventory improved. Every meaningful move in rates changes buyer purchasing power: a swing of even half a percentage point shifts what a given monthly payment can buy by tens of thousands of dollars.
According to the Mortgage Bankers Association, affordability — not desire — is the constraint on demand, which is why Las Vegas is transacting at healthy volume without price acceleration. For the second half, the base case is rates staying range-bound; any sustained decline would pull sidelined buyers off the fence quickly given the improved inventory, tightening the market again.
How Is the Luxury Market Performing at Mid-Year?
The upper tiers told their own story in H1. According to Las Vegas REALTORS data, the $1 million-plus segment continued to draw relocation and cash buyers into guard-gated communities and luxury master plans, where limited comparable inventory keeps that tier more insulated from the broader rebalancing. Summerlin's guard-gated enclaves, MacDonald Highlands, The Ridges, and Southern Highlands carried the luxury volume.
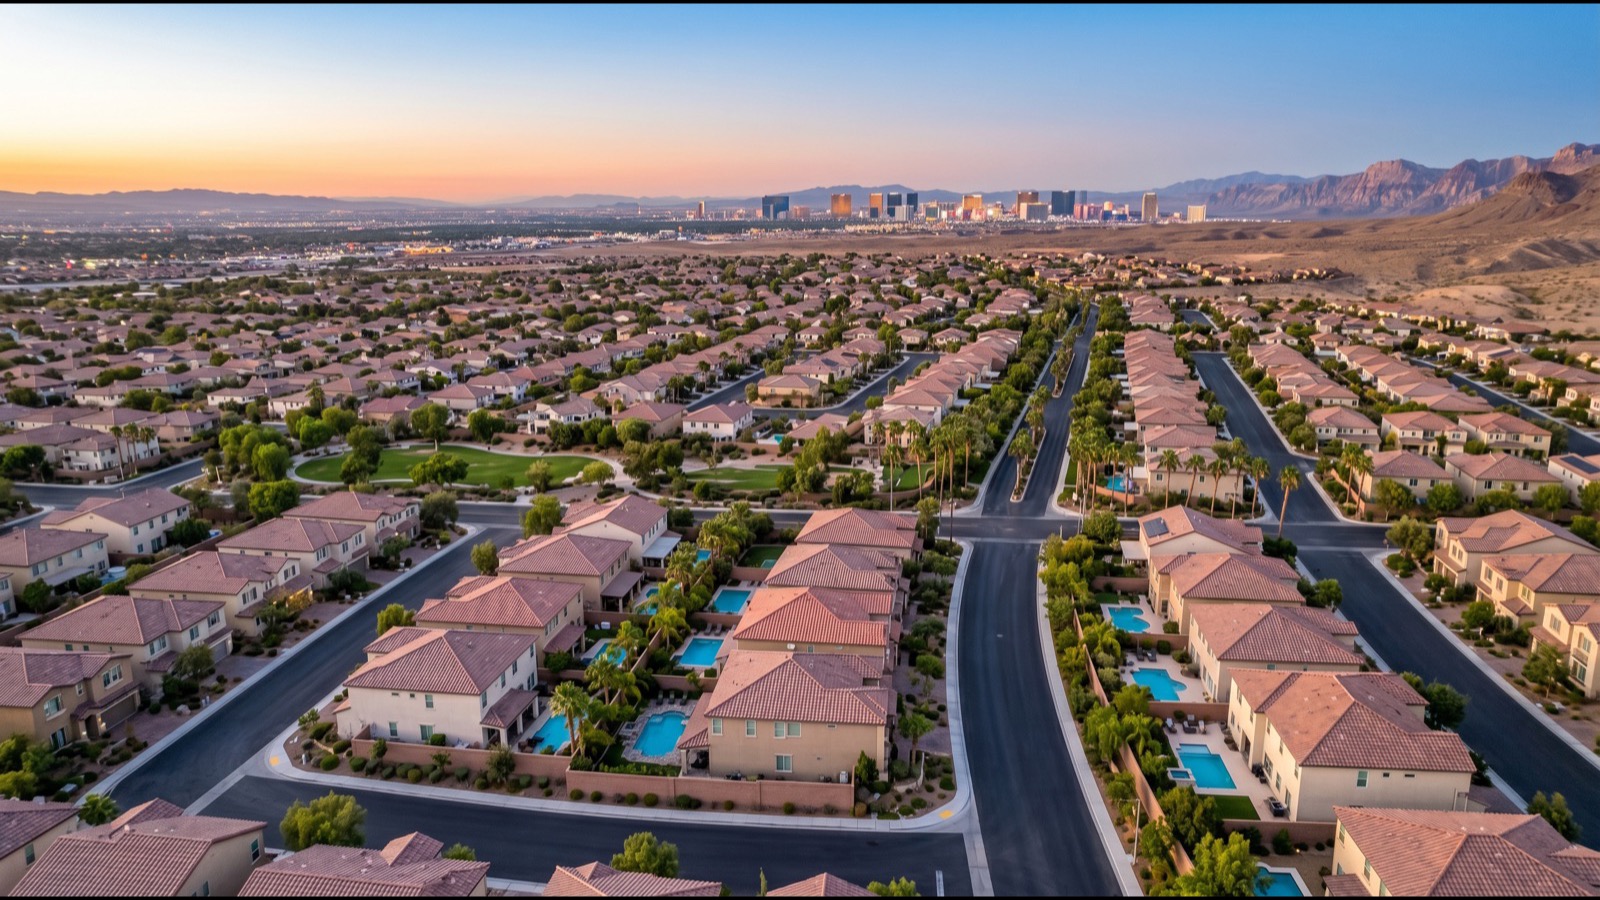
The nuance for luxury sellers: even a resilient tier is not immune to longer marketing times when the overall market slows, so pricing to the current comparable set — not last year's peak — still matters at the top. For luxury buyers, mid-year offers a rare combination of more listings and less frenzy than the recent past.
Is It a Buyer's or Seller's Market Now?
At mid-year, Southern Nevada is the most balanced it has been in three years, tilting gently toward buyers. The evidence is in the trio of metrics: days on market up (27 → 30), inventory up (to about 15,141), and prices flat (+0.5%). That combination — homes taking longer to sell, more of them available, prices holding — is the definition of a market handing leverage back to buyers without a price collapse.
For a seller, that means the days of naming a price and fielding ten offers are over for most homes; you compete on condition, presentation, and realistic pricing. For a buyer, it means you can take a breath, tour more homes, write in contingencies, and negotiate — advantages that were unthinkable at the peak. The market is not a crash; it is a normalization, and normalization rewards preparation on both sides.
What Does the Second Half of 2026 Look Like for Las Vegas?
Our base case for H2 2026 is continuity: stable-to-slightly-soft prices, seasonally lighter summer volume rebuilding into fall, and continued inventory availability that keeps buyers in the driver's seat. Barring a sharp move in rates, we do not expect a price break — the population and job growth underpinning demand are intact — but we also do not expect a return to bidding wars unless rates fall meaningfully.
| Scenario | What happens | Buyer / seller takeaway |
|---|---|---|
| Rates hold (base case) | Prices flat, inventory stays healthy | Buyers keep leverage; sellers price to comps |
| Rates fall meaningfully | Sidelined buyers return, market tightens | Buyers should act before competition returns |
| Rates rise | Volume softens further, more negotiation | Strong buyer leverage; sellers must be patient |
According to the Bureau of Labor Statistics, the Las Vegas economy continued to add jobs through the first half, which supports the durable-demand base case. The wildcard is entirely on the rate side.
What Should Buyers Do in the Second Half of 2026?
For the first time in years, buyers hold real cards. Use them: get fully pre-approved so you can move decisively, tour widely because you have choice, and negotiate on price, closing costs, rate buydowns, and repairs — sellers are far more receptive now than in 2024. Do not wait for a price crash that the fundamentals do not support; instead, capture the leverage that already exists. If rates decline later in the year, today's negotiating room disappears fast. Browse live Las Vegas homes for sale and let us model your specific buying power against current comps.
What Should Sellers Do in the Second Half of 2026?
Sellers can still win in this market — but the playbook changed. Price to the current comparable set, not last year's peak; a home priced right sells, a home priced to 2024 sits and then chases the market down. Invest in condition and presentation, because buyers with choice reward the best-prepared home. Expect a 30-plus day marketing window and be ready to negotiate. Our sellers team prices every listing to the live data and prepares it to compete — the difference between a clean sale and a stale listing in a balancing market is almost entirely pricing and preparation.
How Does Las Vegas Compare to Northern Nevada at Mid-Year?
The two Nevada markets diverged in H1 2026, and the contrast is instructive. While Southern Nevada's median stayed flat year-over-year, Northern Nevada's median rose about 4.6% and its days on market actually shortened — a tighter, still-appreciating market. In other words, the Reno-Tahoe region is running roughly a cycle behind the Las Vegas rebalancing, with less inventory relief so far. For the full Northern picture, see our companion Northern Nevada mid-year outlook and the June reports for the Reno-Tahoe metros.
What Are the Risks and Wildcards for the Second Half?
The dominant wildcard is mortgage rates: a sustained decline would re-tighten the market quickly, while a spike would deepen buyer leverage. Secondary factors include the pace of new-construction deliveries (which adds to inventory), the health of the local job market, and broader economic signals. According to HUD and the National Association of REALTORS, affordability and rate policy remain the national swing factors, and Las Vegas — as an affordability-sensitive, in-migration-driven market — feels those swings more than most. The base case is stability; the risks are symmetric around rates.
How Does H1 2026 Compare to H1 2025 Year Over Year?
The clearest way to read the market is side by side with last year. The comparison confirms the "flat, not falling" thesis: prices essentially unchanged, volume down slightly, and homes taking a few days longer to sell.
| Metric | H1 2026 | H1 2025 | Change |
|---|---|---|---|
| Median sale price | $434,725 | $432,390 | +0.5% |
| Closed sales | 16,921 | 17,369 | −2.6% |
| Median days on market | 30 | 27 | +3 days |
| Median $/sq ft | $267 | $271 | −1.5% |
According to Las Vegas REALTORS, the sub-1% moves in median price and price per square foot are within the normal noise band — this is a market treading water on price, which is exactly what a healthy digestion of prior gains looks like. The meaningful change is behavioral: with days on market up 11% (27 to 30) and sales volume off 2.6%, buyers are taking their time and sellers are competing. A $2,335 change in the median on a $432,000 base is statistically nothing; the three-day lengthening in days on market and the inventory rebuild behind it are what actually shifted the negotiating table.
What Is Driving the Las Vegas Market at Mid-Year?
Three forces set the 2026 tone. First, mortgage rates: elevated relative to the 2021 lows, they capped affordability and kept demand at a normalized pace rather than a frenzy — the single biggest reason the market flattened. Second, inventory recovery: builders delivered, and more existing owners listed, rebuilding active supply above 15,000 homes and ending the scarcity that drove bidding wars. Third, durable in-migration: according to the U.S. Census Bureau, the Las Vegas metro kept adding households, and the Bureau of Labor Statistics recorded continued job gains — the demand floor under a flat market.
The interplay of those forces explains why prices held while behavior changed. High rates suppress how much buyers can pay, which caps price growth; rebuilt inventory gives buyers alternatives, which caps a seller's pricing power; but steady population and job growth keep enough buyers in the market that prices do not fall. Net result: a $434,725 median that barely moved, on healthy volume, with leverage quietly migrating to the buyer. Understanding which of those forces shifts in the second half — almost certainly rates — is how you read what comes next.
How Does New Construction Factor Into the 2026 Market?
New construction is a bigger part of the Las Vegas 2026 story than in most metros, and it works two ways at mid-year. On one hand, builder deliveries added meaningfully to the inventory rebuild that rebalanced the resale market — every new subdivision that closes out competes with nearby resale listings. On the other, builders responded to the slower pace with aggressive incentives: rate buydowns, closing-cost credits, and design-center allowances that can be worth tens of thousands of dollars, which pulls some buyers out of the resale pool entirely.
For a buyer, that means the new-construction channel deserves a serious look in H2 2026 — the effective price after builder incentives sometimes beats comparable resale, especially on standing inventory a builder wants to move before quarter-end. For a resale seller, it means your competition is not just other resale homes but the new-build down the road offering a 5% rate when you cannot. Pricing and presentation have to account for that. We model resale-versus-new for every buyer we represent, because in this market the builder incentive can be the deciding factor on a $450,000 decision.
What Does Mid-Year Mean for Move-Up and Downsizing Owners?
The owners in the trickiest spot are the ones who need to sell and buy in the same market. The good news at mid-year 2026: a balanced market is actually easier to navigate on both sides than a red-hot one. When you sell, you will not get a frenzy of over-asking offers, but you also will not overpay or waive contingencies on your purchase — you buy with the same leverage every other buyer now has. The math nets out more favorably than in a seller's market, where you sold high but then fought ten offers on your next home.
The tactical key is sequencing and contingencies, which a balanced market finally allows. According to Freddie Mac, stable prices reduce the timing risk that makes move-up moves stressful — you are not racing a rising market. For downsizers with substantial equity from the last five years of appreciation, mid-year 2026 is a genuinely good window: sell into steady demand, then buy your smaller home with real negotiating room. Our sellers team routinely coordinates the sell-and-buy sequence so our clients are never caught owning two homes or none; call (702) 637-1759 to map your specific move.
Frequently Asked Questions
Is the Las Vegas housing market going up or down in 2026?
Neither sharply — it is flat. The metro median held near $434,725 through the first half of 2026, about +0.5% year-over-year. Prices are stable, not crashing and not surging. What changed is the balance of power: inventory rebuilt to about 15,141 homes and days on market rose to 30, handing leverage back to buyers without a price decline.
Is 2026 a good time to buy a home in Las Vegas?
For a prepared buyer, yes. You have more inventory, more negotiating room, and stable prices — advantages that did not exist in 2024. The risk of waiting is that a decline in mortgage rates later in 2026 would pull sidelined buyers back in and erase today's leverage. Get pre-approved and shop the current market rather than waiting for a crash the fundamentals do not support.
Is it a buyer's or seller's market in Las Vegas right now?
At mid-year 2026 it is the most balanced Las Vegas has been in three years, tilting gently toward buyers. Days on market are up, inventory is up, and prices are flat — the classic signature of a market shifting leverage to buyers. Sellers still transact, but they compete on price and condition rather than fielding multiple offers.
What is the median home price in Las Vegas at mid-year 2026?
The Southern Nevada metro median for the first half of 2026 was about $434,725. On a monthly basis the valley median ran higher (June was around $472,000 on a city-of-Las Vegas basis), reflecting the mix of homes selling. By submarket in June: Summerlin $537,500, Henderson $480,000, and North Las Vegas $395,000.
Will Las Vegas home prices drop in the second half of 2026?
Our base case is stable-to-slightly-soft, not a drop. The population and job growth underpinning demand are intact, and inventory — while rebuilt — is not at oversupply levels. A meaningful decline would require a demand shock or a sharp inventory surge; neither is in the current data. Expect flat prices with strong buyer negotiating room rather than a price break.
How many homes sold in Las Vegas in the first half of 2026?
Roughly 16,921 closed sales across the Southern Nevada metro in the first half of 2026, within about 2.6% of the 17,369 recorded in the same period of 2025. Demand normalized rather than collapsed; the bigger 2026 change was on the supply side, with active inventory rebuilding above 15,000 homes.
Which Sources Inform This Mid-Year Las Vegas Analysis?
The H1 medians, sales counts, days-on-market, and inventory figures reflect Greater Las Vegas REALTORS closing and active-listing data pulled the week this report published, cross-checked against the 9,600+ closings Nevada Real Estate Group has completed since 2011 and the 789 homes we closed in 2025. Public rate and economic data comes from the authorities below. For your specific neighborhood's comparable sold data, call (702) 637-1759.
- Las Vegas REALTORS — closing, inventory, and days-on-market data
- Federal Housing Finance Agency — Las Vegas home-price appreciation
- Freddie Mac Primary Mortgage Market Survey — mortgage rates
- Mortgage Bankers Association — affordability and lending data
- Bureau of Labor Statistics — Las Vegas employment
- U.S. Census Bureau — metro population and households
- HUD — housing policy and affordability
- National Association of REALTORS — national market context
- Nevada Department of Taxation — property and transfer data
- Clark County Assessor — parcel and valuation records
- U.S. Bureau of Economic Analysis — regional economic output