

Published April 30, 2026 · Last updated July 13, 2026 · By Chris Nevada
The question I field more than any other in 2026 is a simple one with a complicated answer: are Las Vegas home prices going up or down? The honest read is both, depending on where you stand. Prices are still climbing — but slowly — while the for-sale inventory that vanished during the pandemic has come roaring back, tilting negotiating leverage toward buyers for the first time in four years. That combination is unusual, and it changes the playbook for anyone buying or selling this year.
Las Vegas home prices are up, but only modestly. The metro median existing-home price is about $450,000 over the trailing 90 days — a 1.9% year-over-year gain that sits within a whisker of the cyclical high. The bigger story is inventory: roughly 12,500 active listings now push the valley to about 7 months of supply, its softest reading since 2019. Prices are near record levels; leverage has shifted toward buyers.
- The Las Vegas metro median is about $450,000, up 1.9% year over year across 5,064 closed sales.
- Active inventory roughly tripled to about 12,500 listings — near 7 months of supply, a buyer-leaning market.
- Summerlin ($625,000) and Anthem ($625,000) lead; North Las Vegas ($425,000) and Boulder City ($399,000) anchor value.
- Median days on market is 26, up from 24 a year ago — slower, but not distressed.
- Sellers must price to the last 30 days of comps; buyers can finally negotiate credits and buydowns.
Are Las Vegas Home Prices Going Up or Down in 2026?
They're going up — gently. According to Greater Las Vegas REALTORS closed-sale data pulled live for this update, the metro median existing-home price is $449,676 over the trailing 90 days, versus $441,275 in the same window a year ago. That is a 1.9% year-over-year increase. It is nothing like the 15-20% surges of 2021-2022, and it is below the long-run 3-4% norm — but it is still positive, and it still sits within roughly 2% of the all-time high.
The nuance that trips people up is the difference between price and conditions. Prices are near record levels. Conditions have softened materially. Over the same period, closed sales rose 4.8% year over year (5,064 versus 4,831), which sounds strong until you learn that active inventory climbed far faster — roughly tripling from a year ago. When supply outruns demand, prices flatten before they fall. That is exactly the pattern I am watching valley-wide: appreciation decelerating toward zero in some submarkets even as the headline median holds near its peak.
For sellers, that means the days of naming a price and watching five offers roll in are over in most price bands. For buyers, it means the leverage you lacked in 2021 has quietly returned. Neither group should read "near record highs" as "same frenzied market" — the mechanics underneath have changed. If you want to pressure-test your own timeline against this data, the fastest starting point is our Las Vegas homes-for-sale search, which runs off the same live MLS feed these figures come from.
What Is the Median Home Price in Las Vegas Right Now?
The single most-cited number — the metro median existing-home price — is about $450,000 as of this update. Here is the fuller picture from the live GLVAR feed:
| Metric | Value | Year-Ago Comparison |
|---|---|---|
| Median sold price | $449,676 | $441,275 (+1.9%) |
| Average sold price | $566,300 | Higher tail from luxury & high-rise sales |
| Closed sales (90 days) | 5,064 | 4,831 (+4.8%) |
| Median days on market | 26 days | 24 days (slower) |
| Active listings (metro) | ~12,501 | Roughly triple a year ago |
| Median list price (active) | $478,025 | Asking runs above sold — a buyer signal |
One detail worth flagging: the median asking price ($478,025) sits about $28,000 above the median sold price ($449,676). In a hot market those two numbers converge or invert — homes sell at or above list. A persistent gap like today's is a classic sign that sellers are still anchored to yesterday's peak while buyers negotiate them down. According to the Federal Housing Finance Agency House Price Index, Nevada's appreciation rate has decelerated in step with this pattern across recent quarters.
If you own a home and want to know where yours lands against these comps rather than the metro average, run it through our home value estimator — it prices to your specific parcel, not a valley-wide median.
How Have Las Vegas Home Prices Changed Over the Past Decade?
I have watched Las Vegas prices through every cycle, and the long arc matters when you are deciding whether "near record highs" is a warning or a footnote. The current $450,000 median is a remarkable distance from the 2012 trough near $118,000, and it reflects a far more measured climb than the reckless 2004-2006 run that preceded the crash.
| Year | Approx. Median | YoY Change | Defining Event |
|---|---|---|---|
| 2019 | $300,000 | +3.4% | Pre-pandemic baseline |
| 2020 | $325,000 | +8.3% | Pandemic demand surge begins |
| 2021 | $395,000 | +21.5% | Record-low inventory, bidding wars |
| 2022 | $440,000 | +11.4% | Peak frenzy, rates begin rising |
| 2023 | $425,000 | -3.4% | Rate shock creates a brief dip |
| 2024 | $440,000 | +3.5% | Buyers adjust to a higher-rate normal |
| 2025 | $443,000 | +0.7% | Appreciation flattens as supply rebuilds |
| 2026 (mid) | $449,676 | +1.9% | Near record high, inventory surging |
The brief dip in 2023 scared some buyers out of the market, and those who waited watched prices climb roughly $25,000 back to new highs. That is the recurring lesson of this valley: timing the exact bottom is nearly impossible, and the long-term trend has been stubbornly upward through every cycle since the Great Recession. According to the U.S. Census Bureau, Clark County remains one of the fastest-growing large counties in the country, and that demographic floor is what keeps pulling the trend line higher even in soft years.
What Do Homes Cost in Each Las Vegas Submarket?
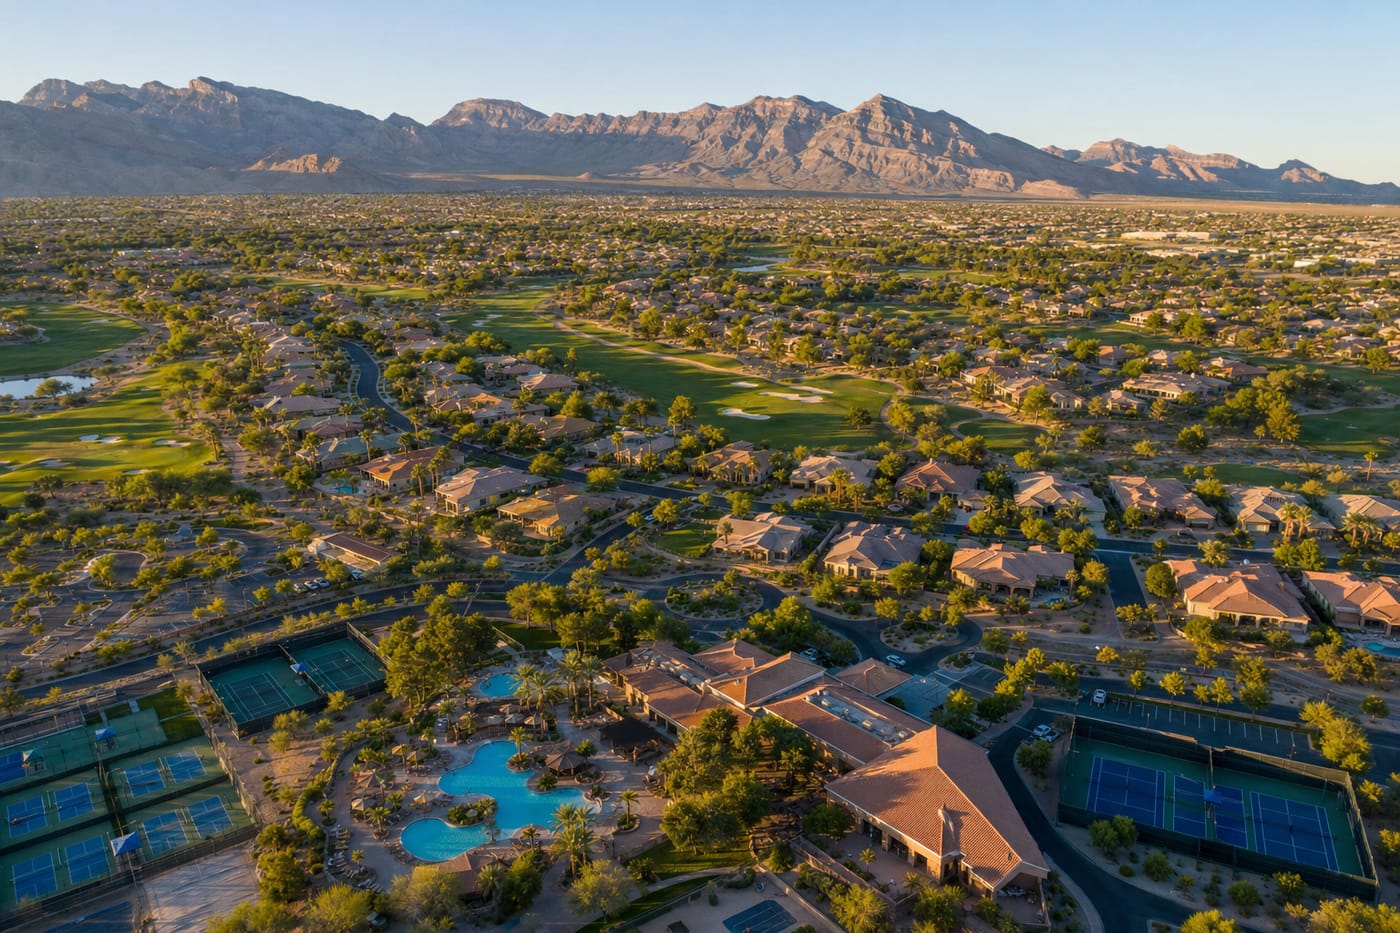
A metro median hides enormous dispersion. The same $450,000 that buys a comfortable single-family home in North Las Vegas barely covers a two-bedroom in the core of Summerlin. Here are the trailing-90-day sold medians by submarket, pulled live from GLVAR:
| Submarket | Median Sold | Median Active List | Days on Market |
|---|---|---|---|
| Summerlin | $625,000 | $699,750 | 30 |
| Anthem (Henderson) | $625,000 | $609,756 | 28 |
| Inspirada (Henderson) | $572,500 | $539,999 | 29 |
| Centennial Hills | $550,475 | $599,000 | 27 |
| Green Valley (Henderson) | $539,650 | $650,000 | 28 |
| Skye Canyon | $505,000 | $540,000 | 32 |
| Lake Las Vegas | $500,000 | $684,394 | 32 |
| Southwest Las Vegas | $497,500 | $549,900 | 28 |
| Mountain's Edge | $476,000 | $499,900 | 24 |
| Aliante (North LV) | $439,900 | $449,900 | 21 |
| North Las Vegas | $425,000 | $425,000 | 22 |
| Boulder City | $399,000 | $430,000 | 43 |
Summerlin commands the highest non-luxury prices in the valley, driven by established infrastructure, top-rated schools, and proximity to Red Rock Canyon. Henderson's master plans — Anthem, Green Valley, Inspirada — cluster in the $540,000-$625,000 band and consistently rank among the safest, most family-oriented submarkets. On the value end, North Las Vegas at $425,000 and Boulder City at $399,000 remain the entry points for buyers priced out of the core, while Mountain's Edge and Centennial Hills offer newer suburban inventory in between. Boulder City's 43-day median days-on-market — nearly double the metro — reflects its small, tightly-held inventory rather than weak demand.
Why Has Inventory Climbed So Sharply in 2026?
This is the change that matters most, and it is the piece the old "prices are up" headline misses. According to Greater Las Vegas REALTORS counts pulled live, the metro is now carrying about 12,501 active listings. With roughly 1,688 closings per month (5,064 over 90 days), that pencils out to about 7.4 months of supply — the softest reading since 2019, and a world away from the 1-2 months that defined the frenzy.
Three forces built this inventory:
1. The lock-in effect is thawing. For two years, homeowners sitting on 3% mortgages refused to sell and trade into a 7% loan. As life events — job moves, growing families, retirements — pile up, more of those owners are finally listing, adding resale supply that had been artificially suppressed.
2. Builders kept delivering. According to the Clark County permitting record, national builders have continued closing new homes across North Las Vegas, Skye Canyon, and southern Henderson, layering fresh supply on top of the resale thaw.
3. Demand cooled at the margin. Affordability is stretched at 6.5-7% rates, so the marginal buyer who would have transacted at a 5% rate is sitting out. Fewer buyers plus more listings equals a higher months-of-supply reading.
Six months of supply is the traditional line between a buyer's and seller's market. At 7.4 months, the metro has crossed into buyer-leaning territory on paper — though the strongest submarkets (Aliante, Mountain's Edge, North Las Vegas) still clear in the low-20-day range and behave more like balanced markets. If you are shopping, this is the most negotiable Las Vegas has been in four years; browse active luxury communities or run the full MLS search to see how deep the selection now runs.
How Do Single-Family and Condo Prices Compare?
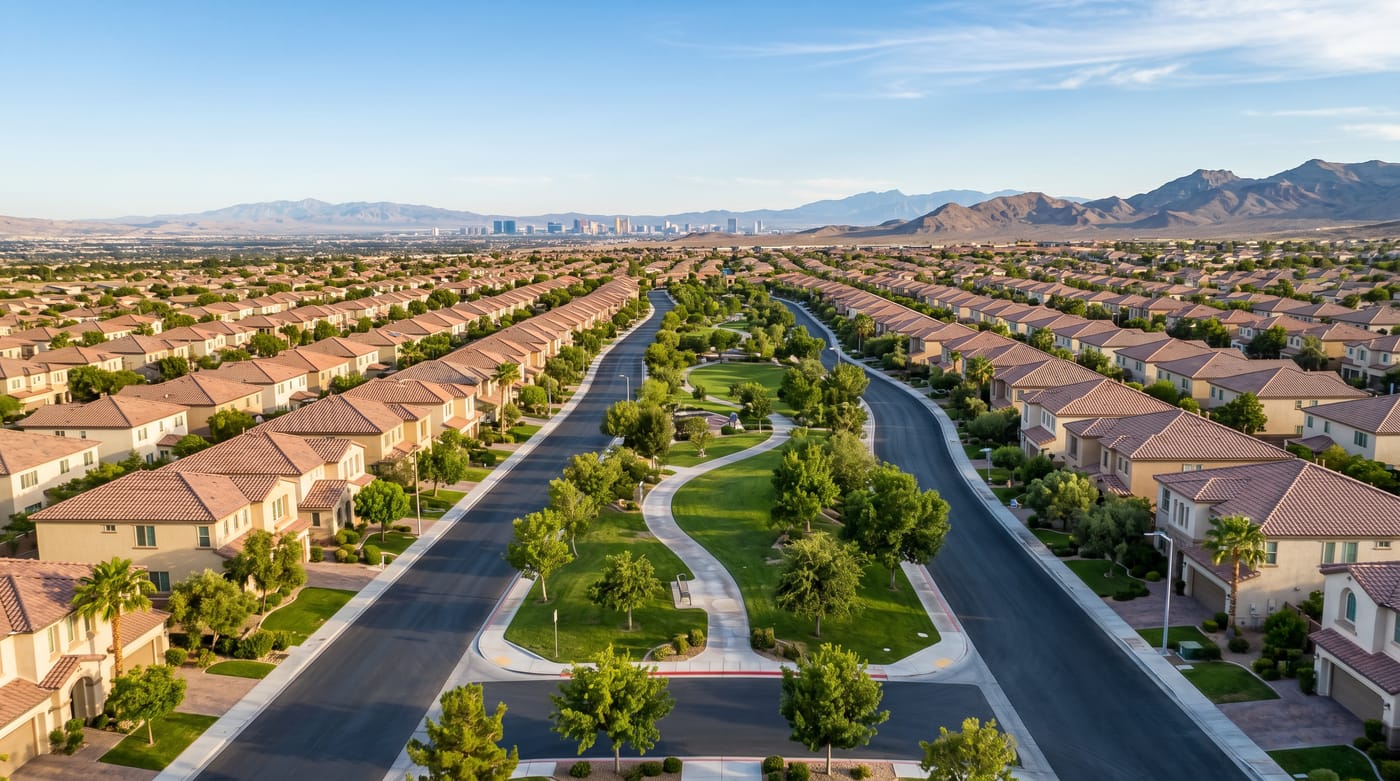
Property type is the second-biggest driver of what your budget buys. Detached single-family homes across the valley's master plans — Summerlin, Green Valley, Mountain's Edge — cluster in the $476,000-$625,000 band. Attached product spans an enormous range: suburban townhomes in the low $300,000s at the entry end, all the way to Strip-corridor high-rises above $1 million at the top. That luxury high-rise tail is why the metro's average sold price ($566,300) runs well above the median ($449,676) — a handful of $2-3 million tower sales pull the average up without moving the median.
| Budget | Where It Lands | Typical Home |
|---|---|---|
| $300K-$400K | North Las Vegas, east valley, older suburban | 3-bed, 1,600-2,000 sqft, some updates needed |
| $400K-$550K | Southwest, Mountain's Edge, Aliante, Spring Valley | 3-4 bed, 1,800-2,400 sqft, good school zones |
| $550K-$750K | Summerlin, Green Valley, Anthem, Inspirada | 4-5 bed, 2,200-3,200 sqft, full-amenity master plans |
| $750K-$1.2M | Premium Summerlin, Lake Las Vegas, Seven Hills | 4-5 bed, 3,000-4,500 sqft, gated, pool-ready |
| $1.2M+ | The Ridges, MacDonald Highlands, Ascaya | Custom estates, Strip/golf views, resort pools |
The $400,000-$550,000 band is the busiest slice of the market — it is where first-time buyers and move-up families overlap, and where competition is still liveliest despite the softer overall market. Buyers in this range should read our first-time buyer guide before touring, because the loan structure often matters more than the price tag at this level.
What Is Driving Las Vegas Home Values in 2026?
Even with inventory building, prices have not cracked — and the reasons are structural. The three biggest supports under Las Vegas values right now:
Population growth. According to the U.S. Census Bureau, Clark County adds tens of thousands of residents a year, with California migration the largest single stream. That organic demand is what keeps a 7-month supply from turning into a price slide. People keep arriving; they all need somewhere to live.
Employment breadth. Per the Bureau of Labor Statistics, the Las Vegas metro payroll base has broadened beyond gaming into healthcare, logistics, and light manufacturing — wage bands from roughly $55,000 to $120,000 that qualify buyers squarely in the $400,000-$900,000 range where most inventory sits.
Cash and equity buyers. A meaningful share of Las Vegas transactions close in cash — many from California relocators arriving with six-figure equity from a coastal sale. Cash buyers do not flinch at a 7% mortgage rate, and they put a floor under prices that a purely financed market would lack. According to the Clark County Assessor, the parcel record shows steady out-of-state ownership growth across the newer master plans, consistent with that migration equity story.
Nevada's zero state income tax amplifies all three. A California household earning $200,000 keeps an extra $15,000-$20,000 a year simply by relocating — money that routinely becomes a bigger down payment or a higher purchase price than the same family could carry back home.
How Do Mortgage Rates Shape the 2026 Price Path?
Rates are the swing variable, and Las Vegas has repeatedly defied the textbook. Conventional wisdom says higher rates push prices down; instead, supply constraints and cash activity have kept the valley's prices climbing through the entire rate-hike cycle. According to the Freddie Mac Primary Mortgage Market Survey, the 30-year fixed has held in a 6.5-7.0% band, with FHA and VA products running 20-40 basis points cheaper and jumbo loans slightly higher.
The dollars-and-cents math is what buyers actually feel:
| Scenario | Loan Amount | Rate | Monthly P&I |
|---|---|---|---|
| Today (mid-2026) | $360,000 | 6.75% | $2,335 |
| If rates ease to 6.25% | $360,000 | 6.25% | $2,217 |
| If rates ease to 6.00% | $360,000 | 6.00% | $2,158 |
| 2021 comparison | $316,000 | 3.00% | $1,332 |
A full point of rate relief saves roughly $177 a month — meaningful, but not transformative. The trap buyers fall into is waiting for that relief: lower rates pull sidelined buyers off the fence all at once, and in a supply-limited market that surge of demand can push prices up faster than the rate savings. If rates drift toward 6% while inventory stays elevated, I expect the current standoff to break in buyers' favor first, then flip as the backlog clears. Most forecasters see the 30-year holding in the 6.0-6.8% range through 2026.
Is Las Vegas Overvalued at Today's Prices?
It is a fair question with a nuanced answer. Measured against the local median household income near $70,000, a $450,000 median implies a price-to-income ratio around 6.4x — elevated versus the historical 4-5x norm. But that comparison misleads for four reasons: many buyers are dual-income households well above the median; California and out-of-state buyers arrive with equity that local income metrics never capture; cash buyers do not rely on local wages at all; and Nevada's zero income tax lifts real purchasing power 5-10% relative to taxed states.
Against peer metros, $450,000 still looks reasonable. A comparable home runs materially higher in Denver or any coastal California market, and Las Vegas delivers newer construction, resort amenities, and no state income tax for the money. The valley is not cheap the way it was in 2012 — but "overvalued" implies a bubble, and a bubble does not usually come with 7 months of visible inventory and buyers holding negotiating leverage. What we have is a fully-priced market that has simply run out of the artificial scarcity that powered the last surge.
How Does Las Vegas Compare to Other Sun Belt Markets?
Do not evaluate Las Vegas in isolation. Placing it beside Phoenix, Austin, and Nashville calibrates whether our +1.9% and 7-month supply are strong or soft in context. According to the National Association of REALTORS, most Sun Belt metros followed the same arc — post-pandemic correction, then stabilization — but the depth of the correction and the pace of recovery vary widely.
| Dimension | Las Vegas | Phoenix | Austin | Nashville |
|---|---|---|---|---|
| 2026 YoY price | +1.9% | +2% to +4% | 0% to +2% | +3% to +5% |
| Months of supply | ~7.4 | ~4-5 | ~6+ (oversupply) | ~4 |
| 2023-24 correction | Mild (-3% to +1%) | Moderate | Deep (-8% to -12%) | Shallow |
| State income tax | None | 2.5% flat | None | None |
| Primary demand engine | CA migration + cash | CA migration | Tech employment | Corporate relocation |
Las Vegas took a milder hit in 2023-2024 than Phoenix or Austin — partly because valley builders were more disciplined and the topography limits sprawl. Austin remains the cautionary tale: aggressive overbuilding plus a tech-hiring reversal produced double-digit declines in some neighborhoods. Las Vegas does not face that overbuilding dynamic, which is why our correction was shallow and our recovery, though slow, has held. For a deeper read on how the valley's premier submarket is behaving, see my Summerlin housing market analysis.
What Should Buyers Do in This Market?
Here is the same direct advice I give clients across my desk. First, stop waiting for a 3% rate — that era is gone, and the plan that works is to buy at a price that fits your budget and refinance later if rates fall. Second, use your new leverage. With 7 months of supply, you can reasonably ask for closing-cost credits, a rate buydown, or a repair allowance — concessions that were unthinkable in 2021. Third, get fully underwritten before you tour, not just pre-qualified; in the still-competitive $400,000-$550,000 band, financing certainty wins multi-offer situations.
The window of buyer leverage is real, but it is not permanent. If rates ease and the sidelined demand floods back, today's negotiating room evaporates fast. Buyers who act while inventory is deep and sellers are motivated capture the best of both worlds — a near-peak asset bought on soft-market terms. Start with a lender conversation and a live homes-for-sale search, then have us map specific listings against your budget: call (702) 637-1759 or reach the team directly.
What Should Sellers Know About Pricing Strategy?
In a market where asking prices sit $28,000 above sold prices, pricing discipline is everything. Four rules I give every listing client:
- Price to the last 30 days of comps, not last spring's peak. The market has moved; stale comps produce overpriced listings that sit and then chase the market down through reductions.
- List at or just below market. A sharply-priced home still draws multiple offers even in a 7-month-supply market; an aspirational price draws crickets and a stigma.
- Adjust for condition. 2026 buyers are selective. Homes needing major work should be priced 5-10% below turn-key comps, not at parity.
- Bring incentives to the table. Offering a 2/1 buydown or a closing-cost credit can attract buyers without cutting your net — and it competes directly with the builder incentives down the street.
The equity math still favors sellers who bought before 2020: a homeowner who purchased near the 2015-2019 average of $250,000-$280,000 is sitting on well over $150,000 in gains, and Nevada's lack of a state income tax means more of those proceeds stay in your pocket than in almost any coastal market. For a full walk-through of the listing process, start at our seller resource hub or request a specific home valuation.
Where Are Las Vegas Prices Headed Through 2027?
I do not own a crystal ball, but the fundamentals point to continued modest movement rather than a dramatic break in either direction. My base case for the Las Vegas metro median at the end of 2027 is $455,000-$475,000 — roughly 1-5% above today, reflecting the tug-of-war between durable migration demand and elevated inventory. The upside variables are rate cuts below 6%, a fresh wave of California equity buyers, or a major employer announcement; the downside risks are a national recession or rates spiking back above 7.5%, which would push supply toward 9-plus months and finally force nominal price softening.
The likeliest path is a flat-to-gently-rising median with the composition of the market doing the real work: entry submarkets like North Las Vegas and Aliante staying tight and appreciating fastest, while the luxury and high-rise tiers move on their own cash-driven clock. According to the Federal Housing Finance Agency, Nevada's index has tracked this deceleration precisely, and I expect that pattern to persist into 2027. Whatever the metro median does, the right move is always parcel-specific — which is exactly why the buyers and sellers who work with an agent who reads live data outperform those trading on headlines. If you are weighing 2026 against 2027, the best-agent decision framework and our cost-of-ownership breakdown are the two guides I point people to first.
Frequently Asked Questions
What is the median home price in Las Vegas right now?
The metro median existing-home price is about $449,676 over the trailing 90 days, according to Greater Las Vegas REALTORS closed-sale data pulled live for this update. That is up 1.9% from $441,275 in the same window a year ago, placing the median within roughly 2% of the all-time high. The median asking price on active listings is higher, near $478,025, which reflects sellers still anchored to peak pricing while buyers negotiate them down.
Are Las Vegas home prices going up or down in 2026?
They are going up, but only modestly — a 1.9% year-over-year gain, well below the 15-20% surges of 2021-2022 and below the long-run 3-4% norm. The more important shift is on the inventory side: active listings have roughly tripled year over year to about 12,500, pushing the metro to around 7 months of supply. Prices are near record highs while conditions have softened into buyer-leaning territory — an unusual combination that rewards careful timing.
Is Las Vegas a buyer's or seller's market in 2026?
On the metro numbers, it has tipped toward a buyer's market: roughly 7.4 months of supply is above the six-month line that traditionally separates the two. Buyers now have real room to negotiate credits, rate buydowns, and repairs. That said, the strongest value submarkets — North Las Vegas, Aliante, Mountain's Edge — still clear in the low-20-day range and behave like balanced markets, so leverage varies by neighborhood and price band.
What is the most affordable area to buy in Las Vegas?
North Las Vegas leads on value with a 90-day median near $425,000, and Boulder City sits lower at about $399,000, though its inventory is small and moves slowly (a 43-day median). Aliante in North Las Vegas ($439,900) and Mountain's Edge in the southwest ($476,000) offer newer suburban product a notch up. These areas give first-time buyers a foothold below the $450,000 metro median.
How much do luxury homes cost in Las Vegas?
The luxury tier — homes above $1 million — runs from roughly $1 million for gated homes in Summerlin and Henderson to well past $5 million for custom estates in The Ridges, MacDonald Highlands, and Ascaya. This segment has been the valley's steadiest performer because cash and equity buyers are largely insulated from mortgage rates. You can browse the range on our luxury communities and guard-gated communities hubs.
How much income do I need to buy a median-priced Las Vegas home?
To comfortably carry the $450,000 metro median with 10% down at current rates, a household generally needs income around $105,000-$115,000, depending on debts, taxes, insurance, and HOA. Buyers targeting the $375,000-$400,000 entry band in North Las Vegas can qualify closer to $85,000-$90,000. FHA financing lowers the down payment but adds mortgage insurance, so the income requirement lands in a similar range.
Will home prices drop in Las Vegas in 2026 or 2027?
A sharp drop is not the base case. With migration demand intact and cash buyers providing a floor, the most likely path is a flat-to-gently-rising median through 2027 — my base case is $455,000-$475,000 by the end of 2027. The real risks that could force nominal softening are a national recession or mortgage rates spiking back above 7.5%, either of which would push supply past nine months. Absent those shocks, expect a slow market rather than a falling one.
Disclaimer: This article is for informational purposes only and does not constitute financial or investment advice. Price data is approximate, pulled from the live GLVAR MLS feed and publicly available reports as of the update date. Past market performance does not guarantee future results.
About the Author: Chris Nevada is the owner of Nevada Real Estate Group, brokered by LPT Realty, providing pricing analysis and market guidance across the Las Vegas valley. License S.181401.
Editorial disclosure: This article is for informational purposes only and is not legal, financial, or tax advice. Market data sourced from Greater Las Vegas REALTORS, the U.S. Census Bureau, the Bureau of Labor Statistics, Clark County, Freddie Mac, and the FHFA as of July 2026. Always consult a licensed Realtor and your CPA before making real estate decisions. Chris Nevada is a licensed Nevada Realtor (S.181401) with Nevada Real Estate Group.
Nevada Real Estate Group | LPT Realty Phone: (702) 637-1759 License: S.181401 8945 W Russell Rd #170, Las Vegas, NV 89148 nevadarealestategroup.com
Which Sources Inform This Las Vegas Home Price Analysis?
According to Greater Las Vegas REALTORS, the median price, closed-sale volume, days-on-market, and active-inventory figures in this analysis come from the GLVAR MLS feed pulled live on the update date and cross-checked against GLVAR's monthly statistical releases. Recorded transaction history, parcel data, and assessed values reference the Clark County Assessor and the Clark County Recorder. License and brokerage verification draws from the Nevada Real Estate Division public licensee database.
Macro housing context references the U.S. Census Bureau American Community Survey and county population estimates, the Bureau of Labor Statistics Las Vegas-Henderson-Paradise MSA employment data, the Federal Housing Finance Agency House Price Index, and the Bureau of Economic Analysis state personal-income data. The mortgage-rate environment uses the Freddie Mac Primary Mortgage Market Survey weekly rate series and Mortgage Bankers Association application data.
Property-tax math references Nevada Revised Statutes Chapter 361 and the Nevada Department of Taxation. Builder permit activity references the Clark County Department of Building, and peer-market context draws on the National Association of REALTORS metro reports. If you would like to translate any of this to your specific situation, call (702) 637-1759 or browse the team's about page. Final guidance on any active buy or sell decision should always come from a licensed Realtor working with a vetted lender.