
Ask ten Las Vegas agents which community is "hottest" and you will get ten opinions and no numbers. So I pulled the numbers. Every closing recorded in the Las Vegas MLS between September 19, 2025 and September 18, 2026, across Las Vegas, Henderson, North Las Vegas and Boulder City, was grouped by the subdivision name on its plat and rolled up into the master plan it belongs to. The result is a ranking of 31 communities by how many homes actually changed hands, not by how many billboards each developer bought.
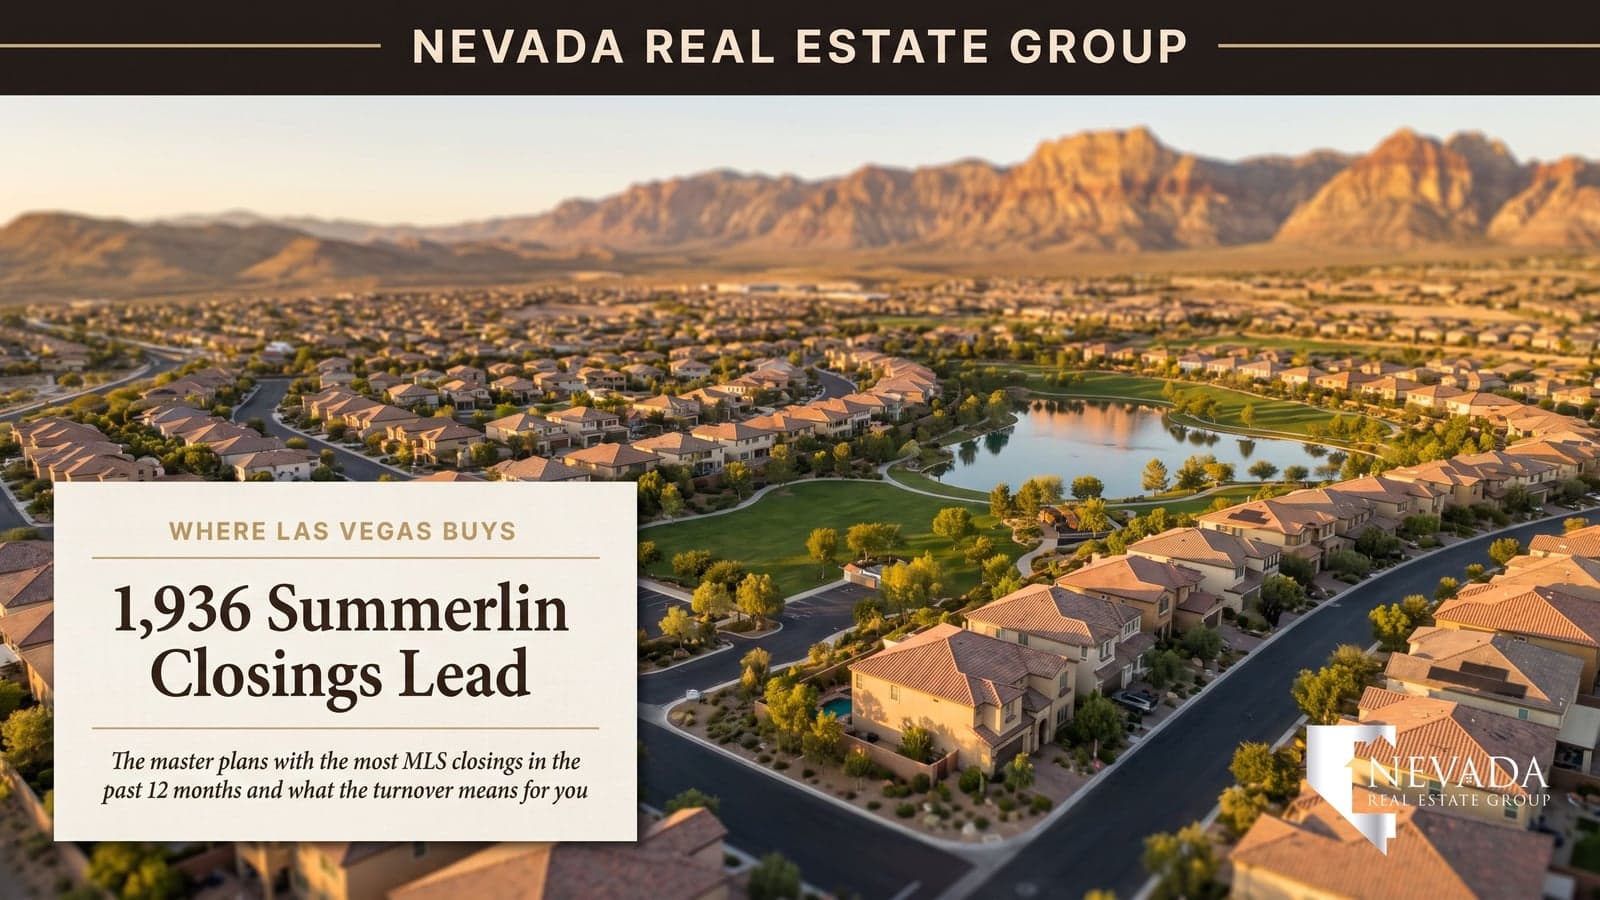
Summerlin wins, and it is not close: 1,936 closings, more than Cadence, Anthem and Sun City Summerlin added together. But the more useful stories sit further down the table. Cadence closed 633 homes and 63% of them were built in 2025 or later. The Villages at Tule Springs carried 27 active listings against 177 closings, a 1.8-month supply that is the tightest of any community on the list. And Lake Las Vegas, with 259 listings against 264 sales, shows what the opposite of a hot community looks like at 11.8 months of supply. This is Las Vegas MLS data pulled through Repliers on September 19, 2026; the window, the grouping method and what the count leaves out are spelled out below.
Summerlin is the top-selling community in the Las Vegas valley with 1,936 MLS closings in the 12 months ending September 18, 2026, followed by Cadence at 633, Anthem at 548 and Sun City Summerlin at 518. Tule Springs is the tightest market at 1.8 months of supply; Lake Las Vegas is the slowest at 11.8. Buyers get leverage above seven months of supply; sellers in tight communities should price to the last 90 days of closings.
- Summerlin closed 1,936 homes at a $630,000 median, 7.1% of every MLS closing in the four cities.
- Cadence ran second at 633 closings with 63% built in 2025 or later, at a $485,000 median.
- Tule Springs had 27 active listings against 177 closings, a 1.8-month supply; Lake Las Vegas sits at 11.8.
- Builder-direct sales never hit the MLS, so Cadence, Tule Springs and Inspirada are undercounted here.
- Sellers in communities above six months of supply should price against settled closings, not neighbors' asks.
Which Las Vegas Communities Sold the Most Homes in the Past 12 Months?
The table below is the heart of this report. It ranks every master plan and large community that recorded meaningful MLS closings between September 19, 2025 and September 18, 2026, and pairs each count with the median sold price, price per square foot, median days on market, the active listings on September 18, 2026, months of supply (actives divided by the monthly closing pace) and the share of closings that were built in 2025 or later. Land sales are excluded; condos, townhomes and single-family homes are all included.
| Rank | Community | Closings | Median sold | $ per sq ft | Median DOM | Active Sep 18 | Months of supply | Built 2025+ |
|---|---|---|---|---|---|---|---|---|
| 1 | Summerlin (all villages) | 1,936 | $630,000 | $319 | 34 | 880 | 5.5 | 10% |
| 2 | Cadence (Henderson) | 633 | $485,000 | $248 | 40 | 248 | 4.7 | 63% |
| 3 | Anthem (Henderson, all villages) | 548 | $649,990 | $307 | 34 | 219 | 4.8 | 0% |
| 4 | Sun City Summerlin | 518 | $450,000 | $301 | 34 | 204 | 4.7 | 0% |
| 5 | Sun City Anthem | 343 | $585,000 | $300 | 36 | 126 | 4.4 | 0% |
| 6 | Inspirada (Henderson) | 332 | $559,900 | $256 | 34 | 143 | 5.2 | 14% |
| 7 | Skye Canyon (NW Las Vegas) | 308 | $535,000 | $263 | 34 | 123 | 4.8 | 45% |
| 8 | Southern Highlands | 305 | $630,000 | $262 | 35 | 128 | 5.0 | 0% |
| 9 | Lake Las Vegas | 264 | $659,900 | $329 | 59 | 259 | 11.8 | 34% |
| 10 | Green Valley (Henderson) | 262 | $485,000 | $269 | 22 | 111 | 5.1 | 0% |
| 11 | Aliante (North Las Vegas) | 234 | $417,000 | $240 | 34 | 86 | 4.4 | 0% |
| 12 | Boulder City (all) | 227 | $475,000 | $283 | 36 | 127 | 6.7 | 2% |
| 13 | Tule Springs / Villages at Tule Springs (NLV) | 177 | $547,240 | $224 | 18 | 27 | 1.8 | 67% |
| 14 | Mountains Edge | 167 | $455,000 | $234 | 44 | 75 | 5.4 | 0% |
| 15 | MacDonald Ranch / Highlands | 145 | $1,775,000 | $500 | 34 | 87 | 7.2 | 12% |
| 16 | Peccole Ranch / Queensridge | 136 | $730,000 | $297 | 41 | 57 | 5.0 | 0% |
| 17 | Rhodes Ranch | 126 | $535,000 | $245 | 28 | 76 | 7.2 | 0% |
| 18 | Lone Mountain (area) | 120 | $440,000 | $248 | 28 | 63 | 6.3 | 0% |
| 19 | Seven Hills | 118 | $655,000 | $298 | 31 | 66 | 6.7 | 0% |
| 20 | Silverado Ranch | 116 | $437,000 | $251 | 33 | 55 | 5.7 | 1% |
| 21 | Providence (NW Las Vegas) | 112 | $499,000 | $231 | 27 | 46 | 4.9 | 0% |
| 22 | Eldorado (North Las Vegas) | 112 | $442,000 | $231 | 18 | 30 | 3.2 | 2% |
| 23 | Sun City Aliante | 99 | $374,000 | $264 | 25 | 28 | 3.4 | 0% |
| 24 | Stallion Mountain | 88 | $385,000 | $240 | 42 | 35 | 4.8 | 0% |
| 25 | Los Prados | 83 | $435,000 | $231 | 29 | 26 | 3.8 | 0% |
| 26 | Painted Desert | 64 | $450,000 | $248 | 36 | 25 | 4.7 | 0% |
| 27 | Spanish Trail | 64 | $670,000 | $316 | 48 | 62 | 11.6 | 0% |
| 28 | Desert Shores | 46 | $370,000 | $222 | 43 | 21 | 5.5 | 0% |
| 29 | Centennial Hills | 44 | $479,900 | $242 | 28 | 26 | 7.1 | 9% |
| 30 | The Lakes | 28 | $479,900 | $242 | 34 | 11 | 4.7 | 0% |
| 31 | Symphony Park / Downtown condos | 22 | $365,000 | $332 | 90 | 51 | 27.8 | 0% |
Three things jump out. First, scale: the four cities recorded 27,376 MLS home closings in the window at a $445,000 median, and Summerlin alone accounts for 7.1% of them. The top five communities together, Summerlin, Cadence, Anthem, Sun City Summerlin and Sun City Anthem, closed 3,978 homes. Second, Henderson punches far above its size. The city recorded 5,562 closings in total, and six Henderson master plans on this list, Cadence, Anthem, Sun City Anthem, Inspirada, Lake Las Vegas and Green Valley, account for 2,382 of them, roughly 43% of everything that sold in the city. Third, the two 55-plus giants, Sun City Summerlin and Sun City Anthem, closed 861 homes between them with zero new construction.
The months-of-supply column is where a ranking turns into advice. Anything under four months, Tule Springs at 1.8, Eldorado at 3.2, Sun City Aliante at 3.4, Los Prados at 3.8, is a seller's community where correctly priced homes go under contract in two to three weeks. Anything above seven, Lake Las Vegas at 11.8, Spanish Trail at 11.6, Rhodes Ranch and MacDonald Ranch at 7.2, Centennial Hills at 7.1, is a community where buyers have the leverage and sellers need to price below the visible competition. For the full metro view, September's Las Vegas market report covers the settled-month numbers behind this ranking.
Why Does Summerlin Close More Homes Than Any Other Master Plan?
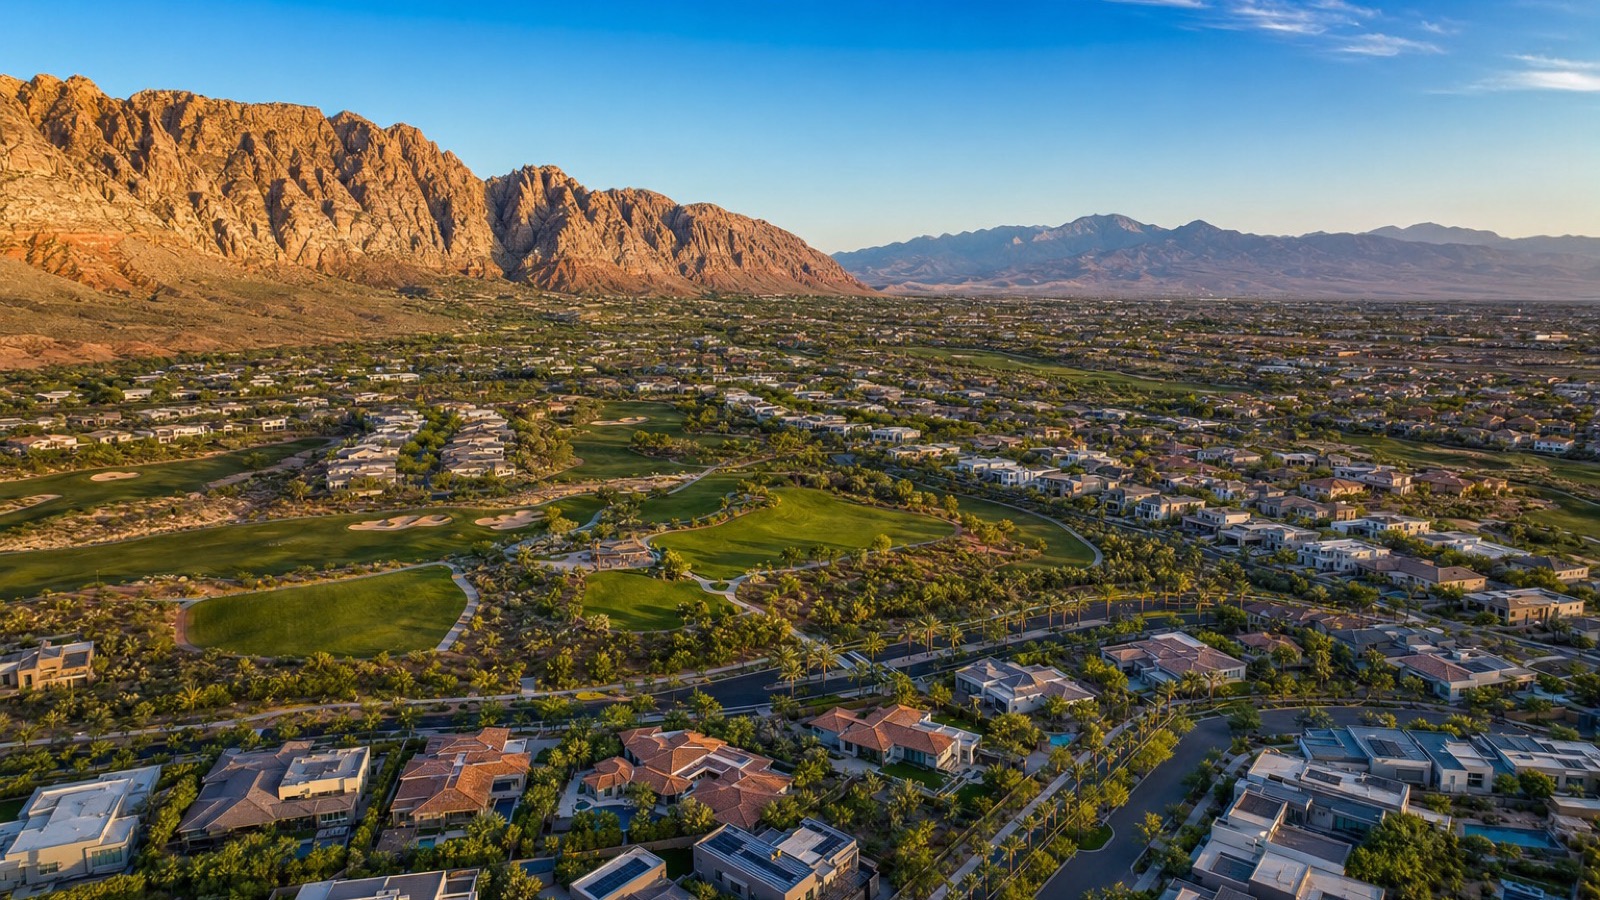
Because Summerlin is not one community; it is a city inside a city, and its 1,936 closings are the sum of dozens of villages that were built across four decades. According to Howard Hughes Communities, the developer, Summerlin has been one of the nation's best-selling master-planned communities for more than three decades and now contains more than 300 parks and over 200 miles of trails. That longevity is the whole explanation: a master plan that has been selling homes since the early 1990s has thousands of original owners reaching the age where they downsize, and every one of those resales lands in the same MLS grouping as a new home in Summerlin West. Our Summerlin new-construction cost guide explains why those new homes cost more per square foot.
The numbers bear that out. Summerlin's new-build share is only 10% of closings, roughly 190 homes built in 2025 or later out of 1,936. The other 1,740 or so were resales, and two Sun City Summerlin plats alone, "Sun City Las Vegas" and "Sun City Summerlin" in ZIP 89134, contributed 254 and 204 closings, the two largest individual subdivisions in the entire valley. Sun Colony at Summerlin, Siena's age-qualified sibling in 89135, added 98 more at a $672,500 median. Age-restricted resale, not new construction, is the engine of Summerlin's volume.
The price tells the second half of the story. Summerlin's $630,000 median sold price and $319 per square foot sit well above the $445,000 valley median, and its 34-day median time to contract is only four days slower than the metro's 30. It is selling more homes than anyone else at a 42% premium and nearly the same speed. With 880 active listings on September 18, 2026 and a closing pace of about 161 a month, Summerlin carries 5.5 months of supply. That is a fully functioning market big enough to absorb a village's worth of new listings every month. If you want to see the current board, the Summerlin homes for sale page pulls the live listings.
What Makes Cadence the Fastest-Growing Seller in Henderson?
Cadence closed 633 homes in the 12 months ending September 18, 2026, and 63% of them, about 399 homes, were built in 2025 or later. No other community in the top ten comes close to that share; the next-highest large community is Skye Canyon at 45%. Cadence is, in other words, the place where Henderson's new construction is actually being sold, and the MLS is only catching part of it. The subdivision table further down shows why: the single plat "Cadence Neighborhood 5 Village Parcel C-2" closed 65 homes at a $483,740 median with 61 of them brand new, and "Cadence 7-A-15, 16 Cadence N7 Phase 2" closed 52 homes at $556,370, all 52 new. Those are builders listing their spec homes on the MLS to reach agents and their buyers.
According to Cadence's own site, the community's builder roster includes Beazer Homes, Century Communities, D.R. Horton, Lennar, Richmond American Homes, Taylor Morrison and Woodside Homes, its Central Park covers nearly 50 acres, and the developer describes Cadence as one of the top ten best-selling master-planned communities in the nation. Seven active builders in one master plan is the practical reason it out-closes every other Henderson community.
The price is the other half of the appeal. Cadence's $485,000 median is $145,000 below Summerlin's and $165,000 below Anthem's, and at $248 per square foot it is the second-cheapest community per foot in the top ten, ahead of only Tule Springs. For a buyer who wants a new home with a warranty, a park system and a Henderson address, Cadence delivers it at roughly the valley's median price. The trade-off is time: at a 40-day median time to contract, Cadence resales take about a week longer than the metro to sell, because the resale is competing against the builder's new inventory three streets over. With 248 active listings and a pace of about 53 closings a month, supply sits at 4.7 months, comfortably balanced. Henderson's citywide picture is in the Henderson market report for September.
Why Are Tule Springs and Skye Canyon the Tightest Markets in the Valley?
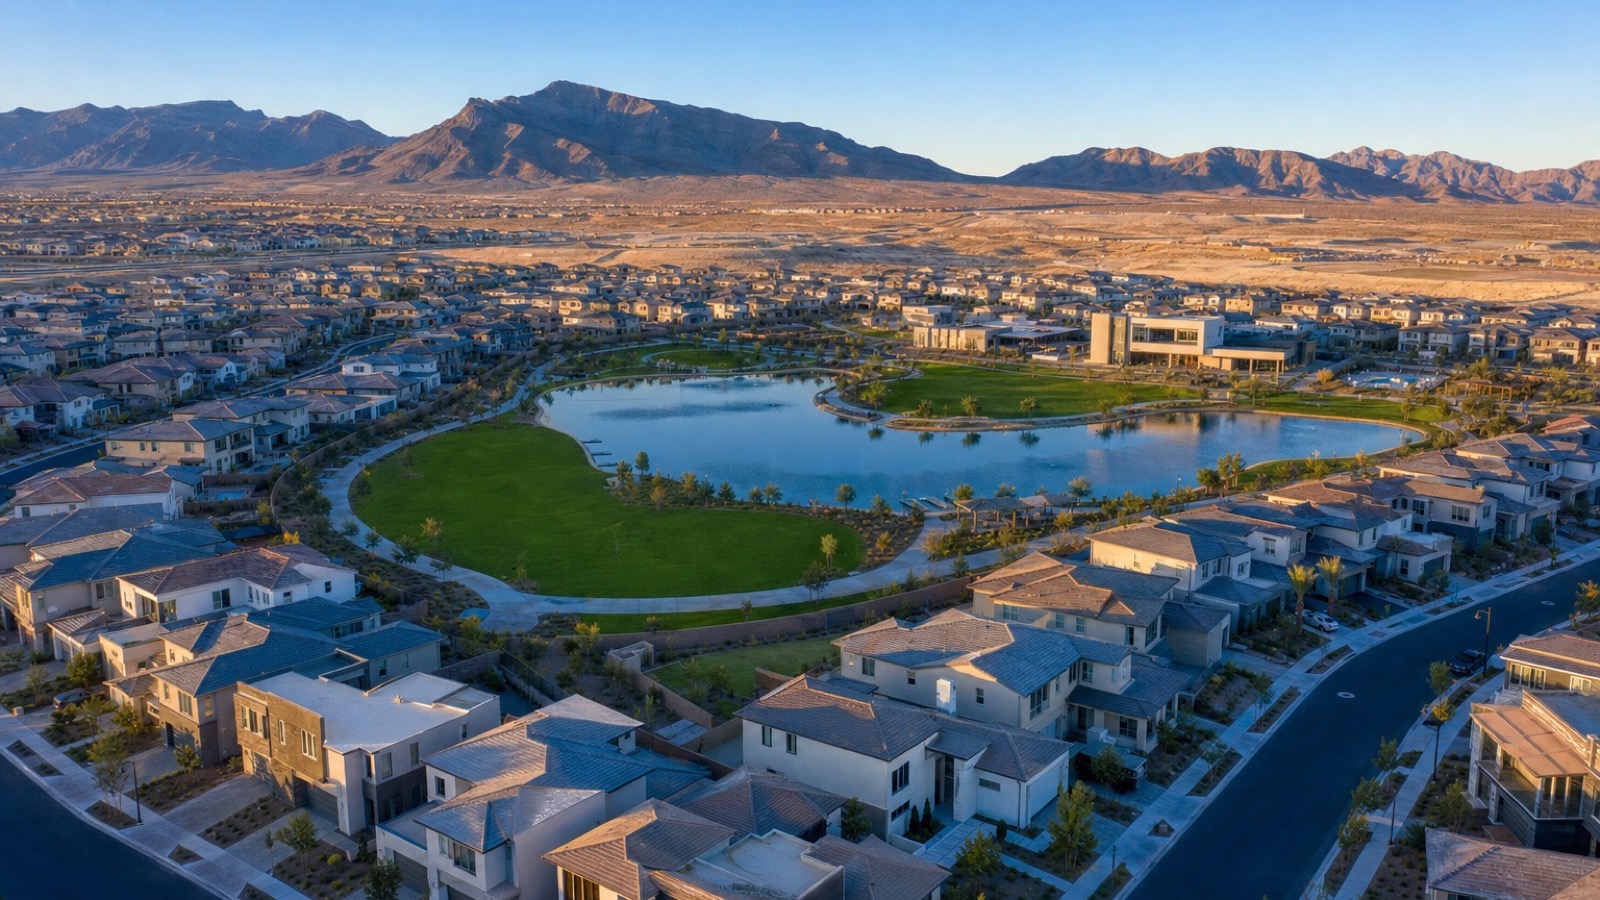
The Villages at Tule Springs in North Las Vegas is the community that should worry any buyer who likes to negotiate. It closed 177 homes in the 12 months ending September 18, 2026, at a $547,240 median, and on September 18 it had just 27 active listings. That is 1.8 months of supply, the lowest of any community on the list, with a median of 18 days from listing to contract, the fastest tie on the board alongside Eldorado. Two-thirds of those closings, 67%, were homes built in 2025 or later. This is a builder-driven community where the resale market barely exists yet.
Tule Springs also has the lowest price per square foot in the top 15 at $224, against $319 in Summerlin and $248 in Cadence. That is the North Las Vegas discount, and it is why a $547,240 median buys a materially larger house there than the same money buys in Henderson. The cluster around it is just as tight: Eldorado closed 112 homes at $442,000 with 3.2 months of supply and an 18-day median, Sun City Aliante closed 99 at $374,000 with 3.4 months, and Aliante itself closed 234 homes at $417,000 with 4.4 months. Every one of those is under the valley's average supply, which is why North Las Vegas keeps showing up as the fastest sub-market in our monthly reports; ZIP 89081 recorded a 19-day median across 539 closings, and 89031 a 21-day median across 887.
Skye Canyon is the northwest Las Vegas version of the same story. It closed 308 homes at a $535,000 median, 45% of them built in 2025 or later, with 4.8 months of supply and a 34-day median. According to Skye Canyon's site, the community sits off US-95 at Skye Canyon Park Drive, its builders are Century Communities, Toll Brothers and LGI Homes, and its amenities include Skye Fitness with a junior Olympic pool and the Skye Center social hub. The single plat "Skye Canyon Parcel 506 Phase 2A" closed 36 homes at $534,000, all 36 new. Between Skye Canyon, Providence at 112 closings and 4.9 months, and the ZIP 89166 total of 710 closings, the northwest corridor is the closest thing Las Vegas proper has to what Cadence is for Henderson.
How Do Anthem, Sun City Anthem and Inspirada Keep Henderson on the Board?
Henderson's foothills are where its established money changes hands. Anthem, counted across every recorded village on the hillside, closed 548 homes in the 12 months ending September 18, 2026 at a $649,990 median and $307 per square foot, with a 34-day median and 4.8 months of supply. Not one of those closings was a home built in 2025 or later. Anthem is a finished master plan, so its volume is pure resale: every buyer there chose a 15-to-25-year-old home over a new one down the hill.
Sun City Anthem, the Del Webb age-qualified community that shares the hillside, is tracked as its own row at 343 closings, a $585,000 median and 4.4 months of supply. The subdivision table splits it across two ZIPs, 120 closings in 89052 at a $640,000 median and 113 in 89044 at $579,000, which makes it the third-largest single plat name in the valley after the two Sun City Summerlin entries. Add Sun City Anthem's 343 to Anthem's 548 and the hillside closed 891 homes, second only to Summerlin as a geographic cluster. Sun City Anthem is also the reason ZIP 89052 posted 906 closings at a $635,000 median, the second-busiest ZIP in the four cities.
Inspirada is the newer, cheaper alternative at the bottom of the same slope. It closed 332 homes at a $559,900 median and $256 per square foot, 14% of them built in 2025 or later, with a 34-day median and 5.2 months of supply. Inspirada has passed the point where builders dominate its closings and is now mostly a resale community of homes built in the 2010s, which is why its new-build share is a fifth of Cadence's despite the two being Henderson's youngest master plans. ZIP 89044, which covers Inspirada and the southern edge of Anthem, recorded 741 closings at a $533,000 median. Across the Henderson homes for sale board, those three communities plus Cadence are where most of the city's activity is concentrated on any given week.
Why Is Lake Las Vegas the Counter-Example at 11.8 Months of Supply?
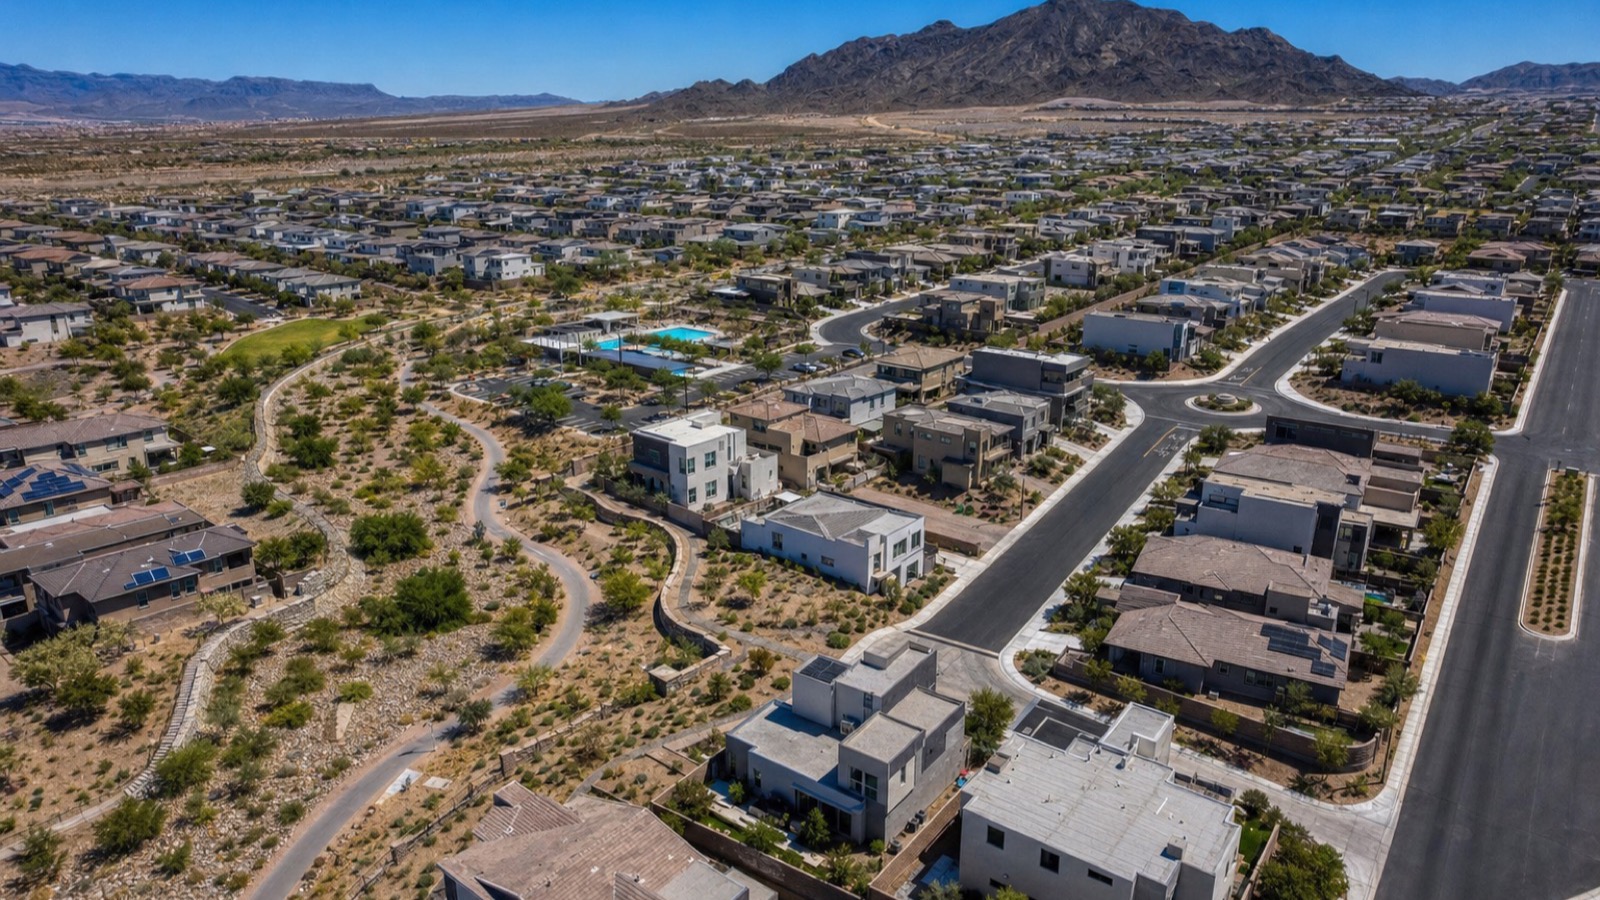
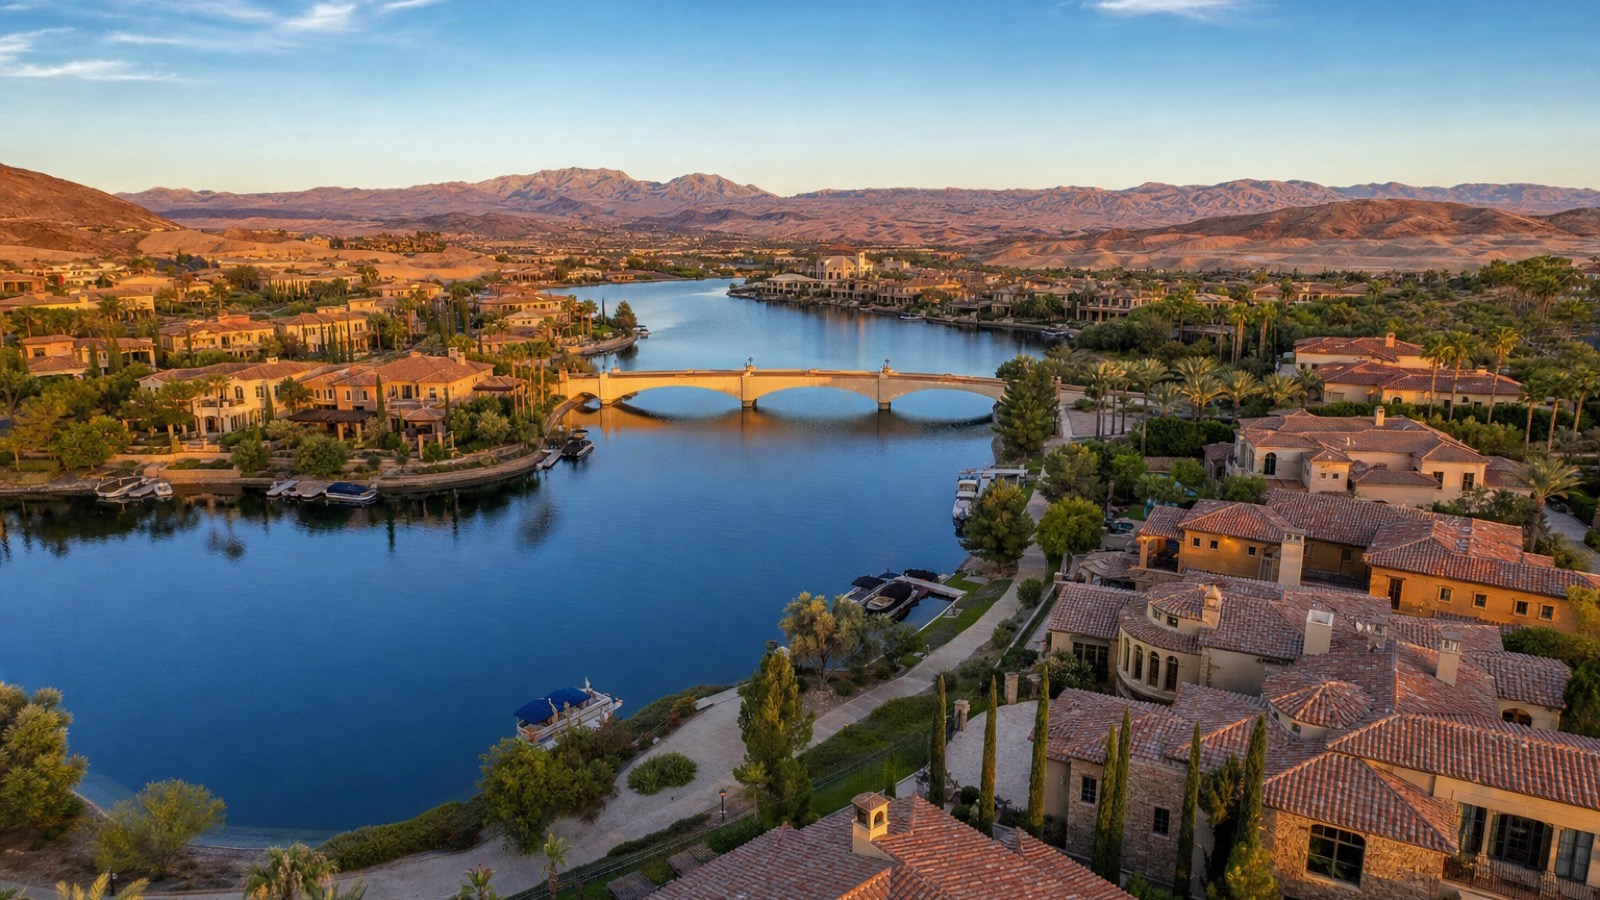
Lake Las Vegas ranks ninth by closings, 264 in the 12 months ending September 18, 2026, and on paper it looks healthy: a $659,900 median, the highest price per square foot in the top 14 at $329, and a respectable 34% new-build share. Then you look at the active column. On September 18, 2026 Lake Las Vegas had 259 homes for sale, almost exactly one listing for every closing in the previous year. That is 11.8 months of supply, more than double Summerlin's 5.5 and six times Tule Springs' 1.8. Its median time to contract is 59 days, the slowest of any community in the top 30 other than downtown's Symphony Park condos at 90.
Two things explain it. The first is that Lake Las Vegas is a resort community with a resort's buyer pool: second-home and retirement buyers who shop slowly, come from out of state, and are the first to pause when rates rise. According to Freddie Mac's Primary Mortgage Market Survey, the 30-year fixed averaged 6.95% for the week ending September 17, 2026, and a discretionary purchase at $659,900 is exactly the kind of decision that 6.95% money delays. The second is builder inventory. According to Lake Las Vegas's site, six builders are active there, Richmond American, Lennar, Toll Brothers, Blue Heron, Del Webb and Taylor Morrison, and the community sits 25 minutes from the Strip. Six builders releasing phases into a market that closes 22 homes a month produces standing inventory.
For buyers, Lake Las Vegas is the clearest leverage on this list: 259 listings, 59-day medians, and sellers who have often already cut. For sellers, it is the community where "priced like my neighbor" is the most dangerous strategy in the valley, because your neighbor's price is why your neighbor is still listed. Spanish Trail, at 11.6 months and a 48-day median across 64 closings, tells the same story on the west side with older guard-gated golf homes. Lake Las Vegas shares ZIP 89011 with Cadence, which is why 89011 leads every ZIP with 1,234 closings and 703 actives.
Which ZIP Codes Closed the Most Homes in Las Vegas and Henderson?
Master plans are how buyers think; ZIP codes are how appraisers and lenders think. The table below ranks the 15 busiest ZIPs in the four cities by MLS closings in the 12 months ending September 18, 2026, with the median sold price, price per square foot, median days on market and the active listings on September 18. It is the same data cut a different way, and it exposes things the master-plan grouping hides.
| ZIP | City | Closings | Median sold | $ per sq ft | Median DOM | Active Sep 18 |
|---|---|---|---|---|---|---|
| 89011 | Henderson | 1,234 | $480,000 | $257 | 40 | 703 |
| 89052 | Henderson | 906 | $635,000 | $297 | 34 | 384 |
| 89031 | North Las Vegas | 887 | $419,150 | $235 | 21 | 255 |
| 89084 | North Las Vegas | 860 | $450,000 | $234 | 25 | 284 |
| 89044 | Henderson | 741 | $533,000 | $267 | 34 | 280 |
| 89134 | Las Vegas | 732 | $492,500 | $300 | 33 | 279 |
| 89138 | Las Vegas | 720 | $769,750 | $335 | 39 | 357 |
| 89166 | Las Vegas | 710 | $510,000 | $251 | 33 | 326 |
| 89141 | Las Vegas | 699 | $526,248 | $252 | 31 | 285 |
| 89148 | Las Vegas | 686 | $485,000 | $250 | 30 | 300 |
| 89117 | Las Vegas | 671 | $510,000 | $259 | 30 | 317 |
| 89135 | Las Vegas | 664 | $840,000 | $363 | 34 | 312 |
| 89129 | Las Vegas | 660 | $419,500 | $247 | 28 | 314 |
| 89178 | Las Vegas | 653 | $478,000 | $241 | 39 | 224 |
| 89108 | Las Vegas | 647 | $365,000 | $243 | 23 | 272 |
The busiest ZIP in the four cities is 89011 in east Henderson, home to both Cadence and Lake Las Vegas, with 1,234 closings and 703 active listings. Its $480,000 median blends Cadence's new-build pace with Lake Las Vegas's slow resort resales. Second is 89052, the Anthem and Sun City Anthem hillside, at 906 closings and a $635,000 median. Third and fourth are both North Las Vegas: 89031 at 887 closings with a 21-day median, and 89084, which includes Aliante and the Tule Springs corridor, at 860. Those two ZIPs alone closed 1,747 homes at medians of $419,150 and $450,000.
The Summerlin ZIPs show the price gradient inside one brand. 89134, the Sun City Summerlin ZIP, closed 732 homes at $492,500; 89138 in Summerlin West closed 720 at $769,750; and 89135, Summerlin South with The Ridges and Red Rock Country Club, closed 664 at $840,000, the highest median of any ZIP in the top 15 at $363 per square foot. Together the three closed 2,116 homes, more than the 1,936 attributed to Summerlin because the ZIPs also include non-Summerlin subdivisions along their edges. At the other end, 89108 in the northwest closed 647 homes at a $365,000 median with a 23-day median, the fastest-selling affordable ZIP in Las Vegas proper. Live ZIP-level detail for every one of these is on the market report hub.
Which Individual Subdivisions Recorded the Most Closings?
Under every master plan sits a list of recorded plat names, and ranking those directly tells you which specific neighborhoods turned over the most. The table below lists the 21 busiest plats by MLS closings in the 12 months ending September 18, 2026, with the ZIP, the median sold price and the number of those closings that were homes built in 2025 or later. Where a plat name is a builder's parcel label rather than a marketing name, it is shown as recorded.
| Subdivision (plat) | ZIP | Closings | Median sold | Built 2025+ |
|---|---|---|---|---|
| Sun City Las Vegas | 89134 | 254 | $490,000 | 0 |
| Sun City Summerlin | 89134 | 204 | $440,000 | 0 |
| Sun City Anthem | 89052 | 120 | $640,000 | 0 |
| Sun City Anthem | 89044 | 113 | $579,000 | 0 |
| Sun Colony at Summerlin | 89135 | 98 | $672,500 | 0 |
| Charleston Rainbow | 89145 | 86 | $405,000 | 0 |
| Del Webb Communities | 89012 | 80 | $425,000 | 0 |
| Cadence Neighborhood 5 Village Parcel C-2 | 89011 | 65 | $483,740 | 61 |
| Spring Valley | 89147 | 64 | $417,000 | 0 |
| Red Rock Country Club at Summerlin | 89135 | 63 | $2,010,000 | 0 |
| Spring Mountain Ranch | 89143 | 60 | $430,000 | 0 |
| Runvee Hobart | 89081 | 56 | $385,000 | 0 |
| Cheyenne Valley | 89032 | 53 | $434,900 | 52 |
| Cadence 7-A-15, 16 Cadence N7 Phase 2 | 89011 | 52 | $556,370 | 52 |
| Northern Terrace at Providence | 89166 | 49 | $472,000 | 0 |
| Highlands Ranch | 89141 | 49 | $535,000 | 0 |
| Lynbrook | 89131 | 47 | $436,000 | 0 |
| Los Prados Phase 2 | 89130 | 45 | $433,000 | 0 |
| Desert Inn Mobile Estate 3 Amd | 89122 | 44 | $230,000 | 0 |
| Paradise Palms | 89169 | 43 | $475,000 | 0 |
| Skye Canyon Parcel 506 Phase 2A | 89166 | 36 | $534,000 | 36 |
Five of the top seven plats are age-qualified: the two Sun City Summerlin names, both Sun City Anthem entries, and Sun Colony at Summerlin, plus Del Webb Communities in Green Valley at 80 closings. That is 869 closings from 55-plus neighborhoods in seven plat rows, none of them new. If you are a buyer over 55, that is the deepest, most liquid inventory in the valley; if you are a seller in one of them, it means you have more direct competition than any other homeowner in Las Vegas, and our 55-plus communities page tracks each one. Sun City Summerlin alone, across its two plat names, closed 458 homes at medians of $490,000 and $440,000.
The new-construction plats are the mirror image. Cadence's two parcels, Cheyenne Valley in North Las Vegas (53 closings, 52 new, $434,900) and Skye Canyon's Parcel 506 (36 closings, all new) are the only rows in the top 21 with any material new-build count, and together they represent 201 new homes that builders chose to sell through the MLS. Red Rock Country Club is the outlier at the top of the price scale: 63 closings at a $2,010,000 median, the only seven-figure median in the table and a reminder that Summerlin's guard-gated golf communities have real turnover of their own. The Las Vegas homes for sale board carries every one of these subdivisions live.
How Do Price Per Square Foot and Days on Market Compare Across the Leaders?
Closings measure popularity. Price per square foot and days on market measure what that popularity costs you and how quickly you have to decide. The table below pulls the ten highest-volume communities plus the two supply extremes out of the master table and lines them up against the four-city benchmark of $445,000, a 30-day median and 27,376 closings. The columns are the dimensions a buyer actually trades off: what you pay per foot, how many days you have before a well-priced home is gone, and how many months of competing inventory a seller faces.
| Dimension | Summerlin | Cadence | Anthem | Sun City Summerlin | Sun City Anthem | Inspirada | Skye Canyon | Southern Highlands | Lake Las Vegas | Green Valley | Tule Springs | Spanish Trail |
|---|---|---|---|---|---|---|---|---|---|---|---|---|
| Median sold price | $630,000 | $485,000 | $649,990 | $450,000 | $585,000 | $559,900 | $535,000 | $630,000 | $659,900 | $485,000 | $547,240 | $670,000 |
| $ per square foot | $319 | $248 | $307 | $301 | $300 | $256 | $263 | $262 | $329 | $269 | $224 | $316 |
| Median days to contract | 34 | 40 | 34 | 34 | 36 | 34 | 34 | 35 | 59 | 22 | 18 | 48 |
| Months of supply | 5.5 | 4.7 | 4.8 | 4.7 | 4.4 | 5.2 | 4.8 | 5.0 | 11.8 | 5.1 | 1.8 | 11.6 |
| Built 2025 or later | 10% | 63% | 0% | 0% | 0% | 14% | 45% | 0% | 34% | 0% | 67% | 0% |
| Premium to four-city $445,000 median | +42% | +9% | +46% | +1% | +31% | +26% | +20% | +42% | +48% | +9% | +23% | +51% |
The per-foot column splits the list into three tiers. The $300-plus tier, Summerlin at $319, Lake Las Vegas at $329, Spanish Trail at $316, Anthem at $307 and the two Sun Cities at about $300, is where you pay for location, views and a brand. Sun City Summerlin's $301 on a $450,000 median is the most striking entry: small single-story homes on a west-side hillside sell for the same price per foot as Anthem's big two-stories, because the age-qualified buyer pool pays for the setting, not the square footage. The $250-to-$270 tier, Green Valley, Skye Canyon, Southern Highlands and Inspirada, is the valley's move-up mainstream. And the $224-to-$248 tier, Tule Springs and Cadence, is where a dollar buys the most house, because both are dominated by new homes on the east and north edges of the metro.
Days on market cluster at 34 to 36 for most of the list, a few days off the four-city median of 30: a correctly priced home in any large master plan goes under contract in about five weeks regardless of price point. The exceptions are the ones the supply column predicts. Green Valley's 22 days reflect an older, close-in Henderson neighborhood at a $485,000 median with only 5.1 months of supply; Tule Springs' 18 days reflect 1.8 months. Lake Las Vegas at 59 and Spanish Trail at 48 are the slow lanes, and both are slow for the same reason: more than 11 months of competing inventory. Across the Southern Highlands and Green Valley rows, note that neither has any new construction, and both still clear in 35 days or less, which is the signature of an established community whose resale demand does not depend on a builder's marketing budget.
What Does the New-Build Share Column Actually Measure, and What Does It Leave Out?
The last column in the master table is the share of each community's closings that were homes built in 2025 or later, and it is the column most likely to be misread. It measures new homes that were sold through the MLS: builder spec homes listed by the builder's in-house agent, quick move-ins co-listed with a brokerage, and, in a few cases, homes a buyer bought from the builder and resold within a year. It does not measure builder sales that were written at the sales office and never entered the MLS at all, and in a fast-selling master plan that is most of them.
The consequence is that every builder-heavy community on this list is undercounted. Cadence's 633 closings and 63% new-build share reflect roughly 399 new homes that hit the MLS; the true number of new homes that closed in Cadence in the 12 months ending September 18, 2026 is higher by every home its seven builders sold directly. The same is true of Tule Springs, where 67% of 177 MLS closings were new, of Skye Canyon at 45% of 308, of Inspirada at 14% of 332, and of Lake Las Vegas at 34% of 264. If you could add builder-direct contracts, Cadence would likely close the gap on Summerlin considerably, and Tule Springs would move well up the table. Conversely, the zero-percent communities, Anthem, the Sun Cities, Southern Highlands, Green Valley, Rhodes Ranch, are counted completely, because everything that sells there sells through an agent on the MLS.
Across the 9,600+ closings we've represented, the practical lesson for a buyer is that the MLS is a partial window on new construction: in Cadence, Tule Springs or Skye Canyon, the builder's inventory sheet and the MLS together are the full picture. The new construction hub lists the active builders by community. For a seller in one of those communities, the undercount cuts the other way: the builder's unlisted inventory is competition your MLS search will not show you, and it is priced with incentives that a resale cannot match, which is why Cadence resales take 40 days while Anthem resales take 34. The four-city total of 27,376 closings includes 2,349 homes built in 2025 or later, 9% of the whole, and that 9% is a floor, not the ceiling, on how much of the valley's demand is going to new homes.
Which of These Communities Fits Your Budget and Lifestyle?
The ranking tells you where people are buying; it does not tell you where you should. That depends on your budget, your commute, whether you want a new home, and how much negotiating room you need. Here is how the top-selling communities sort by those criteria, using the medians in the 12 months ending September 18, 2026 and the 6.95% 30-year rate Freddie Mac reported for the week ending September 17, 2026. Principal and interest on a 20%-down purchase at that rate runs about $6.62 per month for every $1,000 borrowed, so a $445,000 four-city median home carries roughly $2,357 a month before taxes, insurance and HOA.
If your budget is under $450,000, the list narrows quickly. Aliante at $417,000, Stallion Mountain at $385,000, Sun City Aliante at $374,000 for buyers over 55, Los Prados at $435,000, Silverado Ranch at $437,000, Lone Mountain at $440,000 and Eldorado at $442,000 all clear the bar, and all but Silverado Ranch and Lone Mountain sit under five months of supply, so expect competition on the well-priced ones. Stallion Mountain, Los Prados and Painted Desert at $450,000 are the three staffed-gate golf communities in that band, which is unusual value in a metro where gated usually means seven figures. A $385,000 Stallion Mountain purchase with 20% down carries about $2,039 a month in principal and interest at 6.95%.
If your budget is $450,000 to $600,000, you are in the heart of the market, and the choice is new versus established. Cadence at $485,000 and Tule Springs at $547,240 give you new construction and the lowest per-foot cost, at the price of a longer drive to the Strip corridor and a resale market that competes with the builder. Green Valley at $485,000, Rhodes Ranch at $535,000, Skye Canyon at $535,000, Inspirada at $559,900 and Sun City Anthem at $585,000 are the established alternatives, and Green Valley's 22-day median is the sign of a close-in Henderson neighborhood buyers still fight over. A $485,000 Cadence home at 20% down runs about $2,568 a month in principal and interest; a $547,240 Tule Springs home about $2,898. If you are a first-time buyer, most of this band sits under the $541,287 FHA floor for Clark County, which matters because it lets you into Cadence or Green Valley with 3.5% down. According to HUD's 2026 loan limits notice, that floor applies to every county in the metro.
If your budget is $600,000 and up, Summerlin and Southern Highlands at $630,000, Anthem at $649,990, Seven Hills at $655,000, Lake Las Vegas at $659,900 and Spanish Trail at $670,000 form the tier, and the supply column should drive the choice. Summerlin, Southern Highlands and Anthem sit at 4.8 to 5.5 months and clear in about five weeks; Lake Las Vegas and Spanish Trail sit above 11 months and give you real leverage on a home that may already have been cut once. Rhodes Ranch at 7.2 months is the guard-gated golf option in the southwest with the same leverage at a $535,000 median. The buying in Las Vegas and Henderson hubs break each of these down by neighborhood.
What Does High Turnover Mean for Your Price If You Are Selling?
A community that closes a lot of homes is a community with a lot of comparable sales, and comparable sales are what set your price whether you like it or not. In Summerlin, an appraiser has 1,936 closings from the past year to choose from; in Sun City Summerlin, 518 nearly identical single-story homes. That depth is good news if your home is priced correctly, because the buyer's lender will have no trouble supporting the value, and bad news if you are hoping to price above the last three sales on your street, because every one of those sales is visible to every buyer's agent. In a deep market an overpriced listing does not linger in ambiguity; it simply sits.
The months-of-supply column is your pricing instruction. In Tule Springs at 1.8 months, Eldorado at 3.2, Sun City Aliante at 3.4 or Los Prados at 3.8, the market is short of homes, correctly priced listings go under contract in 18 to 29 days, and pricing at the top of the last 90 days of closings is defensible because a buyer who waits will lose the house. In the 4.4-to-5.5-month band where most of the big master plans sit, Summerlin, Cadence, Anthem, the Sun Cities, Inspirada, Skye Canyon, Southern Highlands and Green Valley, the market is balanced, and the winning strategy is to price at the median of the last 90 days of closings for your model and let the first two weeks produce the offer. Above seven months, Lake Las Vegas at 11.8, Spanish Trail at 11.6, Rhodes Ranch and MacDonald Ranch at 7.2, you are competing with a year's worth of inventory, and pricing below the visible competition on day one is cheaper than the two cuts you will otherwise make by day 60.
The wider market says the same thing. According to Las Vegas REALTORS' August 2026 report, the Southern Nevada median single-family price was $475,000 in August, down 1.0% from a year earlier and below the record $490,000 set in May and June, while single-family listings without offers rose 5.3% to about 7,590. According to the National Association of REALTORS, national existing-home sales slipped 2.0% in August 2026 to a 3.98 million annual pace with 1.62 million homes for sale, a 4.9-month supply, and its chief economist noted that ample supply is giving buyers better opportunities to negotiate. A seller in a tight community can ignore that headline; a seller in a slow one cannot. Our sellers page walks through how we price against settled closings rather than asks, and the Henderson market report shows what that looks like ZIP by ZIP in the city with the most turnover per household.
How Was This Ranking Built and What Does It Leave Out?
Every figure in this article comes from Las Vegas MLS data pulled through Repliers on September 19, 2026. The closing window is September 19, 2025 through September 18, 2026; the active-listing snapshot is September 18, 2026. The pull covers Las Vegas, Henderson, North Las Vegas and Boulder City, includes single-family homes, condos and townhomes, and excludes land. Each closing was assigned to a community by the subdivision name recorded on its plat, and plat names were rolled up into their master plan, so "Summerlin" is the sum of every Summerlin village plat, "Anthem" is the sum of every Anthem village plat, and the two Sun Cities are tracked as their own rows because their plats are distinct. Months of supply is the active count divided by the average monthly closings over the window. Median days on market is the MLS days-on-market figure carried on each closed listing.
These are not official Las Vegas REALTORS statistics, and they will not match the association's monthly release, which uses its own geography, property-type definitions and reporting cut-offs; this ranking is the tool for comparing one community with another on the same basis. Three limitations matter. First, as explained above, builder-direct sales that never entered the MLS are excluded, so the new-construction communities are undercounted. Second, plat-name grouping is imperfect at the edges: a handful of subdivisions straddle two master plans or carry a name that does not identify the master plan, and those were assigned by location or left out of the community rows while still counting in the four-city total. Third, closings post to the MLS with a lag of several weeks, so the most recent few weeks of the window are slightly under-posted; that affects every community roughly equally and does not change the ranking.
One more caution on the medians. A community median is the middle closing across everything that sold, and in mixed communities it can sit between two very different price points: MacDonald Ranch / Highlands at $1,775,000 blends Sun City MacDonald Ranch resales with guard-gated MacDonald Highlands estates, and Summerlin at $630,000 blends Sun City Summerlin with The Ridges. Use the ZIP and subdivision tables to narrow the range for your street, and treat every median here as a 12-month figure, not a statement about this week.
Frequently Asked Questions
What is the top-selling community in Las Vegas in 2026?
Summerlin, by a wide margin. It recorded 1,936 MLS closings in the 12 months ending September 18, 2026 at a $630,000 median, more than Cadence, Anthem and Sun City Summerlin combined. Its volume comes mostly from resale villages built in the 1990s and 2000s, including the two Sun City Summerlin plats that together closed 458 homes; only 10% of Summerlin's closings were homes built in 2025 or later. Summerlin carried 880 active listings on September 18, 2026, a 5.5-month supply.
Which Henderson community sells the most homes?
Cadence, with 633 MLS closings at a $485,000 median in the 12 months ending September 18, 2026, followed by Anthem at 548, Sun City Anthem at 343, Inspirada at 332, Lake Las Vegas at 264 and Green Valley at 262. Cadence's total is driven by new construction: 63% of its closings were homes built in 2025 or later, and two Cadence builder parcels alone closed 117 new homes through the MLS.
Which Las Vegas community has the least inventory right now?
The Villages at Tule Springs in North Las Vegas. On September 18, 2026 it had 27 active listings against 177 closings in the prior 12 months, a 1.8-month supply, with an 18-day median from listing to contract and a $547,240 median sold price. Eldorado at 3.2 months, Sun City Aliante at 3.4 and Los Prados at 3.8 are the next tightest. Buyers there should expect to compete on well-priced homes.
Why does Lake Las Vegas have so much supply?
Lake Las Vegas carried 259 active listings against 264 closings in the 12 months ending September 18, 2026, an 11.8-month supply, with a 59-day median time to contract. It is a resort community whose second-home and retirement buyers shop slowly and pause when rates rise, and it has six builders releasing new phases into a market that closes about 22 homes a month. For buyers that is the best leverage on this list; for sellers it means pricing below the visible competition rather than matching it.
Are builder-direct new home sales included in these numbers?
No. The counts include only sales that closed through the MLS. Builders sell most of their homes directly from the sales office without ever listing them, so communities with heavy new construction, Cadence at 63% new-build share, Tule Springs at 67%, Skye Canyon at 45%, Lake Las Vegas at 34% and Inspirada at 14%, are undercounted here. Treat the new-build shares as a floor.
Are these official Las Vegas REALTORS statistics?
No. They are Las Vegas MLS data pulled through Repliers on September 19, 2026, grouped by recorded subdivision names and rolled up into master plans by Nevada Real Estate Group. The association's own monthly report, which put the August 2026 Southern Nevada single-family median at $475,000, uses different geography, property definitions and cut-offs and is the right source for a regional headline. This ranking is built for comparing communities with each other over the same 12-month window.
Which of the top-selling communities is cheapest per square foot?
Tule Springs at $224 per square foot, followed by Cadence at $248, Lone Mountain at $248, Painted Desert at $248, Aliante at $240 and Stallion Mountain at $240, all in the 12 months ending September 18, 2026. The most expensive per foot among the high-volume communities are Lake Las Vegas at $329, Summerlin at $319, Spanish Trail at $316 and Anthem at $307. MacDonald Ranch / Highlands, at $500 per foot, is the priciest row in the table.
Ready to Buy or Sell in One of Las Vegas's Top-Selling Communities?
The ranking above is the starting point, not the answer. Summerlin's 1,936 closings range from $440,000 Sun City single-stories to $2,010,000 Red Rock Country Club estates, and Cadence's 633 include builder parcels where the sales office competes with every resale. What you need is the same data cut to your street, your model and the last 90 days, and that is what Nevada Real Estate Group does before we price a listing or write an offer. Across the 9,600+ closings our team has represented, $4.85 billion of them, the pattern in this article has held: communities under four months of supply reward sellers who price to the top of recent closings, communities over seven reward buyers who wait for the second cut, and the balanced middle rewards whoever has the better comparable sales in hand.
If you are selling in Summerlin, Anthem, Cadence, Inspirada, Skye Canyon or any of the 31 communities on this list, we will pull every closing in your subdivision from the past 12 months, show you where your home sits against them, and tell you what the active competition looks like on the day you list. If you are buying, we will tell you which of these communities is genuinely tight, which has leverage you can use, and which builder inventory never reached the MLS. Call or text (702) 637-1759, email info@nevadagroup.com, or stop by our office at 8945 W Russell Rd, Suite 170, Las Vegas, NV 89148. Nevada Real Estate Group is brokered by LPT Realty, license S.181401, and closed 789 homes in 2025 at $440 million in volume; the next one can be yours, in whichever of these communities fits.
Which Sources Inform This Top-Selling Communities Guide?
- Nevada Real Estate Group pull of Las Vegas MLS data through Repliers, September 19, 2026: every home closing in Las Vegas, Henderson, North Las Vegas and Boulder City from September 19, 2025 through September 18, 2026, grouped by recorded plat name, and every active listing as of September 18, 2026. Not an official Las Vegas REALTORS statistic.
- Las Vegas REALTORS August 2026 report, via Vegas Inc: the association's $475,000 August single-family median, the record $490,000 in May and June, and the 7,590 single-family listings without offers.
- National Association of REALTORS, existing-home sales: August 2026 national sales pace of 3.98 million, 1.62 million homes for sale and 4.9 months of supply.
- Freddie Mac Primary Mortgage Market Survey: the 6.95% average 30-year fixed rate for the week ending September 17, 2026, used in the payment examples.
- Howard Hughes Communities, Summerlin: the developer's description of Summerlin's three-decade sales record, more than 300 parks and over 200 miles of trails.
- Cadence, Henderson: the community's builder roster, the nearly 50-acre Central Park, and its national best-selling claim.
- Skye Canyon: the community's builders, location off US-95 and amenities.
- Lake Las Vegas: the six active builders and the community's distance from the Strip.
- HUD, 2026 FHA loan limits and FHFA, 2026 conforming loan limits: the $541,287 FHA floor and $832,750 conforming baseline that frame the budget bands.
- Clark County Assessor, partial abatement: the property-tax cap mechanics that apply after any of these purchases.
- Nevada Legislature, NRS 116: the common-interest community statute governing the HOA disclosures in every master plan on this list.
- Nevada Legislature, NRS 645: the licensing statute under which Nevada Real Estate Group, license S.181401, publishes this analysis.
Prices, inventory and rates change daily; every figure above is as of the dates stated and will be refreshed in a future edition. This report is market analysis, not a valuation of any specific property.