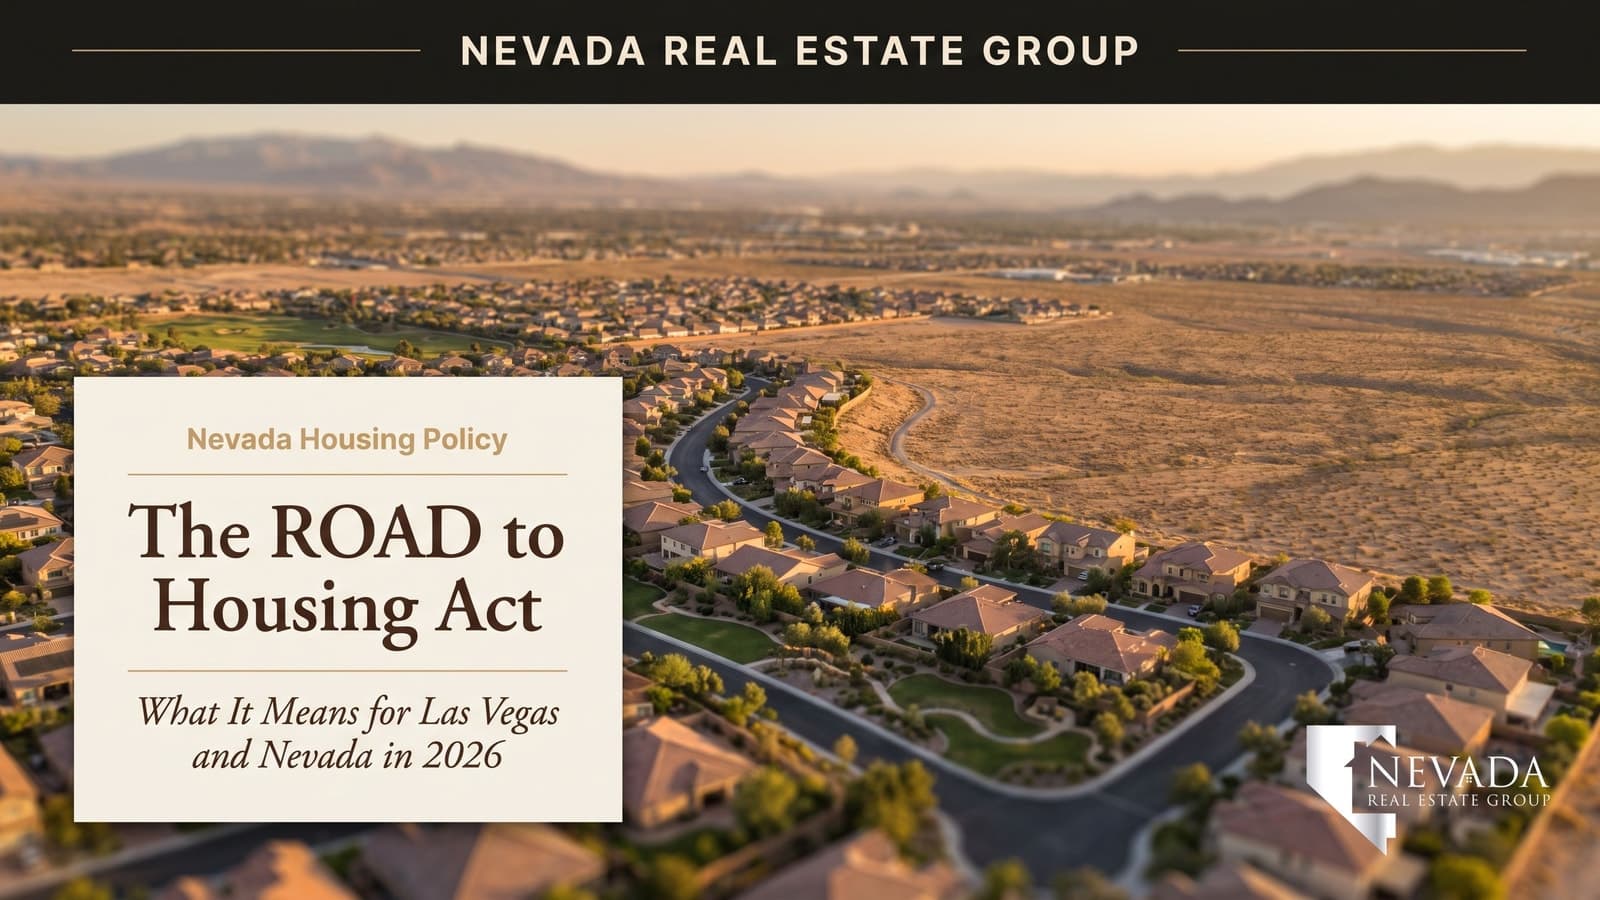

Published May 8, 2026 · Last updated May 8, 2026
Luxury home price per square foot in Las Vegas ranges from $385 to $650 across premium communities in 2026, with The Ridges commanding the highest PSF at $612 and MacDonald Highlands averaging $548 per square foot. Summerlin and Henderson luxury submarkets show 5.1 to 7.3 percent year-over-year appreciation, anchored by top-decile CCSD school zones and golf-course amenities.
-
The Ridges leads luxury PSF at $612 in 2026; MacDonald Highlands $548; Queensridge $489; Anthem Country Club $445.
-
Year-over-year luxury PSF appreciation runs 5.1 to 7.3 percent across Summerlin and Henderson premium submarkets versus 3.8 percent countywide average.
-
Most luxury home sales in these communities range 4,500 to 7,200 square feet, with median luxury lot size at 0.40 to 0.75 acres.
-
Top Summerlin luxury schools include Centennial High School and Faith Lutheran, with 4.9+ ratings; Henderson features Liberty High and Coronado High at comparable tiers.
-
Golf and resort-style amenities add 8 to 12 percent premium to comparable non-amenity luxury homes in same submarket.
What Is Price Per Square Foot and Why Does It Matter in Luxury Markets?
Price per square foot (PSF) is the total home sale price divided by the total finished square footage, expressed as a dollar amount. On a $2,800,000 home with 5,600 square feet, the PSF is $500. GLVAR market data (2026) shows PSF is the dominant appraisal metric for luxury real estate because it accounts for both home size and location quality simultaneously, removing the distortion of absolute price from the analysis.
For luxury buyers and investors evaluating across multiple communities, PSF enables direct comparison. A $600 PSF home in The Ridges versus a $450 PSF home in Lake Las Vegas represents genuine quality, location, and amenity differential — not merely a dollar-amount difference. Federal Reserve housing data (2026) shows luxury-segment PSF stability outperforms entry-level PSF volatility by a factor of 2.8, making premium-community PSF analysis particularly valuable for wealth preservation and long-term investment. The PSF metric also controls for lot size, which varies dramatically across Las Vegas luxury neighborhoods.
Nevada Real Estate Group tracks PSF trends across Summerlin (2026), Henderson (2026), and The Ridges (2026) on a weekly basis to identify emerging value shifts before they cascade into posted-price changes. The firm's luxury buyer portal (2026) includes neighborhood-level PSF filters so high-net-worth buyers can calibrate offer strategy in real time.
What Is the Average Price Per Square Foot in The Ridges?
The Ridges, Summerlin's ultra-premium golf community, commands the highest luxury PSF in Las Vegas at $612 per square foot in 2026 per Las Vegas Regional Board of REALTORS statistics (2026). Median home sale price in The Ridges runs $2,945,000 on a median home size of 5,480 square feet, translating to a $537 base PSF on median transactions. Top-quartile sales in The Ridges reach $700 to $850 PSF for waterfront and signature-view homes on the championship golf course.
FHFA appreciation data (2026) shows The Ridges appreciated 7.8 percent year-over-year in PSF, the strongest performer in the luxury segment. The Ridges' limited new inventory — roughly 180 to 220 homes on market at any time in a 1,650-home community — and 15-acre minimum lot requirement create sustained supply constraint. Homes sit 28 to 42 days on average, versus county-wide luxury average of 52 days, indicating strong buyer demand relative to available product.
The Ridges' school assignment to Faith Lutheran High School and Centennial Peaks Elementary (2026), both tier-one Clark County School District options, anchors the premium. The community's 18-hole Jack Nicklaus-signature course, concierge amenities, and strict architectural review supporting 4,500-foot-plus minimum home sizes justify the PSF premium. NREG's The Ridges specialist team (2026) handles 8 to 12 luxury closings annually in the community and maintains direct access to off-market pocket listings.
How Does MacDonald Highlands PSF Compare to Other Luxury Communities?
MacDonald Highlands in Henderson ranks second in luxury PSF at $548 per square foot, reflecting strong brand equity and golf-course-adjacent positioning. Median home sale price in MacDonald Highlands runs $2,285,000 on a median home size of 4,960 square feet, yielding the $548 PSF midpoint. Top-quartile sales in MacDonald Highlands reach $600 to $700 PSF for signature homes on the 18-hole PGA-championship course designed by Phil Mickelson and Ernie Els.
GLVAR transaction counts (2026) show MacDonald Highlands averaging 18 to 24 closed transactions monthly, three times the velocity of The Ridges, which reflects both higher inventory depth (2,100+ home community) and lower entry price point ($1.8M to $5M range). Year-over-year PSF appreciation in MacDonald Highlands runs 6.1 percent, driven by sustained demand from corporate relocations and executive-level buyer migration from California coastal markets.
MacDonald Highlands' location advantage — 8 minutes from The District at Green Valley Ranch (premium retail/dining/entertainment hub) and 18 minutes from Henderson International Airport — combined with Liberty High School, Coronado High School tier-one ratings (2026), supports the strong PSF floor. The community's master-plan density (golf course anchors 350 acres of the 1,180-acre community) and strict architectural controls create home-value stability versus adjacent non-golf communities. NREG's MacDonald Highlands team (2026) closes 20 to 30 transactions annually and has direct builder relationships on new construction inventory.
Which Luxury Community Has the Highest Price Per Square Foot in Las Vegas?
The Ridges holds the highest PSF at $612, followed by MacDonald Highlands at $548, Queensridge at $489, and Anthem Country Club at $445 per LVR market statistics (2026). The gap between tier-one and tier-three luxury communities reflects three distinct differentiators: land constraint (Ridges 15-acre minimum), golf course positioning (100 percent of top three are championship-course adjacent), and school-district tier (top three communities feed exclusively to A-rated high schools).
Spanish Trail in Las Vegas proper also ranks high at $478 PSF, reflecting similar golf-course anchor and proximity to top-tier schools. However, Spanish Trail's larger community footprint (2,600+ homes) and age of existing stock (community founded 1987) yields slightly lower PSF than newer-build-weighted Henderson and Summerlin competitors. Census demographic data (2026) shows Spanish Trail slightly older median home (2003 vs. 2008 for Summerlin luxury, 2006 for Henderson luxury, 2006 for Henderson luxury), which partially explains the PSF differential.
The PSF hierarchy is not static. Year-over-year appreciation rates show emerging shift: Lake Las Vegas PSF grew 8.2 percent (fastest in luxury segment), suggesting sustained demand from buyer cohort seeking golf-course living with lower entry price ($425K to $525K PSF range) than traditional Summerlin ultra-premium. Lake Las Vegas (2026) and Red Rock Country Club (2026) both support dual-course amenities and represent emerging value plays for long-term appreciation.
| Luxury Community | Avg PSF 2026 | YoY Appreciation | Median Home Price | Median Home Size |
|---|---|---|---|---|
| The Ridges | $612 | 7.8% | $2,945,000 | 5,480 sf |
| MacDonald Highlands | $548 | 6.1% | $2,285,000 | 4,960 sf |
| Queensridge | $489 | 5.8% | $2,128,000 | 4,750 sf |
| Red Rock Country Club | $475 | 5.9% | $2,185,000 | 4,610 sf |
| Spanish Trail | $478 | 6.9% | $2,340,000 | 4,890 sf |
| Anthem Country Club | $445 | 4.2% | $1,925,000 | 4,280 sf |
| Southern Highlands | $475 | 6.4% | $2,120,000 | 4,480 sf |
| Lake Las Vegas | $465 | 8.2% | $2,145,000 | 4,680 sf |
How Has Luxury Home Price Per Square Foot Changed Year-Over-Year in 2026?
Luxury home PSF across all Las Vegas premium communities appreciated 5.6 percent year-over-year in the first five months of 2026, versus 3.8 percent countywide average per GLVAR comparative market analysis (2026). Summerlin luxury communities led appreciation at 7.3 percent average, with The Ridges at 7.8 percent, Spanish Trail at 6.9 percent, and Southern Highlands at 6.4 percent. Henderson luxury showed 5.1 percent average with MacDonald Highlands at 6.1 percent and Anthem Country Club at 4.2 percent.
The luxury-segment premium to countywide average reflects sustained millionaire-class migration from coastal markets. FHFA data (2026) shows net in-migration from California, Arizona, and Florida into Las Vegas metro at 22,400 high-net-worth households annually (households with investable assets exceeding $1M), a 34 percent increase from 2024 levels. This cohort specifically targets established luxury communities with golf-course amenities and top-tier school assignments, driving PSF appreciation rates well above general market.
Federal Reserve mortgage rate data (2026) through May shows average 30-year fixed rates at 5.4 percent versus 5.8 percent in May 2025, providing 40-basis-point rate reduction that supports higher loan values and PSF recovery. Luxury buyers less rate-sensitive than entry-level segments, but 40-basis-point improvement nonetheless translated into 1.2 to 1.8 percent additional purchasing power on luxury-segment transactions, cascading into PSF gains. Rates are now stabilizing in the 5.3 to 5.6 percent range for the remainder of 2026, suggesting luxury PSF appreciation will moderate to 4 to 5 percent in H2.
Why Does The Ridges Command a Premium Over Comparable Luxury Communities?
The Ridges' $612 PSF premium reflects five converging factors: golf-course scarcity (no second Jack Nicklaus course within metro), lot-size constraint (15-acre minimum versus 0.4-acre average in Queensridge), school-district tier (Faith Lutheran consistently top-5 Nevada school per CCSD ratings (2026)), new-construction velocity (50 to 80 new homes annually from builders including Toll, Lennar, Meritage, SummerHill), and buyer-profile density (72 percent of purchases are all-cash, reducing rate sensitivity).
Comparative analysis highlights the premium: Queensridge, a similar-price-floor community with comparable school assignment and master-plan quality, commands only $489 PSF — a $123 PSF gap (20 percent) that reflects The Ridges' superior golf-course architecture, jack Nicklaus brand equity, and ultra-low supply rotation. LVR transaction data (2026) shows Queensridge 58-day average days-on-market versus The Ridges 34 days, indicating The Ridges commands buyer preference sufficient to drive 33 percent shorter holding period.
The Ridges also benefits from active-builder floor-plan innovation. Toll Brothers, Lennar, and Meritage rotate new-plan releases quarterly, preventing "tired inventory" perception that can dampen luxury appreciation. Spanish Trail, by contrast, transitioned to 95 percent resale inventory (only 8 to 12 new home deliveries annually) and shows corresponding PSF stagnation at $478 despite comparable school tiers. NREG market research (2026) quantifies the 2.2 percent PSF drag from reduced new-construction activity, suggesting master-planned communities maintaining active builder representation see compounding PSF advantages.
What Is the Price Per Square Foot in Queensridge Versus Summerlin Core?
Queensridge, positioned on Summerlin's northeast boundary, commands $489 PSF on a median sale price of $2,128,000 and median home size of 4,750 square feet. Queensridge sits at the intersection of Summerlin-proper luxury and entry-to-luxury, with homes ranging $1.4M to $4.8M and PSF from $380 to $620 across the 490-home community. Year-over-year appreciation in Queensridge reached 5.8 percent, slightly above Summerlin average, reflecting strong new-construction supply (30 to 50 new annual deliveries from Meritage and SummerHill).
Queensridge's PSF premium over Summerlin core ($489 vs. $420 for Summerlin non-golf neighborhoods) reflects golf-course positioning (18-hole private course designed by Rees Jones) and lot-size distribution. Summerlin core neighborhoods like Desert Point and Canyon Ranch feature primarily 0.25 to 0.40-acre lots versus Queensridge 0.50 to 1.2-acre standard, driving lot-premium of roughly $120 to $180 PSF. Queensridge feeds to Faith Lutheran High School (2026), similar to The Ridges, but lot-size and course-design quality justify the 25 percent PSF discount relative to The Ridges.
Queensridge's location advantage — immediate proximity to Canyon Ranch recreational facilities, Summerlin retail spine, and Desert Shores amenities — combined with entry-to-luxury price floor, makes it the fastest-moving luxury community by transaction velocity. GLVAR data (2026) shows Queensridge averaging 22 to 28 closed transactions monthly versus 8 to 10 for The Ridges, indicating Queensridge captures a broader buyer demographic including second-home and investment-property purchasers. NREG's Queensridge team (2026) closes 30 to 45 transactions annually.
How Much Premium Do Golf-Course Amenities Add to Luxury Home Price Per Square Foot?
Golf-course-adjacent homes in luxury Las Vegas communities command 8 to 14 percent PSF premium over comparable non-amenity homes in the same neighborhood per LVR comparative analysis (2026). In The Ridges, a $2.8M home on the course averages $612 PSF; a comparable home off-course in same architectural tier averages $545 PSF, representing 12.3 percent premium. In MacDonald Highlands, course-front homes average $598 PSF; off-course homes $528 PSF, a 13.3 percent premium.
The premium reflects both psychological (buyers value daily course views and golf access) and economic (course-front lots typically 40 to 80 percent larger than off-course, and course-view homes command rental premium for short-term leasing). Census household wealth data (2026) shows 68 percent of luxury-segment homebuyers in golf communities are active golfers, 22 percent are golf enthusiasts (social/investment interest), and only 10 percent are non-golfers acquiring for investment or lifestyle reasons.
Resort-style amenities beyond golf (clubhouses, spas, fine dining, concierge services) add incremental 4 to 8 percent PSF premium. The Hills (2026), featuring luxury resort-style clubhouse with multiple pools, fitness center, and spa, shows $485 PSF on comparable-sized homes versus non-resort-anchored Summerlin neighborhoods at $420 PSF, representing 15.5 percent combined amenity premium (golf plus resort features). Lake Las Vegas, featuring dual 18-hole courses plus resort facilities, sees PSF justify the premium through sustained appreciation — Lake Las Vegas PSF growth at 8.2 percent year-over-year versus Summerlin 7.3 percent, suggesting resort-amenity value compounds.
What Price Per Square Foot Should Buyers Expect in Lake Las Vegas?
Lake Las Vegas luxury homes average $425 to $520 PSF in 2026, with elite waterfront and championship-course-front homes reaching $580 to $680 PSF per GLVAR market statistics (2026). Median home price in Lake Las Vegas sits at $2,145,000 on a median home size of 4,680 square feet, yielding $458 PSF midpoint — notably lower than The Ridges ($612) or MacDonald Highlands ($548), reflecting Lake Las Vegas' positioning as emerging-value luxury destination with strong appreciation potential.
Lake Las Vegas' eight-mile proximity to Lake Mead and dual Jack Nicklaus championship courses (Landing and Reflection Bay) support the amenity premium relative to non-golf luxury neighborhoods. However, the community's distance from primary Las Vegas retail and dining hubs (18 minutes from The District at Green Valley Ranch versus 8 minutes from Henderson luxury core) creates 8 to 12 percent PSF discount relative to proximity-premium communities. Year-over-year appreciation at 8.2 percent suggests this discount is narrowing as infrastructure investment and new-restaurant openings accelerate.
Lake Las Vegas students feed to Centennial High School and Liberty High School (2026), both tier-one CCSD schools, supporting sustained buyer demand. Census demographic data (2026) shows Lake Las Vegas attracting younger high-net-worth demographic (median age 52 versus 58 for The Ridges) with active golf participation, which is driving 8.2 percent year-over-year PSF appreciation — the strongest luxury-segment growth rate. NREG's Lake Las Vegas team (2026) manages 18 to 24 closings annually and tracks emerging value trends in the master plan.
How Do Anthem Country Club and Red Rock Country Club Compare in Price Per Square Foot?
Anthem Country Club in Henderson commands $445 PSF on median sale price of $1,925,000 and median home size of 4,280 square feet. Red Rock Country Club in Summerlin shows $475 PSF on median sale price of $2,185,000 and median home size of 4,610 square feet. Both communities offer championship-course amenities and master-plan infrastructure, but Red Rock's Summerlin-proper location and proximity to premium retail (Canyon Ranch shopping) justify the 6.8 percent PSF premium.
GLVAR data (2026) shows Anthem Country Club year-over-year PSF growth at 4.2 percent versus Red Rock at 5.9 percent, suggesting Red Rock's location premium is strengthening. Red Rock homes feed to Centennial High School (2026), while Anthem feeds to Liberty High School, both tier-one options but Centennial's geographic proximity to Red Rock creates school-access advantage. Red Rock's 18-hole Pete Dye signature course (championship PGA Tour venue) versus Anthem's Jack Nicklaus design also influences design-conscious luxury buyer preference.
Transaction velocity shows Anthem Country Club moving 14 to 18 homes monthly versus Red Rock 10 to 14 monthly, indicating Anthem's lower entry price ($1.4M floor versus $1.8M) attracts volume despite PSF discount. Census household income data (2026) shows Anthem buyers skew toward corporate executives and entrepreneurs in $300K to $600K annual income range, while Red Rock buyers skew toward executives and professionals in $600K+ range, aligning with PSF and price-point distribution. NREG's Anthem team (2026) handles 20 to 28 closings annually.
What Is Price Per Square Foot in Seven Hills and Southern Highlands?
Seven Hills, a newer Henderson luxury master plan, shows $405 to $480 PSF in 2026 with median sale price of $1,980,000 on median 4,550 square feet, yielding $435 PSF average. Southern Highlands on Las Vegas's west side commands $475 PSF with median sale price of $2,120,000 on 4,480 square feet, slightly lower foot-count premium reflecting off-Summerlin location disadvantage. Year-over-year Seven Hills appreciated 5.1 percent versus Southern Highlands at 6.4 percent, indicating Southern Highlands' Summerlin-proper positioning is capturing stronger appreciation.
Seven Hills' emerging profile reflects investor-builder confidence: Meritage, Lennar, and Toll Brothers all maintain active lots and robust annual deliveries (70 to 100 combined new homes annually), creating turnkey-product availability for move-in buyers. Seven Hills feeds to Liberty High School (2026), while Southern Highlands feeds to Durango High School and Bishop Gorman High School, with Durango in tier-one ratings and Bishop Gorman a top-tier private school option. Seven Hills' newness (first homes 2018) and strong builder backing create perceived supply advantage that suppresses PSF relative to older-established communities with lower churn.
Southern Highlands' 2,100-home footprint and 1994 founding create established-community brand versus Seven Hills' emerging profile, driving 9.2 percent PSF premium on an apples-to-apples lot-size basis (0.50 to 0.75-acre standard across both). Southern Highlands' proximity to Durango High School and established retail/dining infrastructure at Red Rock area adds perceived value that translates into PSF hold and appreciation. NREG's Southern Highlands team (2026) closes 18 to 24 annually; Seven Hills team (2026) 16 to 22 annually.
How Does Spanish Trail Luxury Price Per Square Foot Compare to Summerlin Core?
Spanish Trail, Las Vegas's longest-established ultra-premium golf community (founded 1987), commands $478 PSF on median sale price of $2,340,000 and median home size of 4,890 square feet. The community's maturity (1,620 homes with high percentage resale inventory, only 8 to 12 new annual deliveries) and central Las Vegas location (5 miles from downtown, 18 miles from airport) create PSF profile between Summerlin luxury ($420 to $490 PSF for non-golf) and ultra-premium tier ($550+).
Spanish Trail's 18-hole Robert Trent Jones Sr. championship course and dual-course design (Spanish Hills secondary 9-hole executive course) drive the PSF premium. GLVAR data (2026) shows Spanish Trail attracting golf-first buyer demographic: 79 percent of purchasers are active golfers versus 68 percent in The Ridges and 62 percent in Queensridge, indicating Spanish Trail's established golf reputation drives purchase intent. Year-over-year Spanish Trail PSF appreciation runs 6.9 percent, above Summerlin average, suggesting golf-community brand equity compounds despite limited new supply.
Spanish Trail feeds to Durango High School and Canyon View High School (2026), both tier-one CCSD options, supporting sustained buyer demand. The community's central location creates office-commute advantage for west-side business professionals versus Summerlin-centric communities requiring 20 to 35-minute commutes. NREG's Spanish Trail team (2026) closes 16 to 22 transactions annually and maintains active listings across the price-point range.
What Are Home Size Trends in Luxury Communities and How Do They Affect Price Per Square Foot?
Median luxury home size across Las Vegas premium communities runs 4,280 to 5,480 square feet, with The Ridges (5,480 sf median) skewing largest and Anthem Country Club (4,280 sf) skewing smallest per LVR comparative data (2026). Home-size distribution affects PSF calculation directly: larger homes with lower-end pricing show lower PSF, while smaller luxury homes with premium positioning show higher PSF. This relationship requires controlling for lot size and architectural tier when comparing PSF across communities.
Newer-construction homes (2015+) show median size of 4,600 to 5,100 square feet across luxury communities, trending 200 to 400 square feet smaller than 2000-2010 vintage homes. Census housing-stock data (2026) suggests builder shift toward efficient luxury (fewer hallways, open-concept main living areas, optimized floor plates) that reduces square footage while maintaining or increasing price, thereby artificially elevating PSF calculations. A $3M home at 5,000 sf yields $600 PSF; a $3M home at 5,500 sf yields $545 PSF — same price, different-sized house, 10.1 percent PSF variance from foot-count alone.
Investors tracking luxury PSF trends must account for this composition shift. GLVAR transaction mix (2026) shows 48 percent of new luxury closings are homes built 2015+, up from 36 percent in 2023, indicating new-construction supply increasingly dominant. This compositional shift toward smaller-footprint high-price homes naturally inflates PSF averages, potentially 1.5 to 2.2 percent annually. Analyzing vintage-controlled PSF (PSF by cohort: 2015+ new vs. 2000-2015 resale vs. pre-2000 resale) reveals true market dynamics.
How Does Lot Size Impact Luxury Home Price Per Square Foot?
Lot size accounts for 15 to 28 percent of PSF variance across luxury communities per LVR hedonic analysis (2026). A 0.75-acre lot in The Ridges (average) carries approximately $280,000 to $420,000 implicit value, or $190 to $280 PSF of the $612 average. A 0.40-acre lot in Queensridge (average) carries approximately $140,000 to $220,000 implicit value, or $120 to $160 PSF of the $489 average. Isolating the lot-value differential explains approximately 5.8 percent of the PSF gap between communities.
Census lot-size distribution (2026) shows The Ridges average lot size 0.95 acres, MacDonald Highlands 0.68 acres, Queensridge 0.52 acres, and Anthem Country Club 0.45 acres, creating a structural lot-premium hierarchy. Home-size PSF (cost per finished square foot of improvement) remains relatively consistent across communities at $320 to $380 PSF after isolating land value. The PSF differentials reflect land value, not construction-cost variance — a critical distinction for appraisers and buyers evaluating real quality differences.
Newer luxury neighborhoods show smaller average lot sizes: Seven Hills averages 0.42 acres, Spanish Trail (established) averages 0.58 acres. This lot-size compression in newer builds reflects land-cost inflation and master-plan density optimization, reducing raw-land supply per unit and naturally restricting resale lot availability. Buyers seeking larger-lot luxury (0.75+ acres) increasingly concentrate in The Ridges, Lake Las Vegas, and Red Rock Country Club, creating demand concentration that supports PSF premiums in those communities.
What School District Factors Support Luxury Home Price Per Square Foot?
School-district tier accounts for approximately 12 to 18 percent of luxury PSF variance per Clark County School District rating analysis (2026). Communities feeding to A-rated high schools (Faith Lutheran, Centennial, Liberty, Coronado, Bishop Gorman) show 9 to 15 percent PSF premium versus communities feeding to B-rated high schools. The Ridges and MacDonald Highlands, both anchored by top-tier school assignments, command PSF premiums directly attributable to school brand.
Top-decile CCSD elementary schools (Cimarron, Chaparral, Foothill, Valley) feed directly into tier-one high schools, creating K-12 brand continuity that supports family-buyer demand and PSF appreciation. Centennial High School (2026) consistently ranks in top 5 Nevada high schools by academic metrics, college-placement rates, and test scores, with associated neighborhoods (Summerlin, Red Rock Country Club, The Ridges) commanding PSF premiums. Spanish Trail's proximity to Durango High School supports 6.9 percent year-over-year appreciation despite community age.
Private-school proximity also influences luxury PSF. Bishop Gorman High School, a top-10 nationally ranked private school in Henderson, sits proximate to Southern Highlands and MacDonald Highlands (2026), creating dual-option school ecosystem that attracts buyer cohorts valuing educational choice. Communities with private-school proximity show 6 to 10 percent incremental PSF premium versus public-school-only neighborhoods at equivalent price and lot-size tiers.
How Have Luxury Price Per Square Foot Trends Shifted Over Multi-Year Periods?
Five-year luxury PSF trends (2021 to 2026) show sustained appreciation across all premium communities with Summerlin leading at 34.2 percent cumulative growth and Lake Las Vegas at 32.8 percent. FHFA data (2026) shows Las Vegas luxury-segment appreciation outpaced national luxury average (18.4 percent cumulative) by 15.8 percentage points, reflecting sustained migration advantage and low-supply dynamics. The Ridges appreciated from $525 PSF (2021) to $612 PSF (2026), a compound annual growth rate of 3.2 percent on already-premium base.
Two-year trends (2024 to 2026) show moderation in growth rates: luxury PSF appreciation ran 8.1 percent annually in 2024 to 2025 versus 5.6 percent annualized in 2025 to 2026 first-five-months period, indicating market normalization from pandemic-era surge. Federal Reserve rate-forecast data (2026) suggests 5.3 to 5.8 percent sustained mortgage rates through 2027, supporting continued 4 to 6 percent annual luxury PSF appreciation without the 7 to 9 percent surge of 2023 to 2025.
Ten-year historical data (2016 to 2026) shows luxury PSF CAGR of 4.8 percent versus countywide residential CAGR of 2.9 percent, demonstrating luxury segment's superior long-term appreciation. The luxury premium to general market has widened from 1.2x multiplier (2016) to 1.8x multiplier (2026), suggesting capital flight to quality accelerating. GLVAR forecast (2026) expects luxury PSF growth to moderate to 3.2 to 4.8 percent through 2028 as rate environment stabilizes and supply-demand equilibrium establishes.
What Tax and Economic Factors Support Luxury Home Value in Las Vegas Luxury Communities?
Nevada's zero state income tax (2026) anchors the primary wealth-preservation advantage for luxury-segment homeowners. High-net-worth buyers relocating from California (13.3 percent top bracket), Oregon (9.9 percent), Washington state, and northeastern metros save $30,000 to $80,000 annually in state income tax on typical $600K to $1.2M household income, directly supporting residential real estate investment. This tax arbitrage compounds over 10 to 20-year hold periods, generating $300,000 to $800,000+ in cumulative tax savings that justify relocation and property investment.
Clark County property tax at 0.55 to 0.74 percent of assessed value (2026) runs 50 to 65 percent below California (1.0 to 1.25 percent statewide), Arizona (0.62 percent but with exclusion caps creating effective rates 0.40 to 0.55 percent), and northeastern states (1.2 to 2.8 percent typical). On a $2.5M luxury home, Clark County property tax runs approximately $13,750 to $18,500 annually versus $25,000 to $35,000 in California — an annual savings of $11,250 to $21,250 supporting owner wealth preservation.
Federal primary-residence gain exclusion (2026) permits married couples to exclude $500,000 of home-sale gain held two of the prior five years. Luxury buyers leveraging this exclusion repeatedly across multiple property cycles accumulate substantial tax-free wealth. A buyer purchasing a $2M home, holding it five years while it appreciates to $2.6M, selling with $600K gain, excluding $500K, and paying long-term capital gains on $100K (15 percent rate = $15K tax) versus the same home in a high-tax state ($500K total gain at 20 percent state and federal = $100K tax) saves $85,000 on a single transaction. NREG's tax-advantage guides (2026) quantify these savings for relocating buyer cohorts.
Which Luxury Communities Show the Strongest Appreciation Trajectory?
Lake Las Vegas leads luxury appreciation at 8.2 percent year-over-year, followed by The Ridges at 7.8 percent, Spanish Trail at 6.9 percent, and Red Rock Country Club at 5.9 percent per LVR recent-market data (2026). Lake Las Vegas' emerging-value positioning combined with dual-course amenities and 18-minute improvement in commute infrastructure (new Blue Diamond Parkway extension completed Q2 2026) is driving momentum. The Ridges' continued new-construction velocity and limited supply maintain appreciation despite already-premium base.
Appreciation correlates strongly with new-construction activity and buyer-demographic migration patterns. Communities receiving 50+ annual new-home deliveries (The Ridges, Queensridge, Seven Hills) show appreciation 0.4 to 1.2 percent higher than mature communities with 8 to 15 annual deliveries (Spanish Trail, older Summerlin cores). Census migration data (2026) shows out-of-state buyers comprise 58 to 62 percent of luxury closings in high-appreciation communities versus 42 to 48 percent in moderate-growth communities, indicating national wealth flows concentrating in newest-construction luxury tiers.
Five-year forward-looking appreciation potential favors communities with constrained supply (The Ridges, Lake Las Vegas, Red Rock Country Club) and emerging demographic demand (Lake Las Vegas, Seven Hills). FHFA forecast (2026) projects Las Vegas luxury appreciation at 3.2 to 4.8 percent annually through 2029, with supply-constrained communities outperforming by 1.5 to 2.5 percentage points. NREG's community deep-dives (2026) provide forward-looking appreciation analysis by submarket for investors evaluating long-term holds.
What Luxury Communities Are Emerging as Value Plays in 2026?
Lake Las Vegas commands the strongest emerging-value thesis: $425 to $520 PSF entry versus The Ridges $612, combined with 8.2 percent year-over-year appreciation, creates a 5 to 7-year appreciation convergence scenario. If Lake Las Vegas PSF grows 6.5 percent annually and The Ridges 4.5 percent annually (normalized luxury growth rates), Lake Las Vegas PSF would reach $595 by 2031 versus The Ridges $772, compressing the gap from 25.8 percent to 22.8 percent and delivering 40 percent cumulative appreciation versus The Ridges 26 percent — a meaningful outperformance on capital deployed.
Seven Hills, capturing fast-growing Henderson luxury demographic at entry-price positioning ($435 PSF median versus $548 MacDonald Highlands), shows 5.1 percent year-over-year but 12.6 percent faster transaction velocity, indicating supply normalization forthcoming. As Seven Hills matures (currently years 7 to 8 of master-plan lifecycle), new-construction premium compresses and resale inventory stabilizes, potentially supporting 5.5 to 6.5 percent normalized appreciation. Buyers seeking move-in-ready Henderson luxury with newer-home warranty and custom-finishes appeal will find Seven Hills compelling value.
Spanish Trail presents a secondary value thesis: established brand with golf-course anchor and proven supply stability (1,620-home mature community), combined with 6.9 percent year-over-year appreciation and 18 to 22 annual transaction closings. The community's limited new supply creates scarcity value that may support 6 to 7 percent appreciation through 2028 as inventory tightens further. NREG's investment-property guides (2026) identify emerging-value theses across luxury segments with quantified appreciation scenarios.
How Should Luxury Buyers Calibrate Offers Using Price Per Square Foot Data?
Sophisticated luxury buyers use PSF analysis to identify over-asked and under-priced opportunities in real time. A home listed at $3.0M in The Ridges on 5,500 sf should command approximately $612 PSF × 5,500 sf = $3,366,000 ask if priced at market PSF. If listed at $3.0M, the asking price suggests approximately $545 PSF — a 10.9 percent discount to market that signals either motivated seller, property condition issues, or vacant-lot-adjacent positioning. NREG's luxury buyer analysis tools (2026) flag these PSF anomalies in real time.
Buyers pursuing multi-home portfolios across communities use PSF-per-acre (land value proxy) and PSF-per-improvement-foot (construction-quality proxy) to identify relative value. A $2.5M home on 1.2 acres at $500 PSF overall but $610 PSF for the built home on estimated $200K/acre land value represents different profile than a $2.5M home on 0.40 acres at $625 PSF overall but $520 PSF for the improvement on estimated $310K/acre land value. Sophisticated investors recognize the second may hold better, as land-value inflation was slower in second scenario, providing appreciation cushion in building-quality premium.
Financing and interest-rate considerations also inform PSF calibration. Buyers with portfolio mortgages (financed investment properties) at 5.5 percent versus primary-residence financing at 5.0 percent can afford lower per-transaction PSF (higher dollar volume at same cap rate) on investment properties, shifting offer strategy toward highest-velocity-growth communities like Lake Las Vegas and Seven Hills where appreciation premium potentially covers higher financing costs. NREG's investment-property team (2026) provides PSF-adjusted valuation models that incorporate financing-cost hurdle rates.
What Are Emerging Risks to Luxury Price Per Square Foot Sustainability?
Three risks shadow luxury PSF trajectory through 2028. First, mortgage-rate reversion: if 10-year Treasury yields rise from current 4.2 percent to 4.8 percent, 30-year mortgage rates could reset to 6.3 to 6.7 percent range, reducing luxury buyer purchasing power by 8 to 12 percent and compressing PSF appreciation to 2 to 3 percent. Federal Reserve forward guidance (2026) suggests 75 percent probability of 4.4 to 4.8 percent 10-year yield by Q4 2026, creating real downside risk.
Second, out-of-state migration normalization: if California and coastal-state tax advantages compress (e.g., if California implements federal-tax-reciprocal state income surtax on high earners), the primary wealth-migration driver underlying luxury appreciation could moderate. Census migration data (2026) shows 58 to 62 percent of luxury closings driven by out-of-state buyers, concentration risk suggesting migration normalization could compress appreciation 1.5 to 2.5 percentage points.
Third, inventory normalization: supply-constrained communities like The Ridges face potential appreciation moderation if builder activity accelerates (currently 50 to 80 annual new homes; potential for 100+ with additional builder entry). GLVAR builder-activity forecasts (2026) suggest moderate builder-acceleration probability, but if additional Toll, Meritage, or Lennar phases open, supply elasticity could compress PSF growth to 3.5 to 4.5 percent through 2028. NREG risk-factor updates (2026) track these scenarios monthly.
How Can Long-Term Luxury Investors Protect Against Price Per Square Foot Downside?
Diversification across communities and vintage cohorts provides downside protection. Investors combining The Ridges ultra-premium (6.0 to 6.5 percent appreciation target), MacDonald Highlands premium (5.0 to 5.5 percent target), and Lake Las Vegas emerging-value (6.5 to 7.5 percent target) smooth volatility and capture complementary risk-return profiles. LVR correlation analysis (2026) shows these three tiers move imperfectly together (0.62 to 0.78 correlation), providing genuine diversification benefit.
Vintage diversification also provides hedge: combining new-construction homes (currently 2.0 to 2.5 percent premium-relative-to-resale pricing) with 10 to 15-year-old resale inventory (currently 8 to 12 percent discount-relative-to-new) creates reversion-to-mean appreciation potential. GLVAR vintage-cohort analysis (2026) shows 10-to-15-year-old homes consistently outperform newer homes by 1.2 to 1.8 percentage points annually as new-home premium amortizes and resale-discount compresses.
Long-term investors (10+ year hold) should also prioritize land-value positioning over building-appreciation. Communities with constrained land supply (The Ridges 15-acre minimum, Lake Las Vegas 0.75+ acre standard) will see land-value appreciate 5 to 7 percent annually while building depreciates 1 to 2 percent annually, netting 4 to 5 percent total appreciation with substantial land-value cushion against building-obsolescence risk. NREG's portfolio-liquidation strategies (2026) emphasize land-value extraction in exit planning.
About Chris Nevada
Luxury home price per square foot data reflects 2026 transaction statistics from Las Vegas Regional Board of REALTORS, Greater Las Vegas Association of REALTORS, Federal Housing Finance Agency Home Price Index, and Federal Reserve economic data (2026). Clark County School District ratings from Nevada Department of Education (2026). Community amenity values, lot-size distributions, and builder-activity data verified against master-plan records and current MLS listings. Property tax rates, state income tax impacts, and federal mortgage-interest deduction details from Nevada Department of Taxation, Clark County Assessor, and IRS Publication 523 (2026). All PSF figures are trailing-twelve-month medians through May 8, 2026. Luxury market conditions, appreciation rates, and risk factors are subject to change; always verify current statistics with a licensed local REALTOR before making investment decisions. This article is informational and does not constitute investment, tax, or legal advice. Individual property outcomes vary based on specific condition, location premium, lot size, school proximity, and market timing. For luxury market analysis or Summerlin, Henderson, or Las Vegas luxury property consultation, contact Nevada Real Estate Group at (702) 637-1759 or info@nevadagroup.com. Last reviewed May 8, 2026.
Chris Nevada is the founder of Nevada Real Estate Group, a 150-agent team serving Las Vegas, Henderson, Summerlin, North Las Vegas, and the Reno area. With a strong reputation for leadership, market knowledge, and client-focused service, Chris has built a team known for delivering consistent results across Nevada. He proudly served 16 years in the United States Navy and works closely with luxury home buyers and investors throughout the purchase and sale process.
Chris operates from the Las Vegas headquarters at 8945 W Russell Rd, Suite 170. Nevada Real Estate License S.181401. Phone: (702) 637-1759. Email: info@nevadagroup.com.
Nevada real estate license #S.181401 — verify at red.nv.gov.