
"Is Henderson, Nevada safe?" is a question with a real, dated answer at the city level and no official answer at the street level. This guide gives you the first and shows you how to look for the second. It reports what the Henderson Police Department, the State of Nevada and the FBI published for 2025, says what each number counts, and points you to the agency for any address.
You won't find a list of favored neighborhoods here. The FBI warns against ranking places on crime figures, and fair housing guidance asks agents to give every client the same objective information, so we leave those calls to you.
Updated October 31, 2026: We rebuilt this guide on 2025 FBI and state records and changed its title. Earlier versions named preferred neighborhoods, leaned on private city rankings and treated home prices as a safety premium, none of which we could support.
Updated November 2, 2026: We re-read this guide's sources. The FBI's agency tables wouldn't load and the City of Henderson's site refused the read, so we rebuilt the rates on Nevada's portal and Census population figures. That moved Henderson's property rate from slightly below the national estimate to slightly above it. The size-group averages, staffing figures and the map's stated window relied on those pages, so they're gone.
On Nevada's crime portal, Henderson police recorded 826 violent and 5,585 property crimes in 2025, about 234 and 1,575 per 100,000 residents using the Census estimate of 353,289 and leaving arson out to match the FBI's definition. The FBI's national estimates were 327.6 and 1,534.8. Those are citywide totals, so they say nothing about one street. For an address, start with Henderson's Crime Search map.
- State counts put Henderson at about 234 violent and 1,575 property crimes per 100,000 residents in 2025.
- State portal counts fell in 2025: violent crime 13.78% to 826, property crime 9.01% to 5,585.
- Larceny, at 3,841 offenses, made up about 69% of Henderson's 2025 state portal property total.
- The FBI warns that city crime rankings produce simplistic and misleading pictures of a place.
- Set the same window on Henderson's Crime Search map for every address you compare.
Is Henderson, Nevada actually safe?
Official data can't give a yes or no for a household, but it can give the numbers. Nevada's crime statistics portal shows 826 violent and 5,585 property crimes for the Henderson Police Department in 2025. The offense-by-offense counts are further down.
The FBI publishes its own agency tables on its Crime Data Explorer, but that page wouldn't load when we checked on November 2, 2026, so we don't quote them here. Expect them to differ from the state's. The state's property theme includes arson and the FBI's total doesn't, and the FBI's summary gives a data cutoff of April 2, 2026, while the portal can keep changing. Quote one source, name it and give the date you read it.
Reading the table takes one more step. Each line counts offenses, not incidents or households. The portal counts one crime per victim for murder, rape and aggravated assault, one per incident for robbery, and each offense in a property incident. Our guide to reading Las Vegas crime statistics, which covers Henderson's reporting too, explains why one incident can add several offenses.
How does Henderson's crime rate compare to national and valley averages?
On the state's counts and the Census Bureau's 2025 estimate of 353,289 residents, Henderson works out to about 233.8 violent and 1,575.2 property crimes per 100,000 residents in 2025. That leaves out the 20 arsons, because the FBI's property estimate doesn't count arson, and the arithmetic is ours. The FBI's national summary estimates 327.6 and 1,534.8. So Henderson's violent rate sits well below the national estimate, and its property rate sits slightly above it. That property gap is small enough that a different count or population could reverse it, so don't lean on it.
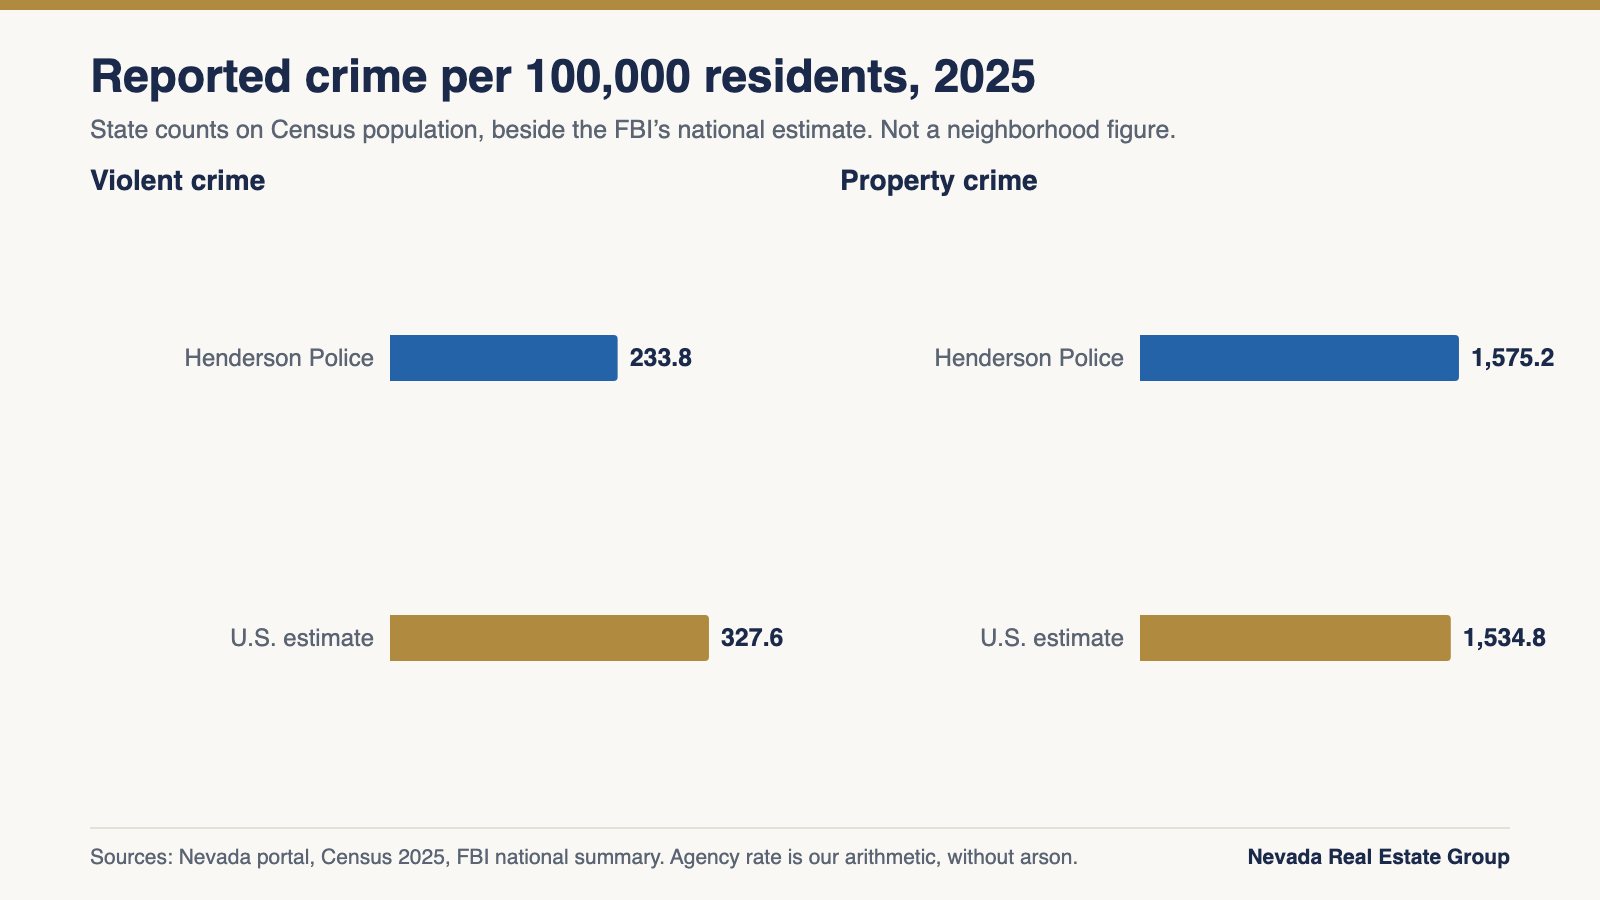
For the valley, one method for each agency keeps the numbers comparable: state portal counts over Census population. The table isn't a ranking, and it doesn't describe any neighborhood in any of these places. LVMPD's area includes the resort corridor and its visitors, who aren't in a resident population, so a direct reading overstates what it can show.
| Agency | Census population | Violent crimes | Property crimes, less arson | Violent rate | Property rate |
|---|---|---|---|---|---|
| Boulder City Police Department | 14,884 | 24 | 123 | 161.2 | 826.4 |
| Henderson Police Department | 353,289 | 826 | 5,565 | 233.8 | 1,575.2 |
| LVMPD | 1,718,399 | 7,131 | 42,567 | 415.0 | 2,477.1 |
| North Las Vegas Police Department | 296,653 | 1,113 | 5,117 | 375.2 | 1,724.9 |
Our posts on Las Vegas, North Las Vegas, Boulder City and Summerlin read those areas one at a time.
How has Henderson's reported crime changed since 2021?
On the state portal, both totals rose to a 2023 peak and have fallen since. Violent crime went from 791 in 2021 to 1,010 in 2023, then to 958 and 826. Property crime went from 5,845 in 2021 to 7,223 in 2023, then to 6,138 and 5,585. The 2025 property count is below the 2021 figure, while the 2025 violent count is still slightly above it.
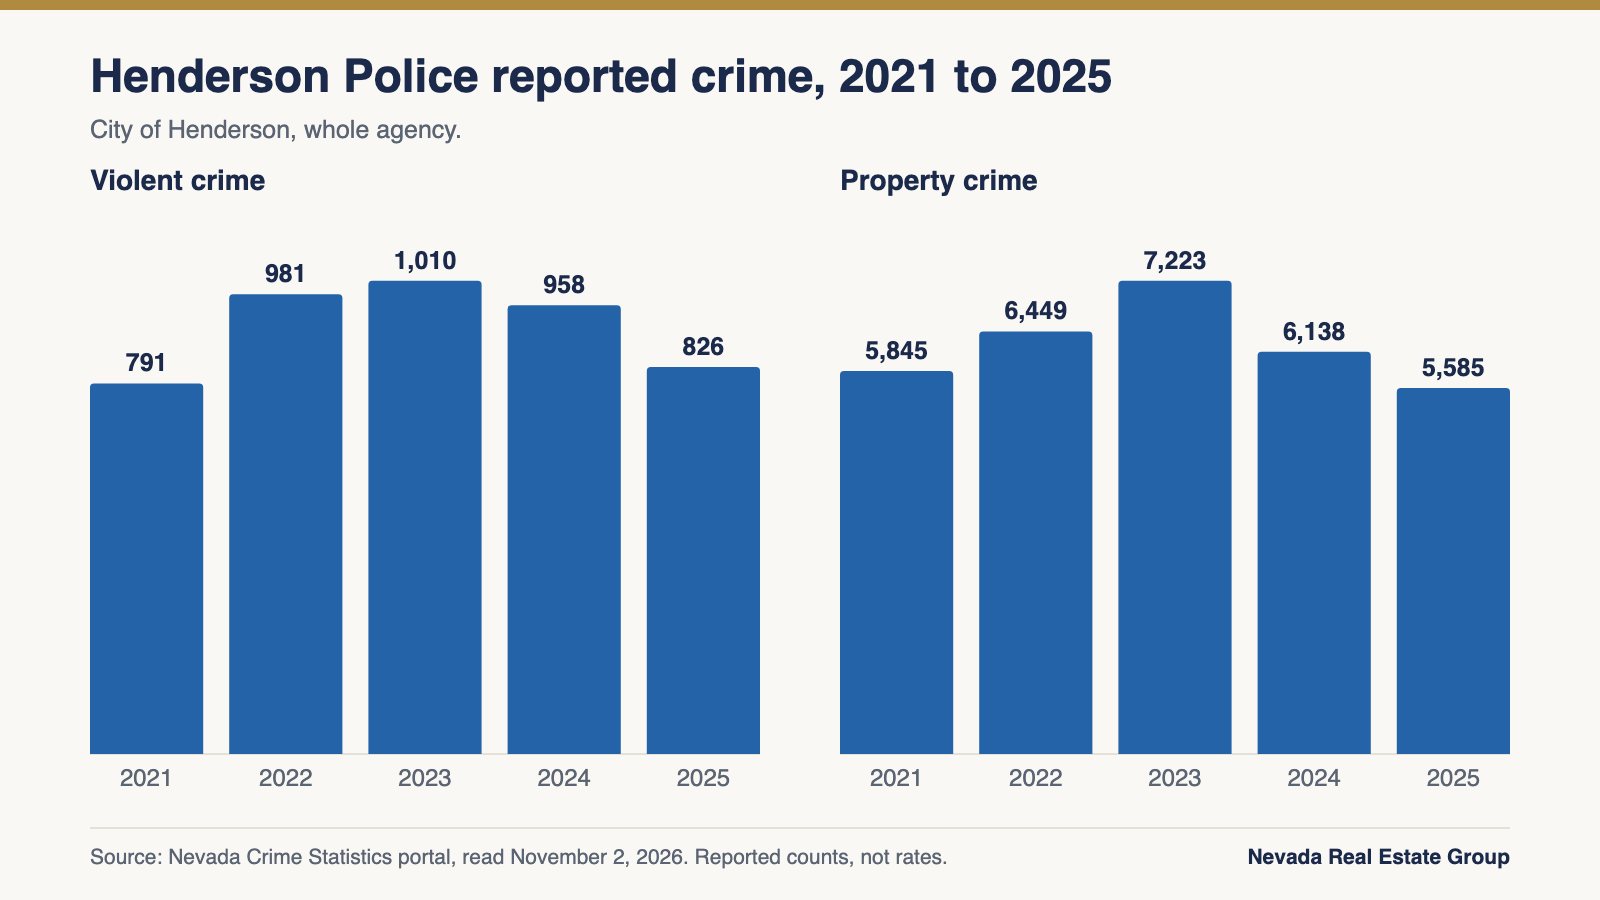
The 2025 fall was larger than the national estimate on violent crime and smaller on property crime. The portal shows Henderson down 13.78% and 9.01%. The FBI estimated the nation down 9.3% and 12.4% from 2024 to 2025. Inside those totals, aggravated assault fell 18.98%, motor vehicle theft 22.76% and larceny 5.39%, while rape was almost flat at 106.
The city grew over the same period. Census Bureau estimates show 347,910 residents in 2024 and 353,289 in 2025. A growing population with a smaller count means a falling rate. The portal doesn't say why the counts moved, and we won't guess. Fewer reported crimes can reflect less crime or less reporting. Start any comparison at 2021, when the national program moved to incident-based reporting, and keep to one source.
What makes up Henderson's violent and property totals?
Larceny is the largest single category, at 3,841 offenses, about 69% of the 5,585 property crimes in the state's 2025 report. Aggravated assault, at 538, is about 65% of the 826 violent crimes. Those two lines shape most of what you see in a Henderson total.
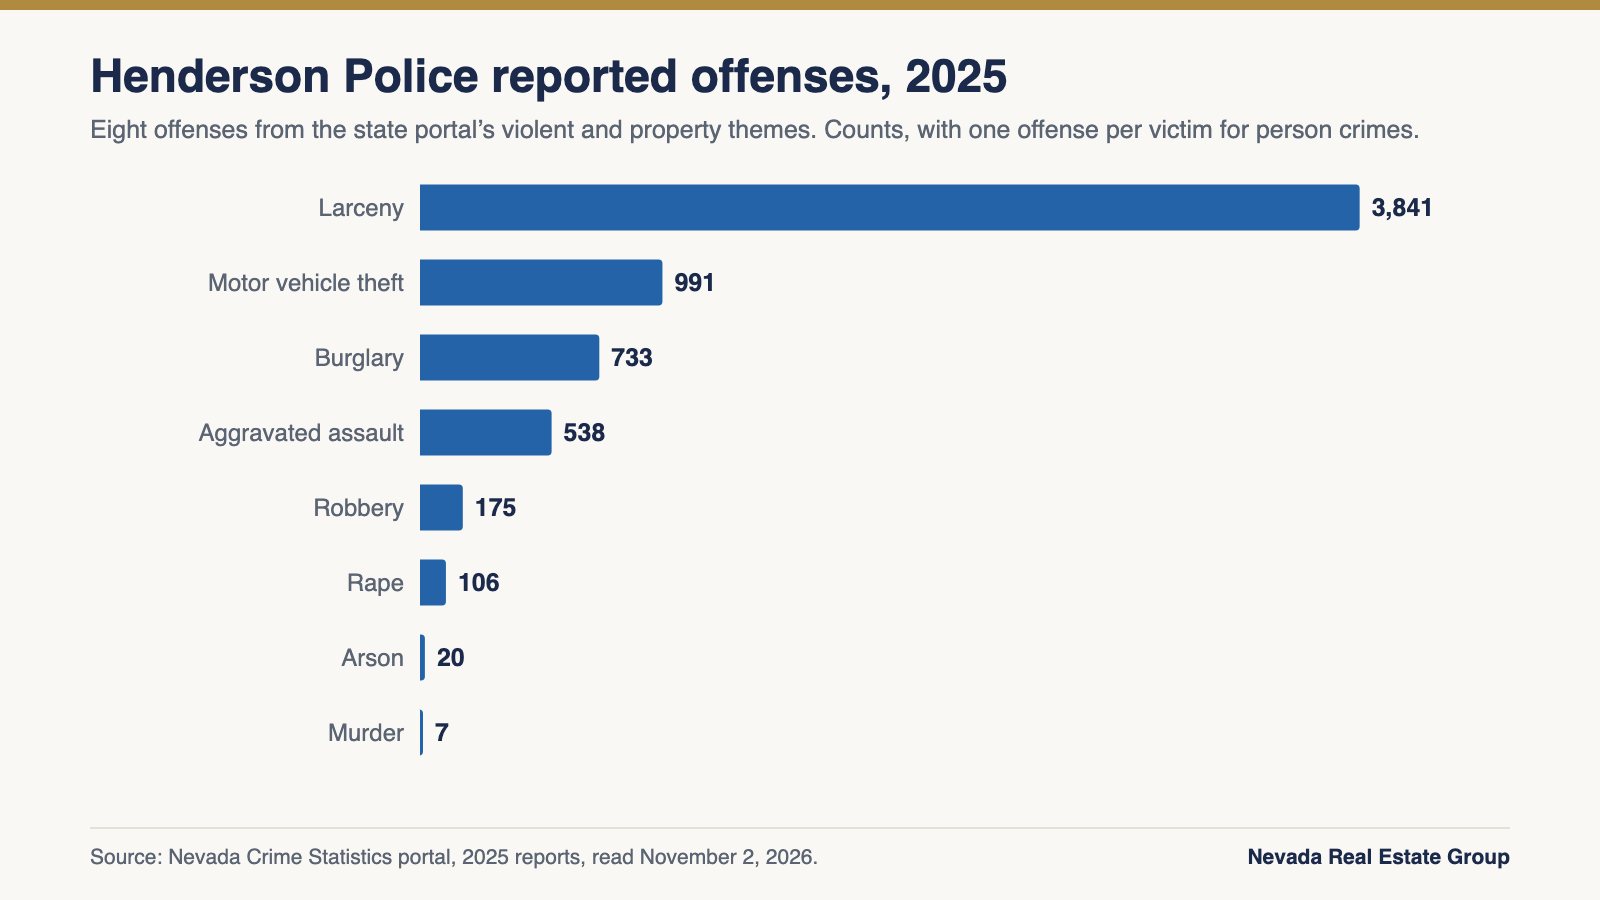
| Offense | 2024 | 2025 | Change | Cleared, 2025 |
|---|---|---|---|---|
| Murder | 9 | 7 | -22.22% | 71.43% |
| Rape | 105 | 106 | 0.95% | 51.89% |
| Robbery | 180 | 175 | -2.78% | 53.14% |
| Aggravated assault | 664 | 538 | -18.98% | 61.52% |
| Burglary | 761 | 733 | -3.68% | 23.33% |
| Larceny | 4,060 | 3,841 | -5.39% | 30.02% |
| Motor vehicle theft | 1,283 | 991 | -22.76% | 4.34% |
| Arson | 34 | 20 | -41.18% | 40.00% |
Read small lines with care. Going from 9 murders to 7 is a 22.22% change on two cases, and arson's 41.18% fall rests on 14 fewer offenses. A clearance rate is how many offenses the agency reported as cleared, so it describes its cases rather than the chance of a crime near a home. The Bureau of Justice Statistics also found that nationally only 25.4% of thefts other than burglary and vehicle theft were reported to police in 2024, against 75.0% of motor vehicle thefts, so category totals don't all understate reality by the same amount.
What should you make of national city crime rankings?
Treat them with care until you've read the method. City lists come from private publishers, each with its own formula, and none is an FBI or state finding. The FBI doesn't rank cities. Its caution against ranking says such lists "provide no insight into the many variables that mold the crime in a particular town, city, county, state, region, or other jurisdiction," and that they "lead to simplistic and/or incomplete analyses that often create misleading perceptions."
Henderson's figures are good evidence for what they cover, and the numbers above stand on their own. A rank adds little to them. It depends on which cities are in the group, the year, the offenses counted and the weights a publisher chooses. It also hides the factors the FBI says must be weighed, including population density, commuting patterns and how readily residents report minor crimes. The FBI adds that one city may report more crime than a comparable one because its agency identifies more offenses, not because more crime took place.
If you run into a list, ask four questions. Which year's data does it use? Does it use FBI, state or estimated figures? Does it state a population for each city? And does it apply one method to every city? A list that can't answer those isn't worth much, whichever way it points.
It's also worth asking what a rank would change. A city-level position can't tell you about a block, and the home you buy sits on a block. The rest of this guide is about getting to that level.
Can you find crime rates for Green Valley, Anthem or other Henderson neighborhoods?
Not as an official rate. The FBI and state stop at the agency, so no public report gives a figure for Green Valley, Anthem, Inspirada, Cadence or any other Henderson community. We found no record that places any neighborhood above or below the citywide level, or that shows which corridors have the most crime, so this guide doesn't name any.
What's available is address-level. The Henderson Police Department's Crime Search map is the place to start, and our crime map lookup guide walks through the valley's tools. We couldn't open the city's pages on November 2, 2026, so ask the department what period the map covers and where older records sit.
A neighborhood label wouldn't help much anyway. A master plan like Anthem or Green Valley covers many subdivisions, plus shopping centers and offices, and no record set is drawn around it. Your own window on the map, with one radius and one date range, gives you something a label can't: dates, offense types and locations you can read yourself.
For the housing side, including prices, HOA dues and home types, our Henderson page and Henderson buying guide cover each community without treating price as a measure of crime. No source we read separates crime from schools, age of home, views or amenities in a Henderson home's price.
Do guard-gated communities in Henderson actually reduce crime?
We can't find a figure that answers this for Henderson. The Henderson Police Department, the state and the FBI don't report crime by gate or HOA. Gated and ungated homes sit inside the same police reporting, and the public files don't separate them.
If a gate matters to you for privacy, access or peace of mind, treat it as a property feature and verify it in writing. Nevada's resale package under NRS 116.4109 includes the declaration, bylaws, rules, operating budget and a financial statement, so you can see what the association pays for. Then ask:
- Is the gate staffed, during which hours, and what can staff do?
- Does the association contract for patrols or cameras, and what does the contract cover?
- How do emergency vehicles, deliveries and guests get in?
- What did the budget spend on security last year, and is an increase planned?
Our guard-gated communities page lists those communities. It's a housing-type list, not a safety ranking.
For the home itself, ask the Henderson Police Department about its home security inspection page and whether it applies to your address, and pull the same incident data for a gated home as for any other.
How does the Henderson Police Department operate?
Henderson has its own police department, separate from LVMPD, which covers the City of Las Vegas and unincorporated Clark County. That means Henderson's crime reports stop at the city line. It also means a Henderson mailing address isn't proof that a home is inside the city. If an address sits in unincorporated Clark County, LVMPD responds and LVMPD's data applies. Clark County's jurisdiction lookup, built for business licensing, shows which applies.
The department's records and clearance figures are public through the state portal. In 2025, it reported 58.60% of violent crimes and 24.62% of property crimes cleared. The FBI's national summary notes that agencies using the national incident-based system can report up to 10 offenses in a single incident, which helps explain why a single event can move a count by more than one.
If you have a question about a specific record, the department is the right place to ask, and it can tell you what it's able to release.
What can buyers do to evaluate a Henderson address?
Work from the address outward, and treat every home the same way.
| Step | Where | What to note |
|---|---|---|
| Confirm the agency | Clark County lookup | City of Henderson or unincorporated Clark County |
| Read recent incidents | Crime Search map | Offense, date and location; ask what window the map covers |
| See the whole-city trend | State portal | Full years; no neighborhood detail |
| Visit | Weekday, evening and weekend | Lighting, traffic, noise, parking and nearby commercial uses |
| Read the HOA documents | Resale package under NRS 116.4109 | Rules, budget and any security contracts |
| Ask the agency | Henderson Police Department | Specific questions about what you found |
If you're comparing a Henderson home with one in Las Vegas or North Las Vegas, use the shortest window all the tools share and pull them on the same day. CrimeMapping.com, used by North Las Vegas, keeps 180 days, so ask Henderson police what window its map covers. Match offense types rather than icons, and leave calls for service out, because a call isn't a confirmed crime and agencies publish them differently.
Keep notes of what you can and can't find. A blank on a map might reflect filters or date settings rather than an absence of incidents. And separate observations from conclusions. "The back gate faces a busy road" is something you can check. "This area feels unsafe" isn't, and it can lean on impressions of the people there rather than facts about the property.
What can't a crime number tell you about a Henderson home?
It can't tell you what will happen on a street, and it leaves out what was never reported. Nationally, about 47.9% of violent victimizations and 30.5% of property crimes reached police in 2024, according to the Bureau of Justice Statistics' Criminal Victimization, 2024.
Price is no substitute. The median home price in a city is shaped by age of housing, lot sizes, schools, views and much else, and no source we could find isolates crime from the rest. Treating a price as a safety score would mislead you, and it would also imply something about the people who can or can't pay it.
Don't count on a seller's disclosure to fill the gap. Our crime statistics guide walks through NRS 40.770, which makes most past felonies at a property immaterial to a sale, and NRS 179B.270, which limits housing-related use of the state registry. Ask a Nevada attorney how either applies to you.
That's why this guide uses the same sources for every part of Henderson and doesn't suggest where anyone should live. The National Association of REALTORS' fair housing FAQ tells agents to "share the same kind of neighborhood information with all clients," and asks them to stay objective and factual.
To compare specific homes, browse Henderson homes for sale, call (702) 637-1759 or contact Nevada Real Estate Group. We can help you pull the same records for each address, and the choice of where to live is yours. If you're selling, our seller resources cover that side.
Frequently Asked Questions
What is Henderson's crime rate?
State portal figures for 2025 work out to about 234 violent and 1,575 property crimes per 100,000 residents, based on 826 violent crimes, 5,565 property crimes without arson and a Census population of 353,289. The FBI's national estimates were 327.6 and 1,534.8. Those are citywide figures from one year.
Is Henderson safer than Las Vegas?
The two can't be fairly summed up in one word. State portal counts on Census population work out to about 234 violent and 1,575 property crimes per 100,000 residents in Henderson for 2025, and about 415 and 2,477 for LVMPD. LVMPD's area also includes unincorporated Clark County and the resort corridor. Neither figure describes a particular neighborhood.
Is crime going down in Henderson?
On the state portal, violent crime fell 13.78% to 826 in 2025, and property crime fell 9.01% to 5,585. Both have dropped for two years from 2023 peaks of 1,010 and 7,223. The portal doesn't explain why, and these are counts rather than rates.
Does Henderson have its own police department?
Yes. The Henderson Police Department is separate from the Las Vegas Metropolitan Police Department and reports its own figures. An address outside the city limits falls to LVMPD, so confirm the jurisdiction first.
Which parts of Henderson have the most crime?
No official source publishes Henderson crime by neighborhood, and we don't rank areas. Henderson's Crime Search map is the place to start for a specific address. Use the same radius and dates for each home you're considering, and ask the department about anything you find.
How do I check crime near a specific Henderson address?
Confirm the address is in the city with Clark County's lookup, then use Henderson's Crime Search map. Note offense types and dates, repeat the same search for every home you're considering, and visit at different times of day. Ask the department about specific records.
Are national city crime rankings reliable?
They're private rankings, not FBI or state findings, and each uses its own formula. The FBI cautions that rankings give no insight into the variables that shape crime and can create misleading perceptions. If you use one, check its year, source and method, and rely on the agency figures themselves.
Which Sources Inform This Henderson Safety Guide?
We read these on November 2, 2026. Rates per 100,000 are our arithmetic from state portal counts and Census populations.
- UCR Summary of Reported Crimes in the Nation, 2025: national estimates, the FBI's property crime definition, the 10-offense limit and the April 2, 2026 data cutoff.
- Nevada Crime Statistics portal: Henderson violent and property reports, 2021 to 2025, plus LVMPD, North Las Vegas and Boulder City.
- Census Bureau 2025 population estimates for Nevada and Clark County jurisdiction lookup.
- FBI caution against ranking, from Crime in the United States, 2011, and BJS, Criminal Victimization, 2024: limits of the data and shares of crime reported to police.
- NRS 40.770, NRS 179B.270, NRS 116.4109 and the NAR fair housing FAQ: disclosure, registry use, resale packages and the April 24, 2026 HUD letter.
- The FBI's agency tables and the City of Henderson's website couldn't be read on November 2, 2026, so nothing above relies on them. The links to them are pointers only, so confirm any detail with the department.
Agency tools, windows and figures change. Check the date on every number you use, and confirm the current version with the agency before you rely on it. All services are offered in compliance with the Fair Housing Act.