
Las Vegas home prices have climbed steadily since 2020, and the question on every buyer's, seller's, and investor's mind is the same: is the Las Vegas housing market in a bubble? It is a fair question, and it deserves a data answer rather than a gut feeling. Home values in the valley are up more than 50% from their early-2020 levels, mortgage rates have more than doubled off the pandemic lows, and every few weeks another national headline warns that a "correction" is coming.
I am Chris Nevada with the Nevada Real Estate Group. We've closed more than 9,600 transactions across the valley — 789 of them in 2025 alone, totaling over $440 million in volume — and in our experience the bubble question comes up weekly. So instead of a hot take, this guide walks through the actual numbers: price-to-income ratios, cap rates, rent-versus-buy math, months of supply, the share of homes cutting price, mortgage-rate context, and a side-by-side with 2008. Every figure below is pulled from live Las Vegas REALTORS (GLVAR) MLS data or a named public source.
No — by the traditional tests, Las Vegas is not in a 2008-style bubble in 2026, though it is fully valued rather than cheap. The median home sold for $440,678 over the trailing 90 days — about 6.0 times Clark County's $73,845 median income. The tell that this is a normalizing market, not a mania: 59% of homes sold below asking, and inventory has rebuilt to roughly seven months of supply.
- Median Las Vegas home sold at $440,678 in a median of 27 days (GLVAR MLS, trailing 90 days).
- Price-to-income near 6.0x versus a long-run norm closer to 4x — elevated, not a 2006-scale extreme.
- 59% of Las Vegas sales closed below list; only 18% sold above asking — no frenzy.
- Active inventory rebuilt to roughly 8,784 listings, near seven months of supply versus under two months in 2021.
- Lending is tight, net cap rates are thin (roughly 3.5%–4%), and there is no foreclosure wave — a 2008 crash is unlikely.
What Does the Data Say About a Las Vegas Housing Bubble in 2026?
A bubble, in the technical sense, is when asset prices detach from their underlying fundamentals and are propped up only by the expectation of further price gains. That is what happened in Las Vegas in 2004–2006, when no-documentation loans and speculative flipping pushed values far past what local incomes and rents could justify. So the honest test is not "have prices gone up a lot?" — they have — but "are today's prices anchored to income, rent, and demand, or are they floating free?"
NREG proprietary read (GLVAR MLS, trailing 90 days, mid-April to mid-July 2026): Across the 3,376 Las Vegas closings recorded in the MLS over that window that my team analyzed for this report, the median home changed hands at $440,678 in 27 days, and 59% of those sales closed below the seller's original asking price. That combination — steady absorption but widespread price concessions — is the signature of a balanced, fully-priced market, not a speculative blow-off top where everything sells over ask in a weekend.
Here is the quick scorecard on the classic bubble indicators, then we will work through each one.
| Bubble test | 2006 peak (mania) | 2026 today | Verdict |
|---|---|---|---|
| Price-to-income ratio | ~5.5x and climbing | ~6.0x, roughly flat | Elevated, not accelerating |
| Lending standards | No-doc, subprime, 100% financing | Documented income, ~740 median FICO | Far healthier |
| Share sold above list | Vast majority, bidding wars | Only 18% above ask | No frenzy |
| Months of supply | Ballooning toward 12+ | ~7 months, normal listings | Balanced, not distressed |
| Buyer profile | Flippers and speculators | Owner-occupants and relocators | Demand floor is real |
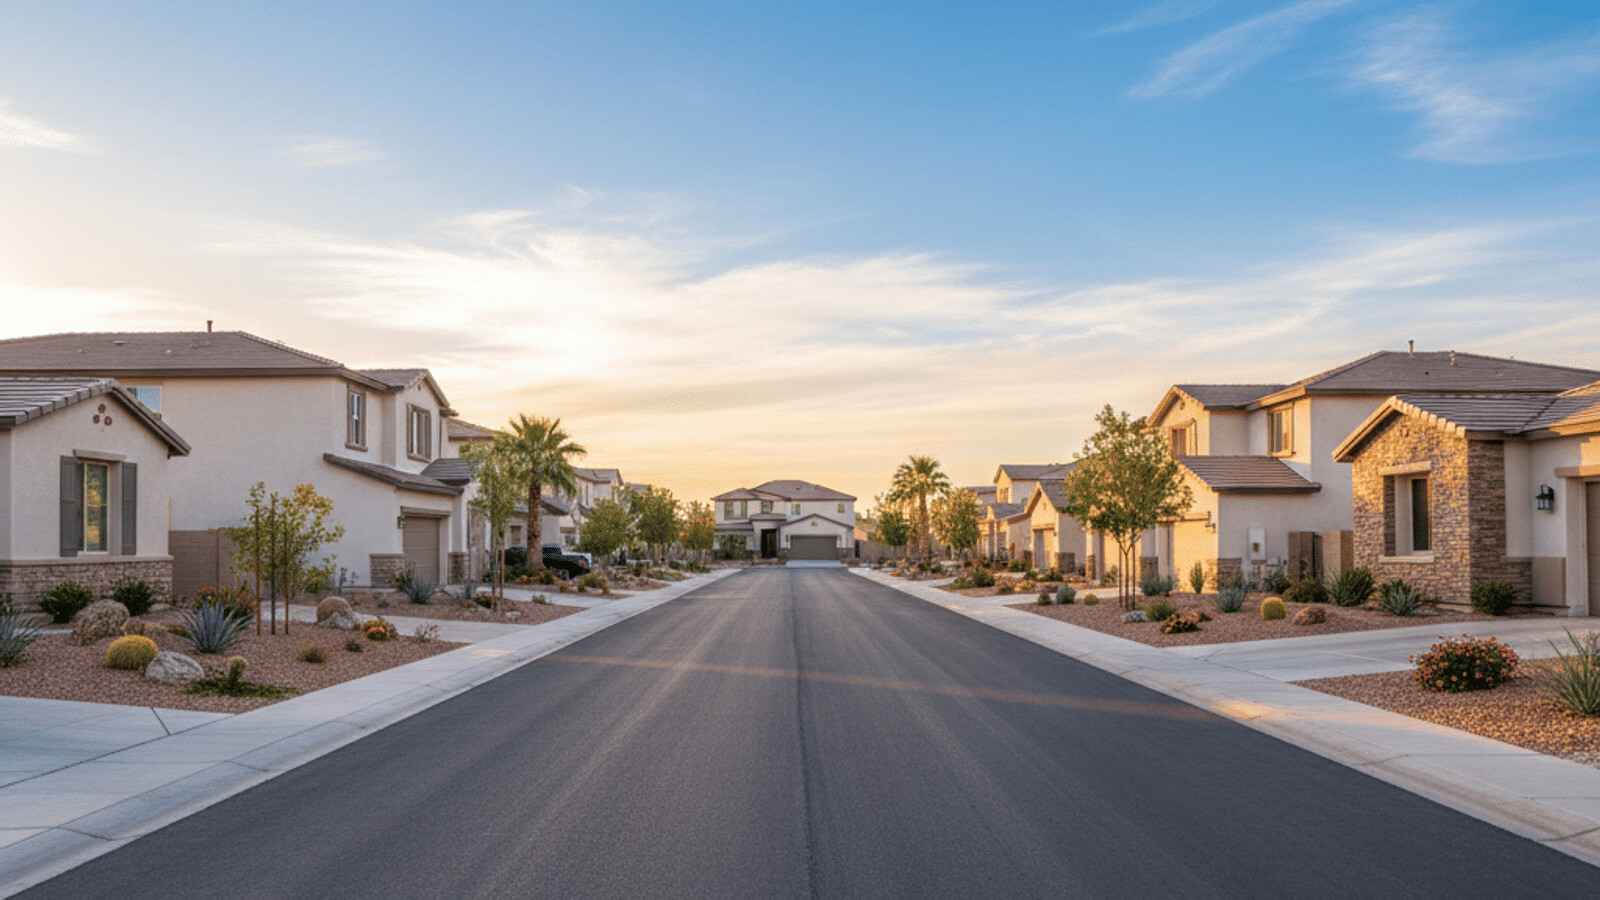
How Elevated Is the Las Vegas Price-to-Income Ratio Right Now?
Price-to-income is the single cleanest bubble gauge. According to the U.S. Census Bureau, Clark County's median household income is $73,845 and the county holds about 2.29 million residents. Against the trailing-90-day median sold price of $440,678, that puts the Las Vegas price-to-income ratio at roughly 6.0x. If you use the current median list price of $470,801, the ratio stretches to about 6.4x.
For context, Las Vegas historically ran closer to a 3.5x–4x price-to-income ratio through the 1990s and early 2000s. At the 2006 peak, the ratio pushed to roughly 5.5x before the crash. So today's 6.0x is genuinely elevated — arguably the most stretched single number in this whole analysis, and the honest reason I tell buyers the valley is "fully priced, not cheap."
But two things keep 6.0x from screaming "bubble." First, the ratio has been roughly flat for two years rather than accelerating — mania ratios climb every quarter, and this one has not. Second, a big slice of buyers arriving in Las Vegas are equity-rich relocators from California and the Pacific Northwest whose purchasing power is not captured by the local median income; a household cashing out a $900,000 Bay Area home buys very differently than the Clark County median earner. When you adjust for that imported equity, the effective affordability picture is less alarming than the raw ratio implies. If you are weighing the buy decision on your own numbers, our first-time buyer guide and the home value estimator are good starting points.
| Metric | 2026 value | Long-run norm | 2006 peak |
|---|---|---|---|
| Median sold price | $440,678 | — | approx. $315,000 |
| Median household income | $73,845 | — | approx. $52,000 |
| Price-to-income ratio | ~6.0x | ~4.0x | ~5.5x |
| Price-to-rent ratio | ~18x–24x | ~15x | ~22x |
What Are Cap Rates Telling Investors About Las Vegas in 2026?
Cap rates on Las Vegas single-family rentals have compressed from roughly 7%–8% in 2012 to the low-single digits today. Run the current math: a median home near $440,000 that rents for around $2,050 per month grosses about $24,600 a year — a gross yield near 5.6%. Strip out the real costs of ownership (property taxes, insurance, management, maintenance, and vacancy typically eat 30%–40% of gross rent) and the net cap rate lands closer to 3.5%–4%.
That compression sounds alarming, but context matters. Cap-rate compression is normal in markets with sustained job growth, population inflows, and institutional demand — all three describe Las Vegas. The risk only appears when values outrun rents so far that the deal only works if prices keep climbing. We are not clearly in that danger zone, but the margin for error on an investment purchase is thinner than it was in 2020 or 2021. According to Las Vegas REALTORS, the income side of the equation — rents and occupancy — has held up, which is what keeps a floor under values.
The practical takeaway for investors: run your numbers at today's 3.5%–4% net cap rates, not the 6%–7% you might remember. If a property does not cash flow at current prices and current mortgage rates, do not force it on the assumption that appreciation bails you out. There are still pockets of yield — older stock in North Las Vegas and select guard-gated communities with strong rent premiums — but you have to be selective. For a deeper dive on the luxury tier specifically, see our breakdown of cap rates and appreciation in luxury Las Vegas neighborhoods.
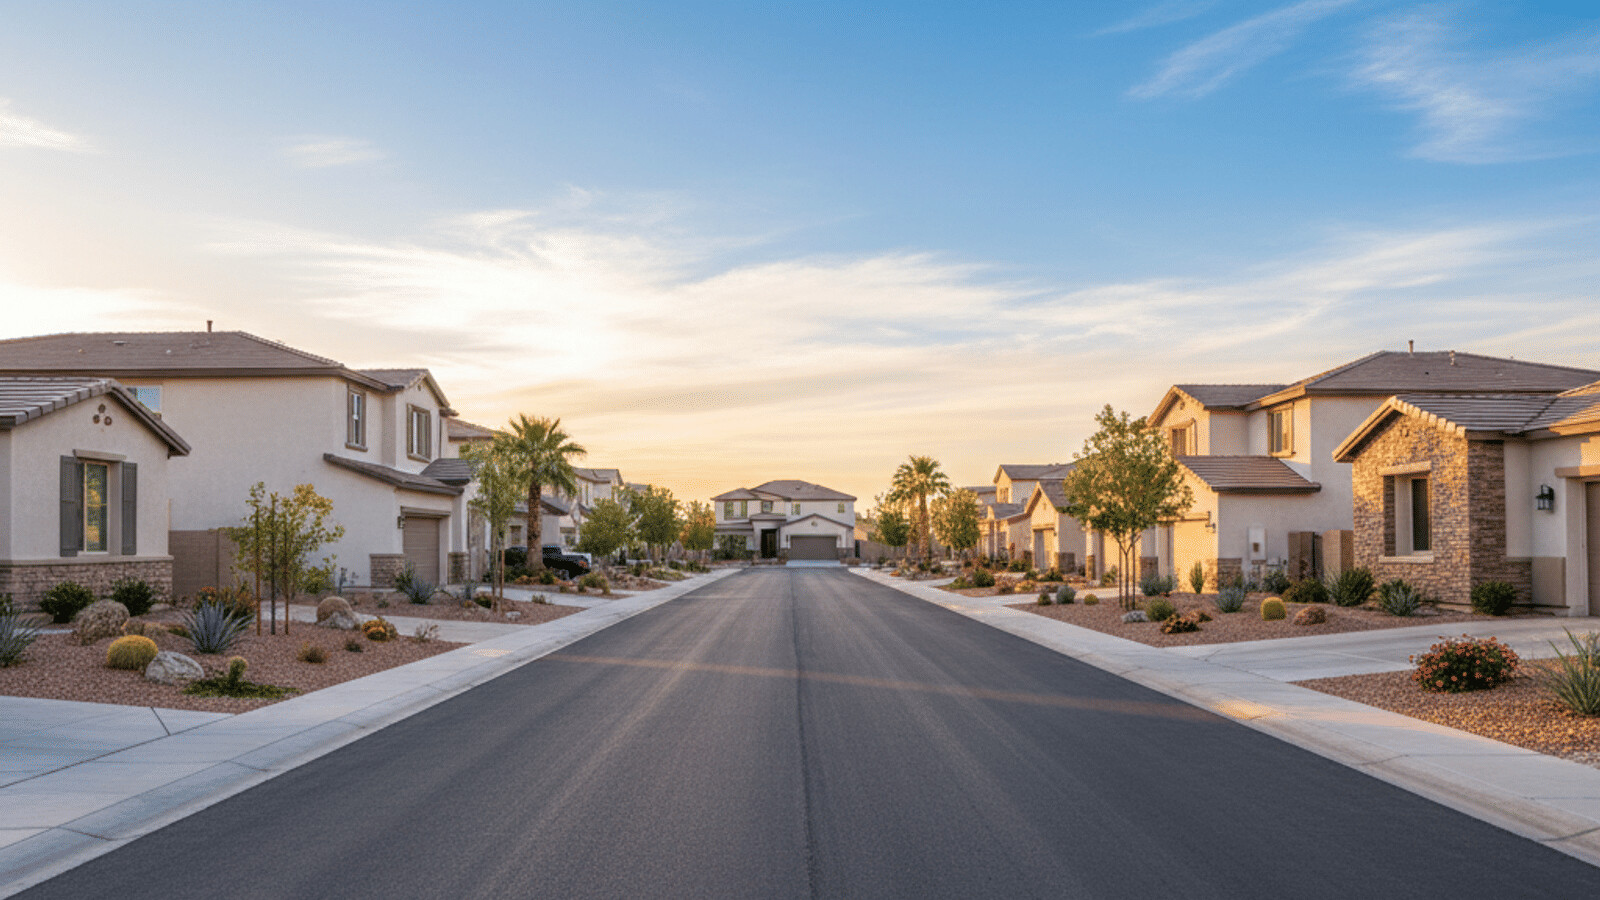
Is Renting or Buying the Better Math in Las Vegas Today?
With cap rates thin, it is worth asking the flip side: does the rent-versus-buy math favor renting right now? According to the U.S. Census Bureau, the Clark County median gross rent is $1,518 per month across all unit types; a typical single-family rental in the valley runs closer to $2,050. Compare that to the monthly cost of owning the median home.
| Line item | Rent (SFR) | Buy ($440k, 20% down) |
|---|---|---|
| Monthly housing cost | $2,050 | $2,225 (P&I) |
| Property tax (approx.) | $0 | $220 |
| Insurance | $25 (renters) | $110 |
| Maintenance reserve | $0 | $185 |
| Approx. monthly total | $2,075 | $2,740 |
On a pure monthly-cash basis, renting is currently about $665 cheaper than owning the median home — before you count the mortgage principal you build as forced savings, the mortgage-interest and property-tax deductions, and any appreciation. That gap is exactly why the rent-versus-buy call is close in 2026 and depends heavily on how long you plan to stay. Under roughly three to four years, renting often wins on cost; past five to seven years, ownership's equity build and Nevada's landlord-friendly, income-tax-free structure usually pull ahead. We walk through the full break-even in our dedicated guide on whether you should rent or buy in Las Vegas. The key point for the bubble question: when rents are within a few hundred dollars of ownership cost, prices are anchored to something real — that is not what a bubble looks like.
How Much Inventory and Months of Supply Does Las Vegas Have?
Inventory is where the 2026 story diverges most sharply from both 2021 and 2008. Las Vegas currently carries roughly 8,784 active for-sale listings with a median list price of $470,801 (GLVAR MLS). Against the trailing-90-day sold pace of about 1,125 closings per month, that works out to roughly 7 months of total supply — and for the single-family core specifically, closer to 6 to 7 months.
Why that matters: months of supply is the pressure gauge of a housing market. Under 3 months is a seller's market; 4 to 6 months is balanced; above 6 months tilts toward buyers. In early 2021, Las Vegas was choking on under two months of supply, which is what drove the frantic over-list bidding. Today's ~7 months is a completely different, far healthier picture — inventory has normalized.
Crucially, this is normal inventory: ordinary sellers listing homes, not a foreclosure flood. In 2008, months of supply ballooned past 12–18 months precisely because distressed and bank-owned properties dumped onto the market all at once. Nothing like that is happening in 2026. According to Las Vegas REALTORS, foreclosure and short-sale activity remains a small fraction of total listings. Elevated inventory that clears in a median of 27 days is a sign of a market finding equilibrium, not one cracking. You can watch live inventory move on our Las Vegas home search.
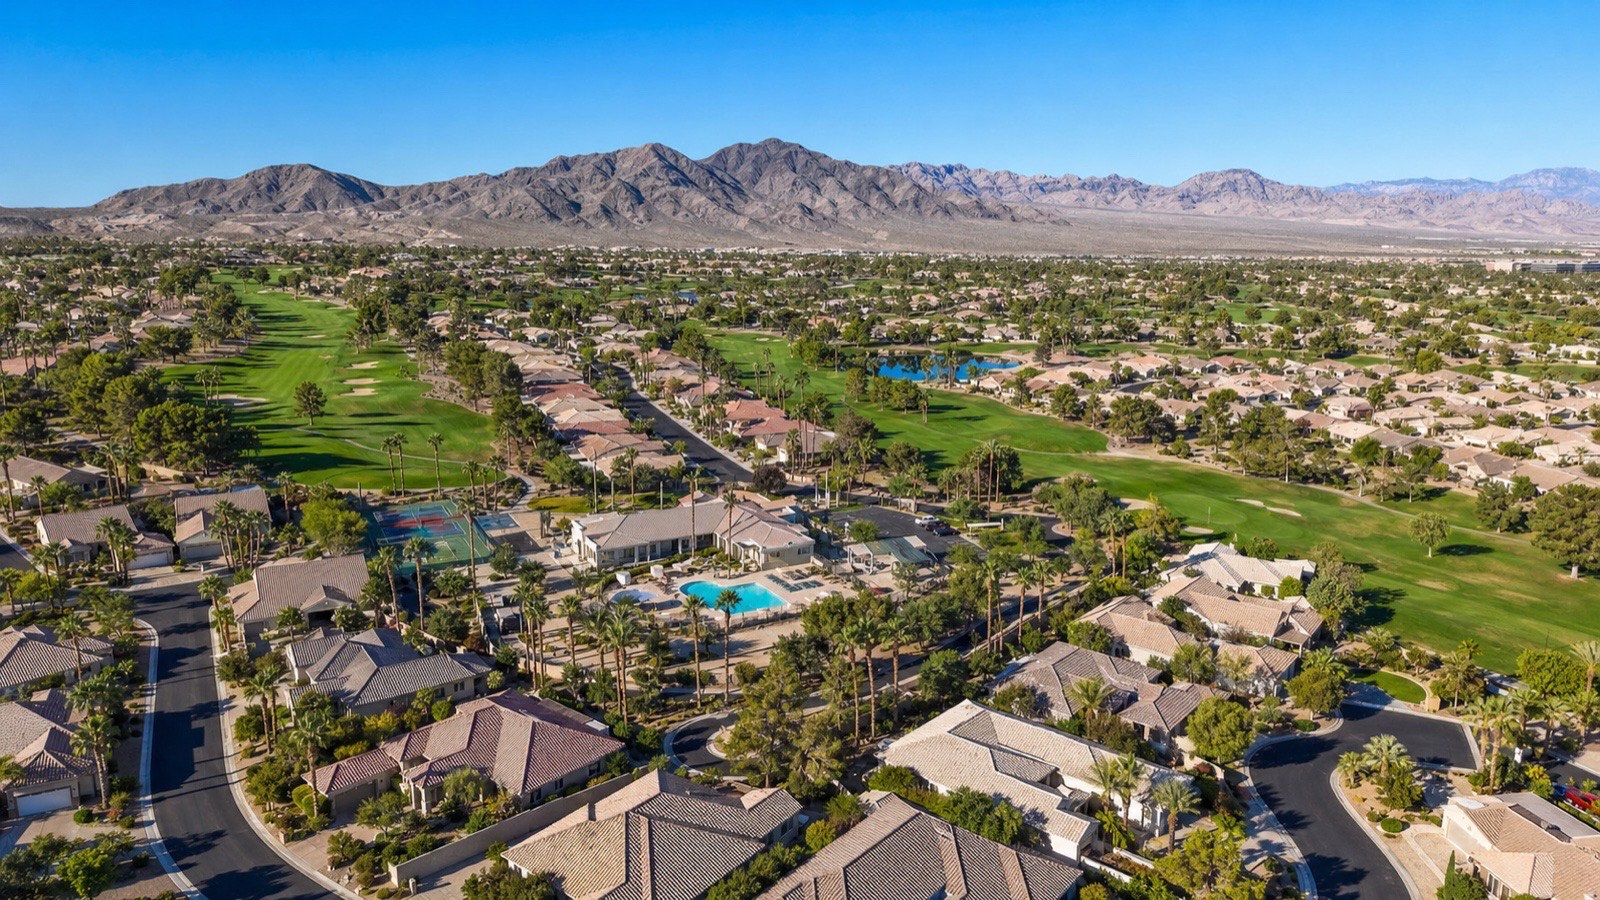
What Share of Las Vegas Homes Are Selling Below Asking Price?
This is my favorite single stat in the whole analysis because it is impossible to fake. Over the trailing 90 days, 59% of Las Vegas homes sold below their original asking price, only 18% sold above list, and the remaining ~23% closed at or near asking (GLVAR MLS). In Henderson the below-list share was even higher at 60%; in Boulder City it hit 78%.
Contrast that with a genuine bubble or a supply-starved frenzy, where the overwhelming majority of homes sell over list within days as buyers waive contingencies and escalate. A market where six in ten homes close under ask is a market where buyers have negotiating leverage and sellers must price realistically — the precise opposite of speculative froth.
For sellers, the message is blunt: the days of naming a price and watching offers pile in are over. Overpricing in this environment costs you days on market and leverage. Price it right the first time, and consider a data-backed pricing strategy — our seller resources and home value estimator are built for exactly this market. For buyers, that 59% below-list figure is your opening to negotiate on price, closing costs, rate buydowns, and repairs.
How Do Mortgage Rates Change the Bubble Question?
You cannot talk about a 2026 bubble without talking about mortgage rates, because affordability is a function of price and rate. According to Freddie Mac's Primary Mortgage Market Survey, the 30-year fixed has held in the mid-6% range through 2026 — more than double the sub-3% pandemic lows. That single change did more to reset Las Vegas affordability than any price move.
Here is the counterintuitive part: high rates are actually bubble-protective. In a classic bubble, cheap and loose credit is the fuel. Today's elevated rates do the opposite — they act as a natural brake, pricing out marginal buyers, cooling bidding wars, and forcing the 59%-below-list dynamic we just covered. A market cannot simultaneously be a credit-fueled mania and be gated by 6.5% mortgages that screen out over-leveraged buyers.
The flip side is a "lock-in" effect: millions of homeowners nationwide hold sub-4% mortgages and are reluctant to sell and re-buy at 6.5%, which restrains new listings and keeps a floor under prices even as demand softens. That tension — soft demand from high rates, but tight supply from lock-in — is why most analysts expect Las Vegas prices to move sideways to modestly up rather than crash. If rates ease into the 5% range over the next couple of years, pent-up demand could re-accelerate prices; buyers waiting for a crash may instead face renewed competition. Strategies like a 2-1 buydown on new construction are one way buyers are managing today's rate.
How Does 2026 Compare to the 2008 Las Vegas Housing Crash?
Las Vegas was the epicenter of the 2008 crash — values fell more than 60% peak to trough, and the valley led the nation in foreclosures. So the comparison is fair to make, and reassuring to run. The 2008 collapse had four ingredients that are simply absent in 2026.
First, lending. In 2005, a buyer could get a no-income, no-asset, 100%-financed loan on a home they never intended to occupy. Today, according to the Consumer Financial Protection Bureau, documented income and ability-to-repay rules are the law, and the median purchase FICO in this cycle sits near 740. Second, buyer profile: 2005 was flippers and speculators; 2026 is owner-occupants and relocators putting down roots. Third, equity: homeowners hold historically high equity cushions today versus the near-zero equity of 2007, so a price dip does not instantly trigger a wave of underwater walk-aways. Fourth, supply: builders overbuilt massively into 2007; today the valley remains structurally under-supplied relative to household formation.
| Condition | 2007 (pre-crash) | 2026 (today) |
|---|---|---|
| Loan quality | Subprime, no-doc, 100% LTV | Documented, ~740 FICO |
| Homeowner equity | Near zero, negative for many | Historically high |
| Foreclosure share | Surging, dominant by 2009 | Small fraction of listings |
| New-home overbuild | Severe oversupply | Structural undersupply |
| Buyer type | Speculators and flippers | Owner-occupants, relocators |
None of that guarantees prices only rise. It means the mechanism that produced a 60% crash — a forced-selling foreclosure cascade — is not loaded in 2026. A modest correction of a few percent is possible if rates spike or the economy stalls; a 2008 repeat is not the base case.
Are Migration and Job Growth Still Supporting Prices?
Demand fundamentals are the bull case, and they are strong. According to the U.S. Census Bureau, Clark County has grown to about 2.29 million residents, and Nevada remains among the fastest-growing states in the country. Remote workers, retirees, and business owners keep relocating from higher-cost, higher-tax states — bringing equity and purchasing power with them, and buying primary residences rather than speculative flips.
On the jobs side, according to the U.S. Bureau of Labor Statistics, Nevada payrolls have expanded by tens of thousands of positions over the past year, with the diversification away from pure gaming — logistics, healthcare, professional services, sports and entertainment — continuing to broaden the economic base. The Raiders, the Golden Knights, the coming Athletics ballpark, and a growing convention and film footprint all add durable, non-gaming employment. Per the Bureau of Economic Analysis, Nevada's economic output continues to expand, and Nevada's lack of a state income tax remains a structural magnet for both households and employers.
That sustained inbound demand creates a floor that did not exist in the mid-2000s bubble, when buying was driven by leverage and speculation rather than population growth. It is the core reason a true crash is unlikely: you can have soft years and flat stretches, but it is very hard to crater prices in a metro that keeps adding residents and jobs. Whether you are relocating to Henderson or eyeing Summerlin, that demand backdrop is the reason the long-term case for the valley stays intact.

Which Las Vegas Submarkets Look Frothy vs Fairly Valued?
"Las Vegas" is not one market — it is a dozen submarkets with very different data. Pulling live GLVAR numbers across the major jurisdictions shows meaningful spread in both pricing and negotiating leverage, which is exactly why a blanket "bubble/no bubble" call is too crude.
| Market | Median sold | Active listings | Median DOM | % sold below list |
|---|---|---|---|---|
| Las Vegas | $440,678 | 8,784 | 27 days | 59% |
| Henderson | $499,990 | 2,488 | 28 days | 60% |
| North Las Vegas | $425,000 | 1,075 | 21 days | 40% |
| Boulder City | $399,000 | 138 | 43 days | 78% |
Read that table like an analyst. North Las Vegas is the tightest of the four — fastest sales at 21 days and the lowest below-list share (40%) with 28% selling above ask, which tells you demand there still outstrips supply, largely on affordability. Boulder City is the softest, with 43-day marketing times and 78% of homes closing under ask — a small, price-sensitive market where sellers hold most of the risk. Henderson commands the top median at $499,990 but shows the same 60%-below-list buyer leverage as the valley overall. None of these look like a bubble about to pop; they look like distinct markets at different points of a normal cycle. If you are shopping a specific city, the Henderson homes-for-sale hub and Las Vegas homes-for-sale hub show live inventory and pricing.
What Should Buyers Do If They're Worried About a Bubble?
If you are a buyer sitting on the sidelines waiting for a crash, the data says you are probably waiting for something the fundamentals do not support. Here is the disciplined approach. First, buy for the long term — a five-to-seven-year horizon absorbs the sideways stretches that are likely and lets equity and Nevada's tax advantages compound in your favor. Second, use your 2026 leverage: with 59% of homes selling below list, negotiate hard on price, seller-paid closing costs, and rate buydowns rather than assuming appreciation rescues an overpay.
Third, do not stretch. Buy what you can afford at today's payment, at today's ~6.5% rate, without betting on a refinance. If rates fall, you refinance into a lower payment — upside. If they do not, you are still comfortable — no downside. Fourth, prioritize durable neighborhoods: strong schools, employment access, and infrastructure investment hold value best through any softness. Fifth, get pre-approved and get educated before you shop; our buyer resource hub and mortgage pre-approval guide help you frame the numbers. When you are ready to run your specific situation, reach out to our team at (702) 637-1759.
What Should Sellers and Investors Do in a Balanced Market?
For sellers, 2026 is still a good market to sell into — you are working from historically high equity and prices near all-time highs — but it rewards precision, not wishful pricing. With inventory at ~7 months and six in ten homes closing below list, the homes that win are the ones priced correctly on day one and prepped to show well. Overpricing to "test the market" now means chasing the price down over 60-plus days of stale market time. Lean on a comparative market analysis and a data-driven list price; our seller tools and home value estimator exist for this.
For investors, underwrite conservatively. Run deals at 3.5%–4% net cap rates, stress-test for vacancy and rising insurance, and demand positive cash flow at today's prices — do not rely on appreciation to make a marginal deal work. The pockets of value are real but narrow: value-add older stock, well-located rentals with genuine rent premiums, and select new-construction where builders are buying down rates. And whichever side you are on, the single highest-leverage decision is who represents you — see our breakdown of how to identify the best real estate agent in Las Vegas before you sign anything.
How Can You Pressure-Test Your Own Las Vegas Deal?
Averages are useful for the macro question but useless for your specific transaction. A $440,678 median tells you nothing about whether the exact home you are eyeing in Summerlin, Green Valley, or Aliante is fairly priced. To pressure-test any individual deal, do four things: pull the last 90 days of comparable sales — same neighborhood, size, and condition — not valley-wide medians; check that comp's actual sold-to-list ratio against the 59% below-list backdrop; underwrite the payment at today's rate with no refinance assumption; and, if it is an investment, verify it cash flows at a 3.5%–4% net cap rate.
That is precisely the analysis my team runs on every purchase and listing. Across our 9,600-plus closings, the buyers and sellers who did best were never the ones who timed the "top" or "bottom" — they were the ones who bought a home that fit their life and their budget and held it. If you want a straight, no-spin read on what any of this means for your specific situation anywhere in the valley — Las Vegas, Henderson, Summerlin, North Las Vegas, or Boulder City — contact the Nevada Real Estate Group at (702) 637-1759.
Frequently Asked Questions
Is Las Vegas real estate in a bubble in 2026?
By the traditional bubble tests, no. Prices are fully valued — price-to-income sits near 6.0x versus a ~4x long-run norm — but they are anchored to real income, rent, job growth, and in-migration rather than floating on speculation. The tells of a normalizing market rather than a mania: 59% of homes sold below asking, and inventory has rebuilt to roughly seven months of supply. A modest correction is possible; a 2008-style crash is not the base case.
Will Las Vegas home prices crash like they did in 2008?
A 2008 repeat is unlikely because the crash mechanism is absent. In 2008, no-doc subprime loans, near-zero homeowner equity, a foreclosure cascade, and severe overbuilding combined to force a 60%-plus collapse. In 2026, lending is documented (median FICO near 740), equity is historically high, foreclosures are a small fraction of listings, and the valley is structurally under-supplied. Prices can move sideways or dip a few percent, but the forced-selling spiral is not loaded.
What is the current price-to-income ratio in Las Vegas?
Using the trailing-90-day median sold price of $440,678 against Clark County's $73,845 median household income (U.S. Census Bureau), the ratio is roughly 6.0x. Against the median list price of $470,801 it is about 6.4x. That is elevated versus the historical 3.5x–4x norm and above the ~5.5x 2006 peak on paper, though imported equity from out-of-state relocators softens the effective affordability picture.
Are Las Vegas cap rates still worth it for investors in 2026?
Cap rates have compressed to roughly 5%–6% gross and 3.5%–4% net after expenses — down from 7%–8% a decade ago. Deals still pencil, but only if you underwrite conservatively and demand positive cash flow at today's prices and ~6.5% financing. Higher-yield pockets exist in older North Las Vegas stock and select rent-premium communities, but appreciation-dependent deals carry real risk in a fully-valued market.
Is it better to rent or buy in Las Vegas right now?
It is close and depends on your time horizon. Renting a single-family home runs about $2,050 a month versus roughly $2,740 to own the median home (20% down at ~6.5%) — so renting is about $665 cheaper monthly before equity build and tax benefits. Under three to four years, renting often wins; past five to seven years, ownership's forced savings and Nevada's income-tax-free structure usually pull ahead.
How many months of housing supply does Las Vegas have?
About seven months of total for-sale supply — roughly 8,784 active Las Vegas listings against a trailing-90-day pace near 1,125 sales per month (GLVAR MLS). That is a balanced-to-buyer's-market level, up sharply from under two months in 2021, and it is ordinary listing inventory rather than the distressed foreclosure supply that defined 2008.
Which Las Vegas submarket has the most buyer leverage in 2026?
Boulder City and Henderson currently favor buyers most, with 78% and 60% of homes respectively selling below asking and longer marketing times. North Las Vegas is the tightest, with the fastest sales (21-day median) and the highest share selling above list, driven by affordability. Las Vegas proper sits in the middle at 59% below list — solid negotiating room across the valley.
Which Sources Inform This Las Vegas Bubble Analysis?
This analysis is grounded in live Las Vegas REALTORS (GLVAR) MLS data pulled via Repliers over the trailing 90 days (mid-April to mid-July 2026) — active inventory, sold prices, days on market, and above/below-list ratios for Las Vegas, Henderson, North Las Vegas, and Boulder City — combined with the authoritative public sources below. Figures are directional where a source lags; nothing here is fabricated.
- Las Vegas REALTORS (GLVAR) — monthly market statistics, inventory, and sales
- U.S. Census Bureau — Clark County QuickFacts — median income, population, home value, and rent
- Federal Housing Finance Agency (FHFA) House Price Index — Las Vegas metro appreciation
- Freddie Mac Primary Mortgage Market Survey — 30-year fixed mortgage rates
- U.S. Bureau of Labor Statistics — Nevada employment and payroll growth
- U.S. Bureau of Economic Analysis — Nevada economic output
- Consumer Financial Protection Bureau — ability-to-repay and lending standards
- U.S. Department of Housing and Urban Development — housing market and affordability data
- Clark County Assessor — property tax and assessment data
- Nevada Department of Taxation — property tax caps and structure
- Nevada Revised Statutes — Nevada real estate and disclosure law
This article is educational and not investment or financial advice. Chris Nevada is a licensed Nevada REALTOR (S.181401) with the Nevada Real Estate Group, brokered by LPT Realty. For a personalized analysis of your Las Vegas buying, selling, or investment situation, call (702) 637-1759.