

The most misread number in Las Vegas luxury real estate is printed on every listing sheet. A buyer sees "112 days on market" on a $4 million home in MacDonald Highlands and concludes the seller is desperate. A different buyer sees "9 days" on a $2.4 million home in Red Rock Country Club and assumes there is no room to negotiate. Both are reading a raw count as if it were a verdict, and both are usually wrong about what the count is telling them.
This guide is built on Las Vegas MLS data pulled through Repliers on September 19, 2026: every closing in Las Vegas, Henderson, North Las Vegas and Boulder City for the 12 months ending September 18, 2026 (land excluded), plus every active listing as of September 18, 2026. I have sorted it by price band, by community and by how long the home sat before it closed, so you can see what days on market actually predicts at the top of the market, and what it does not.
Days on market rises with price: the median closing took 29 days under $400,000 and 64 days above $5 million, and 36% of $5 million-plus listings had sat 90 days or longer. A long count at the top is normal, not distress. What it predicts is the discount: luxury homes sold after 180 days closed at 87.5% of original list, versus 97.8% inside two weeks. Read the count against the band, then negotiate from the ratio.
- Median days on market climbs from 29 under $400,000 to 64 above $5 million in Las Vegas closings.
- Luxury discounts grow with time: 97.8% of original list inside 14 days, 87.5% after 180 days.
- Months of supply ranges from 1.5 at The Summit Club to 16.0 at Ascaya, so DOM means different things.
- Red Rock Country Club closed 73 homes at a 38-day median; MacDonald Highlands took 70 days.
- Buyers should read cumulative DOM and price history together, then negotiate against the discount table.
What Does the Days-on-Market Number Actually Measure in the Las Vegas MLS?
Days on market is a listing-level counter, not a property-level one. When a Las Vegas REALTORS member enters a home into the MLS, the DOM field starts at zero on the list date and climbs each day the listing stays in an active or pending-with-contingencies status. When the listing is withdrawn, expired or cancelled, the clock stops. If the seller re-enters the home as a fresh listing after a gap, the listing-level DOM starts over at zero even though the home may have been shopped for months. That is the first thing luxury buyers miss: a "12 days" on the sheet in front of you may be the third listing of the same house since spring.
The second field, cumulative days on market, is designed to catch exactly that. It carries the total time the property has been listed across consecutive listings, and in most agent-facing MLS views it sits right beside the plain DOM. Consumer portals often display only one of the two, and the one they show is usually the shorter number. When I pull a listing for a client, the first thing I read is the gap between DOM and cumulative DOM, and the second is the price-change history, which lists every reduction with a date. A home showing 40 days of DOM, 210 days cumulative and three price cuts is telling a very different story from a home showing 40 days on its first and only listing.
Two more mechanics matter at the top of the market. A listing that goes pending and then falls out of escrow keeps accumulating time in most configurations, so a failed deal shows up as a longer count rather than a reset. And a home that was quietly marketed off-MLS before it went public carries none of that private exposure in either field, which is common above $5 million and means the count understates real market exposure in the other direction. Across the 9,600+ closings we've represented, the honest reading of any DOM figure has always required all four pieces: DOM, cumulative DOM, the price history and the listing history. The count alone tells you very little.
How Does Median Days on Market Change With Price in Las Vegas?
The single cleanest pattern in the data is that time to sell rises with price. In the 12 months ending September 18, 2026, the median home under $400,000 closed in 29 days and the median home between $400,000 and $600,000 closed in 28 days. From $600,000 to $900,000 the median stretched to 33 days, from $900,000 to $1.2 million to 34, and from $1.2 million to $3 million to 37. Above $3 million it jumped to 44 days, and above $5 million to 64. The mean tells the same story more dramatically, because the top band's long tail pulls it to 100 days.
| Sold price band | Closings | Median DOM | Mean DOM | Closed within 30 days | Took 90+ days | Sale to last list | Sale to original list |
|---|---|---|---|---|---|---|---|
| Under $400,000 | 9,920 | 29 | 49 | 51% | 17% | 99.2% | 97.2% |
| $400,000 to $600,000 | 11,197 | 28 | 45 | 52% | 15% | 99.5% | 98.0% |
| $600,000 to $900,000 | 3,943 | 33 | 52 | 47% | 18% | 98.5% | 96.9% |
| $900,000 to $1.2 million | 910 | 34 | 55 | 46% | 20% | 97.0% | 95.0% |
| $1.2 million to $2 million | 839 | 37 | 60 | 45% | 24% | 96.3% | 94.4% |
| $2 million to $3 million | 286 | 37 | 62 | 45% | 23% | 95.3% | 93.8% |
| $3 million to $5 million | 146 | 44 | 67 | 38% | 28% | 95.8% | 95.5% |
| $5 million and up | 97 | 64 | 100 | 29% | 38% | 93.9% | 91.9% |
Read the two right-hand columns together with the DOM columns. Under $600,000, more than half of homes closed within 30 days and sellers netted 97% to 98% of their original asking price. Above $5 million, only 29% closed within 30 days, 38% took 90 days or longer, and the median seller ended up at 91.9% of the original ask. The gap between the sale-to-last-list ratio (93.9%) and the sale-to-original-list ratio (91.9%) at the top is the price-reduction history made visible: the typical $5 million-plus seller cut before the buyer negotiated further.
For context on the broader market those bands sit inside: According to Las Vegas REALTORS' August 2026 report, the median existing single-family home in Southern Nevada sold for $475,000 in August 2026, down 1.0% from a year earlier and below the $490,000 record set in May and June, while single-family listings without offers rose 5.3% to about 7,590. Nationally the picture is faster. According to the National Association of REALTORS, properties typically remained on the market for 31 days in August 2026 and unsold inventory equated to 4.9 months of supply. Las Vegas luxury is slower than both benchmarks, and it is supposed to be.
How Long Have Today's Luxury Listings Been Sitting?
The closed data tells you how long sales took. The active data tells you what is sitting right now, and the two do not describe the same population: the homes that eventually sell are, by definition, the ones that were priced closely enough to find a buyer. As of September 18, 2026, there were 133 active listings asking $5 million or more in the Las Vegas metro, with a median asking price of $7,500,000 and a median 40 days on market. Of those 133, 36% had been listed 90 days or longer and 17% had been listed 180 days or longer. Between $3 million and $5 million, 188 listings were active at a $3,850,000 median ask, with 30% at 90-plus days and 14% at 180-plus.
| Asking band | Active listings | Median DOM | Listed 90+ days | Listed 180+ days | Median asking price | Months of supply (computed) |
|---|---|---|---|---|---|---|
| Under $400,000 | 4,326 | 25 | 18% | 6% | $309,900 | 5.2 |
| $400,000 to $600,000 | 4,341 | 22 | 15% | 3% | $485,000 | 4.7 |
| $600,000 to $900,000 | 2,014 | 27 | 16% | 3% | $699,900 | 6.1 |
| $900,000 to $1.2 million | 538 | 31 | 22% | 5% | $1,011,292 | 7.1 |
| $1.2 million to $2 million | 593 | 31 | 21% | 7% | $1,490,000 | 8.5 |
| $2 million to $3 million | 271 | 33 | 27% | 9% | $2,499,000 | 11.4 |
| $3 million to $5 million | 188 | 30 | 30% | 14% | $3,850,000 | 15.5 |
| $5 million and up | 133 | 40 | 36% | 17% | $7,500,000 | 16.5 |
The months-of-supply column is the one to stare at. I computed it by dividing each band's active count by its average monthly closings over the prior 12 months, so it is a derived figure rather than a published statistic, but the shape is unmistakable. Under $600,000 the metro carries about five months of supply, which is close to the national 4.9 months the National Association of REALTORS reported for August 2026. From $2 million to $3 million it is 11.4 months. Above $3 million it is more than 15 months, and above $5 million it is 16.5 months: 133 homes for sale against 97 that closed in a full year. A market with 16 months of supply does not produce 30-day sales as a rule. It produces them as exceptions, for the handful of homes that are priced at or under what the last comparable actually closed for.
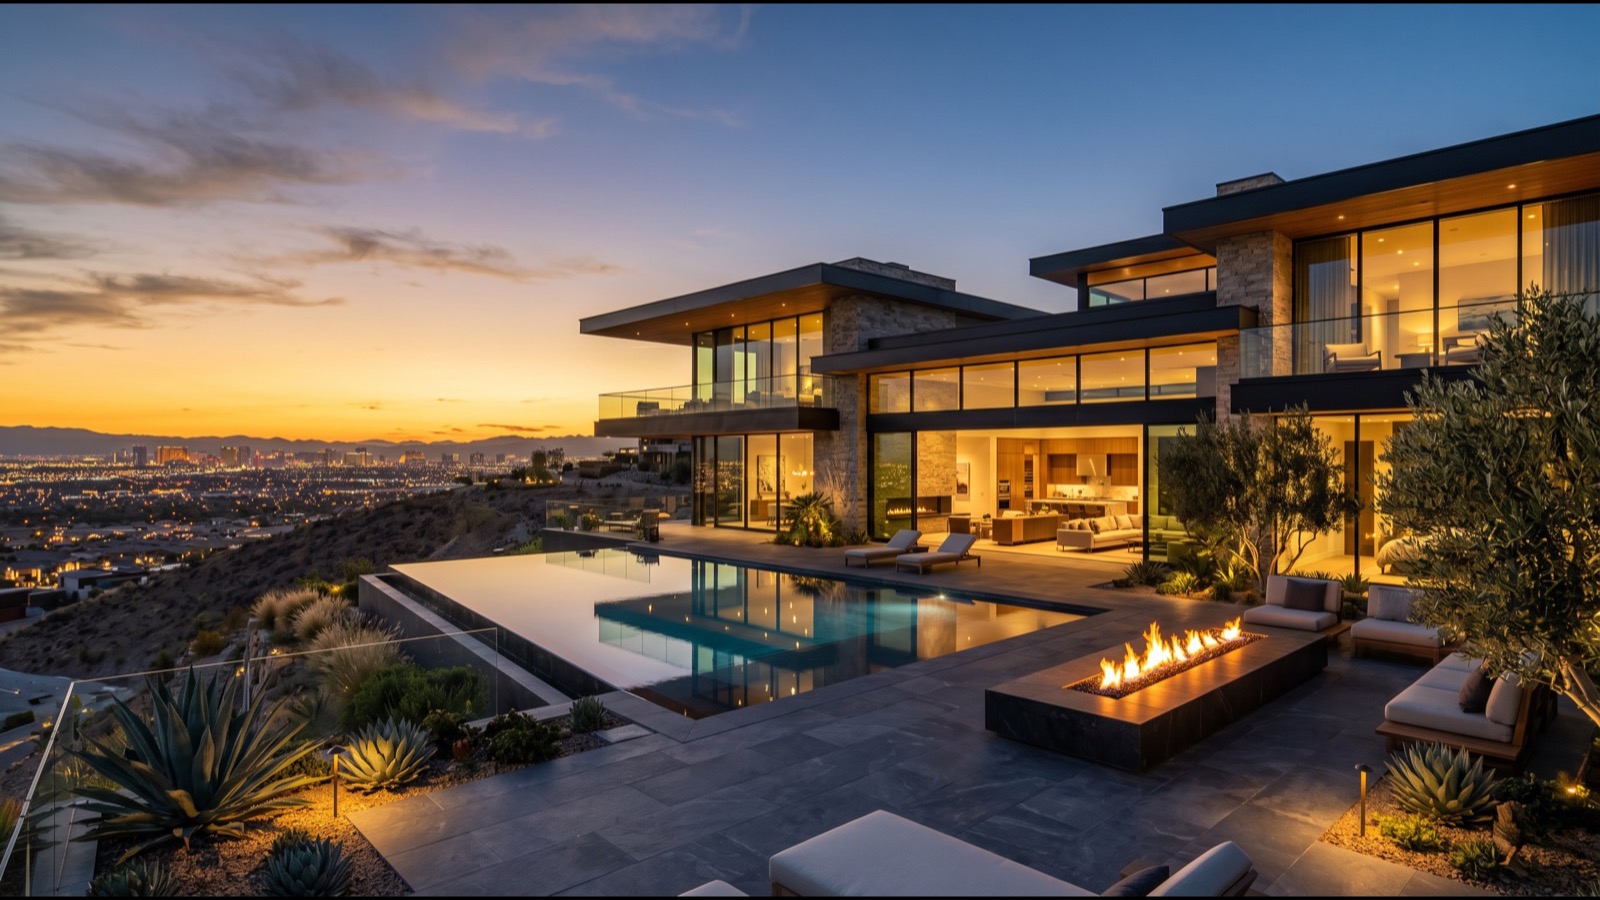
Why Does a High DOM Mean Something Different at $2 Million and Up?
The reason is arithmetic before it is psychology. Under $600,000, roughly 21,000 homes closed in the 12 months ending September 18, 2026, which means a correctly priced listing meets qualified buyers every week. Above $5 million, 97 homes closed in the same year across the entire metro, about eight a month, spread across Summerlin, Henderson, the west side and a few historic enclaves. A given $7 million listing might have three or four plausible buyers in the country at any moment, and none of them is obligated to be in Las Vegas the week the home hits the market. Time on market at that level measures how long it takes for the right buyer to exist, not how badly the seller wants out.
That is why the 90-plus-day share climbs the way it does: 17% under $400,000, 24% from $1.2 million to $2 million, 28% from $3 million to $5 million and 38% above $5 million. Even the sellers who eventually closed at a healthy ratio waited. A $5 million-plus home that has been listed 75 days is at its band's median, not past it, and treating it as distressed will get your offer ignored. Conversely, a $450,000 home at 75 days is at roughly two and a half times its band's median, and the price history almost always explains why.
There is a second layer at the top: the buyer pool is not just small, it is uneven in what it values. A modern hillside estate in Ascaya with a $17.25 million top sale in the past year is competing for a different buyer than a golf-course home in Anthem Country Club that closed at a $1,625,000 median. Two homes with the same DOM in those two communities have nothing in common except the number. That is the core misreading: buyers apply the intuition they built shopping at $500,000, where DOM tracks price accuracy tightly, to a market where DOM mostly tracks buyer scarcity. The number is still useful at the top. It just has to be read against the band and the community, and it has to be paired with the discount table below.
How Much Does Time on Market Cost a Luxury Seller?
This is the part of the data that turns a vague feeling into a negotiating position. I took every closing at $1.2 million and above in the 12 months ending September 18, 2026, 1,368 sales in all, and grouped them by how many days they had been on market when they went under contract. Then I looked at what each group closed for as a share of its original asking price. The relationship is monotonic and steep.
| Sold after | Closings | Share of luxury closings | Median sale to original list | Median discount from original ask |
|---|---|---|---|---|
| 0 to 14 days | 357 | 26% | 97.8% | $44,990 |
| 15 to 30 days | 230 | 17% | 96.0% | $75,000 |
| 31 to 60 days | 274 | 20% | 93.4% | $134,900 |
| 61 to 90 days | 165 | 12% | 91.7% | $185,000 |
| 91 to 180 days | 251 | 18% | 89.7% | $210,000 |
| 181 days and up | 91 | 7% | 87.5% | $299,000 |
A luxury home that sold in its first two weeks gave up a median $44,990 from its original ask, about 2.2%. A home that sold between 31 and 60 days gave up $134,900. Past 90 days the median concession was $210,000, and past 180 days it was $299,000, or 12.5% off the original price. Note that the discount is measured against the original list, so it includes every reduction the seller made along the way plus whatever the buyer negotiated at the end. That is the right way to measure it, because the buyer who shows up on day 150 is negotiating against a price that has already been cut, and the total distance from the first number is what the seller actually lost.
The distribution matters as much as the ratios. Twenty-six percent of luxury closings happened inside 14 days and 43% inside 30, which means the fast, near-ask sale is common enough that sellers can reasonably aim for it. But 25% of luxury closings happened after 90 days, and those sellers gave up four to five times as much money as the fast group. The clock is expensive, and it is expensive in a predictable way. When a buyer asks me what a stale listing is "really worth," this table is where I start: not at some arbitrary lowball, but at the ratio the market has actually been paying for homes with that much time on them.
Which Las Vegas Luxury Communities Sell Fast and Which Sit?
Metro-wide bands hide enormous variation between communities, and community is where a luxury buyer actually shops. I pulled the 12-month closings for every guard-gated or estate community with at least five closings averaging $1.2 million or more, then matched each against its active inventory on September 18, 2026. The table shows the eight communities buyers ask about most; the sections that follow read the rest.
| Community | Closings | Median DOM (closed) | Median sold price | Sold $/sq ft | Active listings | Median asking price | Median DOM (active) | Months of supply |
|---|---|---|---|---|---|---|---|---|
| The Summit Club | 8 | 83 | $21,000,000 | $3,078 | 1 | $13,500,000 | 161 | 1.5 |
| Ascaya | 12 | 59 | $8,500,000 | $1,206 | 16 | $9,995,000 | 103 | 16.0 |
| MacDonald Highlands | 64 | 70 | $4,300,000 | $835 | 68 | $5,499,000 | 73 | 12.8 |
| The Ridges | 55 | 43 | $2,799,000 | $650 | 42 | $3,999,000 | 42 | 9.2 |
| Southern Highlands Estates | 28 | 62 | $2,950,000 | $619 | 19 | $6,350,000 | 28 | 8.1 |
| Red Rock Country Club | 73 | 38 | $2,050,000 | $553 | 30 | $2,399,000 | 26 | 4.9 |
| The Peaks and Ascension | 41 | 35 | $2,351,052 | $581 | 21 | $2,599,000 | 53 | 6.1 |
| Anthem Country Club | 98 | 33 | $1,625,000 | $444 | 29 | $2,850,000 | 21 | 3.6 |
The spread is the lesson. Anthem Country Club, the busiest luxury community in the metro with 98 closings, turns its inventory in about 3.6 months at a 33-day median. Ascaya, with a $8,500,000 median sale and a $1,206-per-square-foot price, carries 16 months of supply, and its active listings had a 103-day median on September 18, 2026. A 100-day listing in Anthem is an anomaly that demands an explanation. A 100-day listing in Ascaya is Tuesday.
Two smaller communities deserve a mention because they show the extremes. Country Club Hills in Summerlin closed 16 homes at an 11-day median and a $2,150,000 median price, with just two active listings and 1.5 months of supply; there is simply no stale inventory to negotiate against. Lake Las Vegas SouthShore, by contrast, closed 29 homes at a 91-day median with 39 active listings and 16.1 months of supply, and Canyon Fairways in Summerlin had 11 actives against six closings, 22 months of supply. Buyers who want a deal on time should be looking where the supply is; buyers who want a specific street should expect to pay close to ask when the supply is not there. The full list of neighborhoods lives on our luxury communities and guard-gated communities pages.
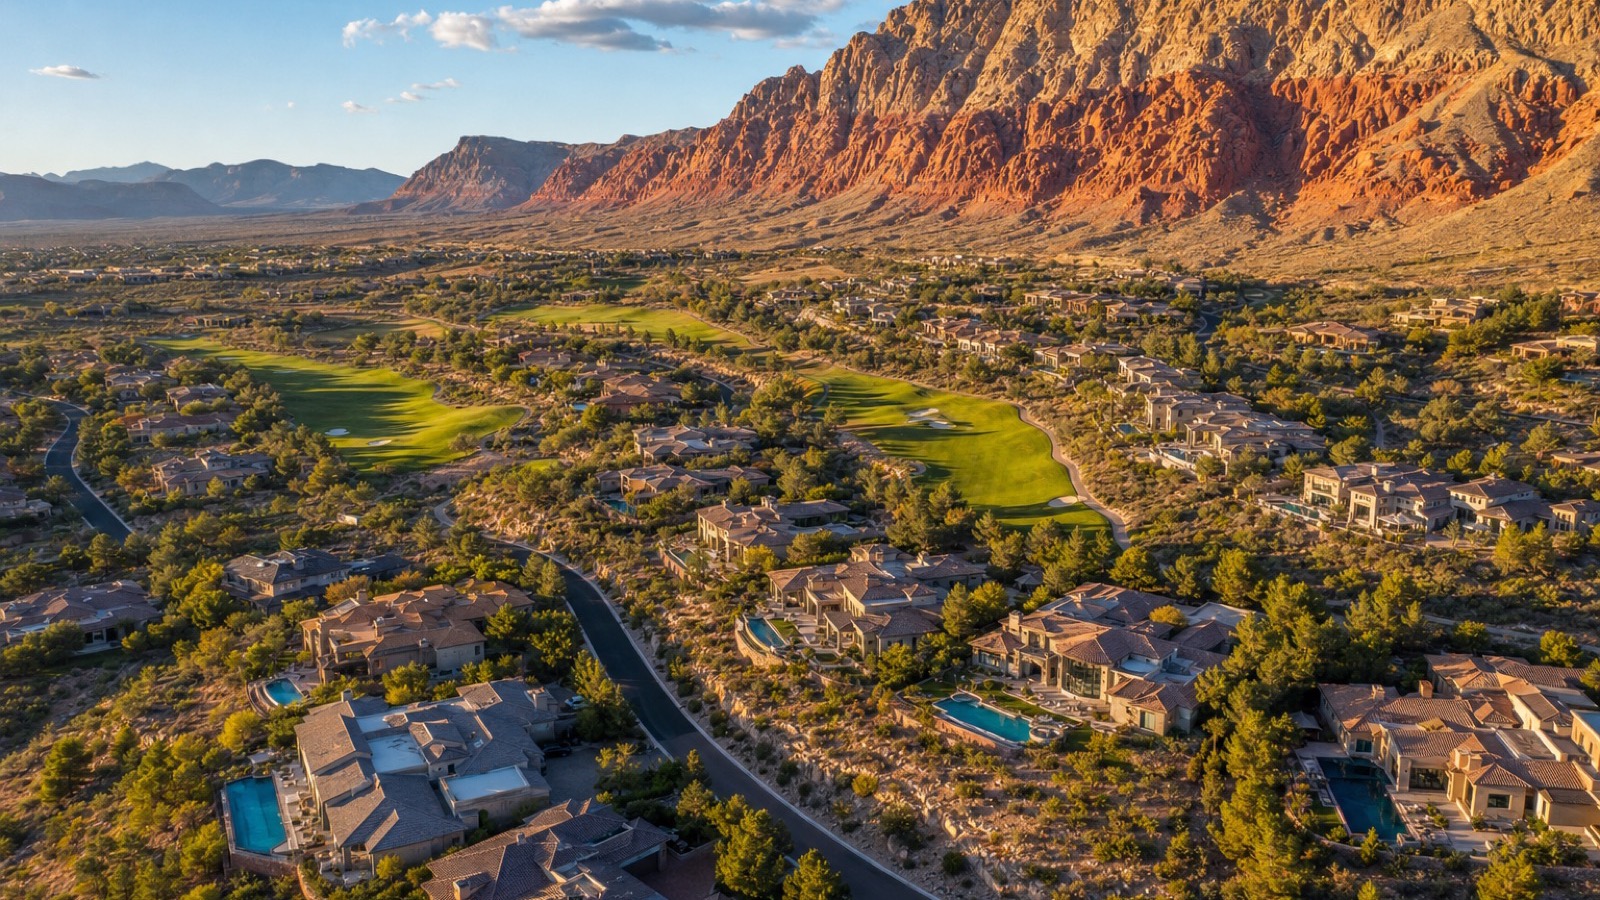
How Should You Read DOM at The Summit Club, The Ridges, MacDonald Highlands and Red Rock Country Club?
These four are the communities where the misreading is most expensive, so they deserve individual treatment.
The Summit Club closed eight homes in the 12 months ending September 18, 2026 at a $21,000,000 median, a $16,358,750 average and a $25,000,000 top sale, at $3,078 per square foot. The median closed DOM was 83 days, and the single active listing on September 18 was asking $13,500,000 after 161 days. If you read only the DOM you would call this a slow market. It is the opposite: eight closings against one listing is 1.5 months of supply, the tightest of any luxury community in the metro. Time on market at the Summit reflects a buyer pool that has to clear club membership and a price point with perhaps a few dozen qualified buyers nationally, not weakness. The 555-acre community, developed by Discovery Land Company with Howard Hughes inside Summerlin, sells on scarcity, and the 83-day median is the cost of scarcity, not a discount signal.
The Ridges is the most liquid of the ultra-luxury enclaves: 55 closings at a $2,799,000 median, a $3,354,769 average and a $16,000,000 top sale, with a 43-day closed median. The revealing number is the gap between what sold and what is asking. The 42 active listings on September 18, 2026 carried a $3,999,000 median ask, 43% above the median closing, and a 42-day median DOM. Some of that gap is mix, since the biggest custom estates tend to be the ones listed, but some of it is aspiration. In The Ridges, a listing past 90 days with a price above the recent closings on its street is a listing whose seller has not yet accepted the closings; the 9.2 months of supply says buyers have alternatives.
MacDonald Highlands is where DOM is most structurally long. Sixty-four closings at a $4,300,000 median and an $835-per-square-foot price took a 70-day median, and on September 18, 2026 there were 68 active listings, more than closed in a full year, asking a $5,499,000 median after a 73-day median wait: 12.8 months of supply. According to MacDonald Highlands, the community spans 1,320 acres behind two 24-hour guard-gated entries around DragonRidge Country Club, and the hillside custom product there is large, varied and slow to match to a buyer. A 100-day listing in MacDonald Highlands is not automatically a bargain; it is at the community's normal pace. A 200-day listing with two reductions is a different matter.
Red Rock Country Club is the fastest of the four and the easiest to misread in the other direction. Seventy-three closings at a $2,050,000 median took a 38-day median, and its 30 active listings on September 18, 2026 had a 26-day median DOM at a $2,399,000 median ask: 4.9 months of supply. Here the DOM signal works almost the way it does at $500,000. A Red Rock Country Club home at 90 days is roughly two and a half times the community median, and in the 12-month data that kind of outlier almost always carried a price history. This is the one community of the four where a long count is a genuine invitation to negotiate hard.
What Do Months of Supply Reveal That DOM Hides?
Days on market is a backward-looking measure of one listing. Months of supply is a forward-looking measure of the whole community, and it answers the question a buyer actually cares about: if I walk away from this house, how many others like it will there be? In the 12 months ending September 18, 2026 the luxury communities ranged from 1.5 months (The Summit Club, Country Club Hills) to 22.0 months (Canyon Fairways), and that range is where negotiating leverage really lives.
Consider three communities with similar median prices. Mesa Ridge in Summerlin closed 21 homes at a $2,600,000 median and a 53-day median DOM, with 12 actives and 6.9 months of supply. The Palisades in Summerlin closed seven at a $2,735,000 median and a 38-day DOM, with five actives and 8.6 months. Seven Hills estate parcels closed 14 at a $2,975,000 median and a 36-day DOM, with 16 actives and 13.7 months. A buyer who only compares DOM would rank Seven Hills as the tightest and Mesa Ridge as the loosest. Supply says the reverse: Seven Hills has nearly twice the standing inventory relative to its sales pace, which is where a patient buyer should expect the most room.
Supply also explains the Henderson-versus-Summerlin difference that buyers feel but rarely quantify. The Foothills at MacDonald Ranch closed 14 homes at a $2,840,000 median in 26 days with four actives, 3.4 months of supply, while MacDonald Highlands next door sits at 12.8 months. The Cliffs in Summerlin closed 53 homes at a $1,240,000 median in 28 days with 12 actives, 2.7 months of supply, while Redpoint and Kestrel, the newer Summerlin villages, closed 69 at a $1,199,000 median in 55 days with 44 actives, 7.7 months. New-construction villages run longer because builder inventory and resale compete on the same streets. If you are shopping Summerlin's newest neighborhoods, the Summerlin hub and the best luxury guard-gated communities ranking show where the supply sits.
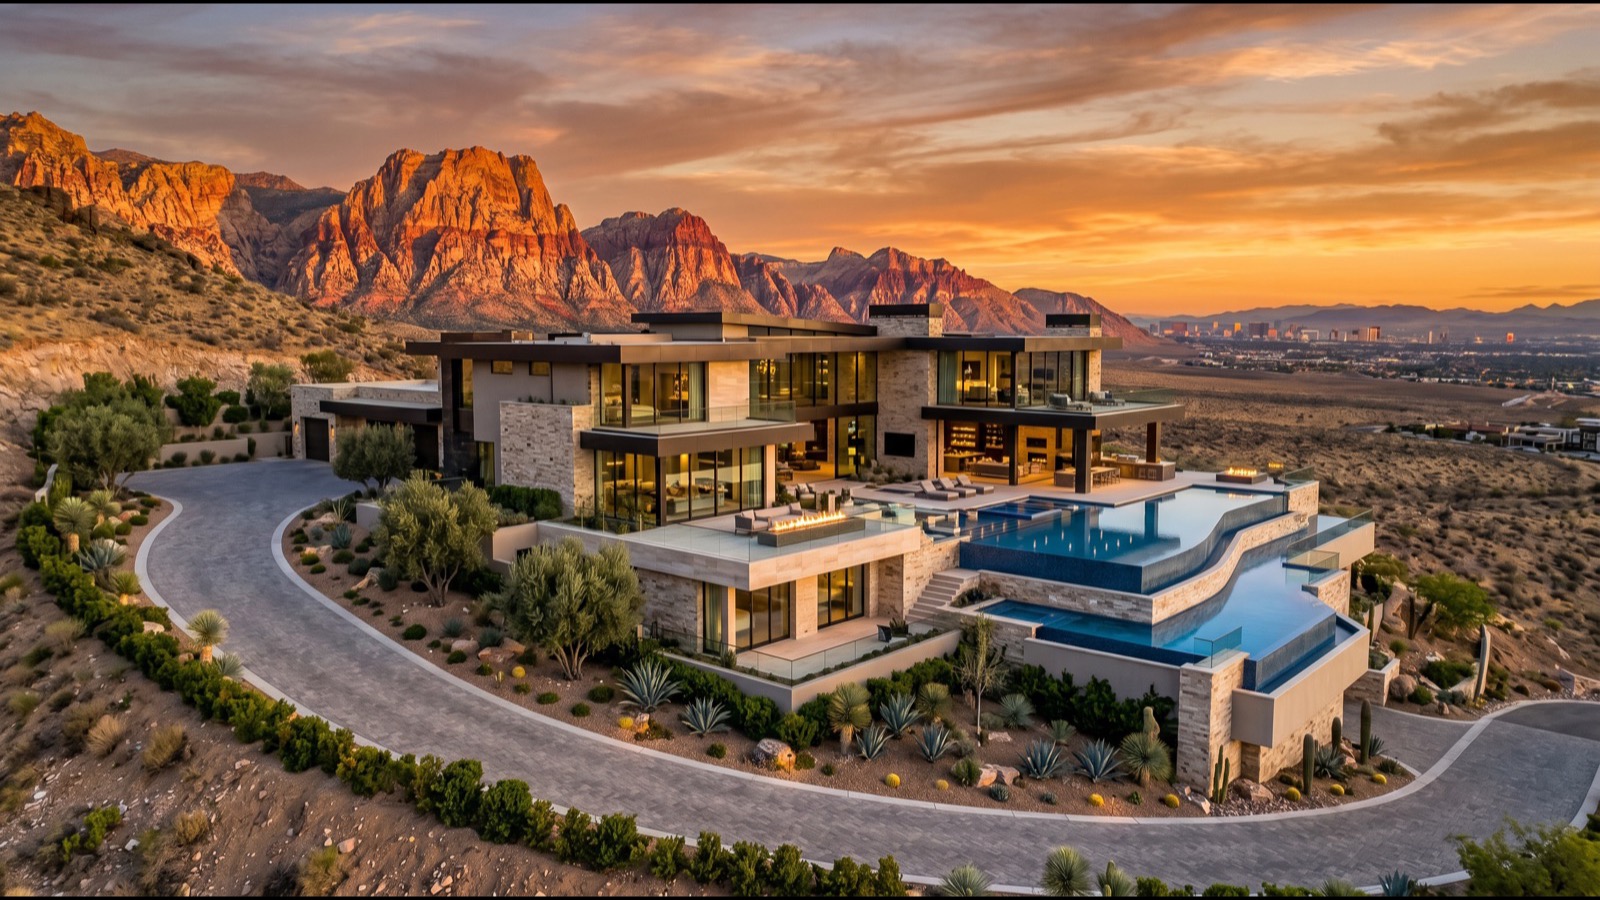
When Do $1.2 Million-Plus Homes Actually Close in Las Vegas?
Luxury has a calendar, and it shapes both DOM and leverage. I grouped every $1.2 million-plus closing in the 12 months ending September 18, 2026 by the month it closed. The months on either end are partial, since the window opens September 19, 2025 and September 2026 closings were still posting to the MLS when I pulled the data, so read those two rows as fragments rather than trends.
| Month closed | Closings $1.2M+ | Median DOM | Median sold price |
|---|---|---|---|
| September 2025 (from the 19th) | 42 | 43 | $1,526,500 |
| October 2025 | 100 | 42 | $1,650,000 |
| November 2025 | 89 | 41 | $1,715,000 |
| December 2025 | 112 | 40 | $1,800,000 |
| January 2026 | 213 | 53 | $1,725,000 |
| February 2026 | 142 | 35 | $1,810,000 |
| March 2026 | 133 | 34 | $1,760,000 |
| April 2026 | 133 | 35 | $1,800,000 |
| May 2026 | 139 | 37 | $1,600,000 |
| June 2026 | 108 | 33 | $1,780,000 |
| July 2026 | 95 | 38 | $1,850,000 |
| August 2026 | 62 | 42 | $1,785,000 |
| September 2026 (through the 18th) | 4 | 77 | $1,530,000 |
Two patterns stand out. First, the busiest closing month was January 2026 at 213 luxury closings, and it was also the slowest by DOM at a 53-day median. Those are homes that went under contract in the late fall and closed after the holidays, and the long count says that a good share of them were listings that had sat through October and November before finding their buyer. Second, the spring closings from February through June were the fastest of the year, with medians of 33 to 37 days, and the medians were consistently $1,760,000 to $1,810,000, apart from May's $1,600,000. The summer tapered: 95 closings in July, 62 in August, with DOM drifting back up to 42.
For a buyer, the implication is that the leverage window opens in late summer and fall. Listings that came on in the spring rush and did not sell are, by September, sitting at 90 to 150 days, exactly the buckets where the discount table shows $185,000 to $210,000 median concessions. For a seller, the implication is the mirror image: the spring window rewards accurate pricing with a 34-day sale near ask, and missing that window means competing in the fall against your own aging listing. The full-market monthly figures, including the non-luxury bands, are in our Las Vegas real estate market report for September 2026 and the live market report page.
How Should Luxury Buyers Negotiate Using Days on Market?
Start by rebuilding the number. Before you decide what a listing is worth, pull the cumulative DOM, the full price-change history and every prior listing of the same address in the past 24 months. A home showing 35 days on its current listing that was withdrawn in April after 120 days and two reductions is, for negotiating purposes, a 155-day listing with a seller who has already conceded twice. Your agent can pull this from the MLS in minutes; the portals will not show it to you.
Then place the listing in its band and its community. A $2.5 million home at 60 days is at 1.6 times its band's 37-day median, but if it is in MacDonald Highlands it is under the community's 70-day median, and if it is in Red Rock Country Club it is well past the 38-day median. The first case calls for an offer near the recent closings on its street; the second calls for an offer built from the discount table. In the 12 months ending September 18, 2026, $1.2 million-plus homes that had sat 61 to 90 days closed at a median 91.7% of original list. An offer at 90% of original ask on a 75-day Red Rock Country Club listing is not an insult; it is the market's own number, and presenting it that way, with the data attached, is far more persuasive than an unexplained lowball.
Use supply to decide how hard to push. In a 3.6-month community like Anthem Country Club or a 2.7-month village like The Cliffs, a rejected offer costs you the house, because the next buyer is close behind. In a 12.8-month community like MacDonald Highlands or a 16-month community like Ascaya, a rejected offer costs you very little, because you can come back in three weeks and the listing will almost certainly still be there, possibly with another reduction. Across the 9,600+ closings we've represented, the buyers who got the best luxury prices were the ones who matched their aggressiveness to the supply, not the ones who were aggressive everywhere.
Finally, respect what DOM does not tell you. It does not tell you the seller's carrying cost, their reason for selling, whether the home was shopped privately first, or whether there is a backup offer. Those are questions for your agent to ask the listing agent directly, and the answers routinely change the negotiation more than any number on the sheet. According to Freddie Mac, the 30-year fixed averaged 6.95% for the week of September 17, 2026, and a seller who bought at a 3% rate and is carrying a large jumbo loan has a very different urgency from one who owns free and clear. DOM measures the listing. The negotiation is with the person.

What Should Luxury Sellers Learn From the DOM Data?
Sellers misread the number too, usually by assuming that the top of the market has no clock. It does, and the discount table prices it. A $3 million listing that sells in its first two weeks gives up a median 2.2% from its original ask, roughly $66,000 at that price. The same listing at 91 to 180 days gives up a median 10.3%, about $309,000. The difference is not the buyer's negotiating skill; it is the seller's original price. Homes that sold fast were priced against the closings, and homes that sat were priced against hope, and the market corrected the second group by about $250,000 on a $3 million home.
The practical rule is that your first 30 days are worth more than every subsequent month combined. In the 12 months ending September 18, 2026, 43% of luxury closings went under contract within 30 days, and those sellers netted 96% to 98% of original ask. If you are not under contract by day 45 in a community with a sub-40-day median like Red Rock Country Club, Anthem Country Club, The Peaks or Reverence, the market has already told you the price is wrong, and the longer you wait to adjust, the further into the 89.7% and 87.5% buckets you fall. In a structurally slow community like MacDonald Highlands or Ascaya, give it 90 days before concluding anything, but watch the showing count, not the calendar.
Sellers should also manage the counter itself. If you withdraw and relist, the plain DOM resets but the cumulative DOM does not, and every serious buyer's agent will see both. The relist strategy is not deceptive if it accompanies a real change, such as a meaningful reduction, a completed renovation or a new season, but a relist at the same price with new photographs fools nobody and signals that the seller is managing optics rather than price. The better move is a single decisive reduction to the level the closings support, which in the data produces a sale, rather than three small reductions that each land just above the market and produce another 30 days. Our sellers page walks through how we price against closings rather than asks.
What Mistakes Do Buyers Make When a Luxury Listing Looks Stale?
The first mistake is anchoring to the count instead of the cause. A 150-day listing might be overpriced, but it might also be a highly specific home, such as a 12,000-square-foot contemporary with a car gallery, that is waiting for one of the few buyers who wants exactly that. In the second case the seller is not going to accept 85% of ask because the count is high, and buyers who insist on the count-based discount lose the house to the eventual right buyer who pays near ask. Ask your agent to characterize the home's buyer pool before you decide how the DOM should be read.
The second mistake is ignoring the price history in the other direction. A home that has already been reduced from $4,500,000 to $3,750,000 over 120 days is, in the data, behaving like a home whose seller has done the buyer's negotiating for them. The 91-to-180-day bucket's 89.7% median sale-to-original ratio already includes those reductions, which means a further 10% off the current $3,750,000 price would put the deal well below where the market has actually been clearing. Buyers who demand the full DOM discount on top of the reductions already taken tend to end up in a stalemate with a seller who has, correctly, concluded that the buyer is not reading the sheet.
The third mistake is skipping the disclosures because the listing feels like a bargain. Every Las Vegas luxury home inside a homeowners association comes with a resale package, and According to Nevada Revised Statutes 116.4109, the seller must furnish the buyer with the declaration, bylaws and rules, a statement of monthly assessments and unpaid obligations, the current budget and reserve summary, any pending legal actions, all transfer fees, and proof of insurance, and the buyer may cancel until midnight of the fifth calendar day after receiving it. A stale listing in a community with a pending assessment or litigation may be stale for a reason that no DOM figure captures, and the five-day window is the buyer's protection. Read it.
The fourth mistake is misjudging carrying cost. According to the Clark County Assessor, Nevada's abatement caps annual property tax increases at 3% on an owner's primary residence and 8% on other property, which keeps taxes predictable but means a new buyer resets to the current assessed value. Add the HOA, the club dues where they apply and the insurance, and the monthly cost of holding out for one more reduction can exceed the reduction. Buyers should model the full carry before deciding to wait out a listing.
How Do Financing and Carrying Costs Change the DOM Math Above $1 Million?
Financing is the hidden variable in luxury DOM, because it shapes both who can buy and how fast they can close. According to the Federal Housing Finance Agency, the 2026 baseline conforming loan limit for a one-unit property is $832,750, so nearly every purchase in the bands discussed here is a jumbo loan or cash. Jumbo underwriting is slower and more document-heavy than conforming, and appraisal is a real risk on a unique custom home with few comparables. That is one reason luxury listings carry more contract fall-throughs, and a fall-through shows up in the data as more DOM.
Cash changes the calculus in both directions. A cash buyer can close in two weeks, which is worth real money to a seller who has been carrying a $30,000-a-month jumbo payment for five months, and a well-documented cash offer at 92% of ask on a 100-day listing is often accepted where a financed offer at 95% is not. But cash buyers also tend to overestimate their leverage in low-supply communities, where a financed buyer at ask will still win. The right read is to price the certainty you are offering against the community's supply: certainty is worth a lot in a 12-month market and very little in a two-month market.
Carrying cost also explains why some sellers hold. A seller who owns free and clear in a 16-month community can wait for the one buyer who values the home at ask, and the DOM will reflect that patience rather than any pressure. A seller with a large mortgage at today's 6.95% rate, or an estate that needs to settle, cannot. Neither fact appears in the MLS, and both matter more than the count. The luxury communities page and our agents' community-level notes capture what we know about the ownership profile of each enclave, which is often the missing piece.
One more factor on the horizon for Henderson buyers: According to the Four Seasons Private Residences Las Vegas sales site, the 171-residence branded project inside MacDonald Highlands is now marketing from $5 million on a 12-acre enclave with more than 90,000 square feet of amenities, and when it delivers it will add a block of $5 million-plus inventory to a community that already carries 12.8 months of supply. Buyers in that band should factor the coming supply into how long they are willing to let a current listing sit; our Four Seasons Henderson guide has the project detail.
Frequently Asked Questions
What is a normal number of days on market for a luxury home in Las Vegas?
It depends on the band. In the 12 months ending September 18, 2026, the median closing took 37 days between $1.2 million and $3 million, 44 days between $3 million and $5 million, and 64 days above $5 million, based on Las Vegas MLS data pulled through Repliers on September 19, 2026. Community matters as much as price: Red Rock Country Club closed at a 38-day median, The Ridges at 43, MacDonald Highlands at 70 and The Summit Club at 83. A listing at its band's or community's median is not stale; a listing at two to three times the median usually carries a price history that explains it.
Does a high DOM mean the seller will take a low offer?
Not by itself. Above $5 million, 38% of homes that eventually closed took 90 days or longer, so a long count is common and does not indicate distress. What DOM does predict is the ratio: $1.2 million-plus homes that sold after 91 to 180 days closed at a median 89.7% of original list, and after 180 days at 87.5%. Those ratios include reductions the seller already made, so an offer should be built from the current price and the reductions taken, not by stacking a full DOM discount on top of cuts that have already happened. Supply decides how hard to push.
What is the difference between DOM and cumulative DOM?
DOM counts days on the current listing and resets to zero when a home is withdrawn and relisted. Cumulative DOM carries the total across consecutive listings of the same property, so it survives a relist. Consumer portals often display only the shorter figure. Your agent can pull both from the MLS along with the price-change history and prior listings, and reading all of them together is the only reliable way to know how long a luxury home has really been exposed to the market. A 12-day DOM with a 200-day cumulative count is a very different negotiation.
Which Las Vegas luxury communities sell fastest?
Among communities with five or more closings averaging $1.2 million or more in the 12 months ending September 18, 2026, Country Club Hills closed at an 11-day median, Mountain Trails at 18, The Foothills at MacDonald Ranch and Willow Creek at 26, The Cliffs at 28, Anthem Country Club at 33 and The Peaks and Ascension at 35. The slowest were Tournament Hills at 118 days, Lake Las Vegas SouthShore at 91, The Summit Club at 83, Rancho Bel Air at 73 and MacDonald Highlands at 70. Speed tracks supply: the fastest communities carried 1.5 to 6 months of inventory.
How much do luxury sellers lose by waiting?
Measured against the original asking price, $1.2 million-plus sellers who went under contract within 14 days gave up a median $44,990 (97.8% of ask) in the 12 months ending September 18, 2026. Sellers who took 31 to 60 days gave up $134,900, 61 to 90 days $185,000, 91 to 180 days $210,000 and more than 180 days $299,000, or 12.5% of the original price. The first 30 days produce 43% of all luxury closings and the best ratios, which is why pricing to the closings on day one, rather than testing the market, is the single most valuable decision a luxury seller makes.
Is the Las Vegas luxury market a buyer's market in September 2026?
By supply, yes, and increasingly so as you move up. Computed from actives on September 18, 2026 against the prior 12 months' closings, the metro carried about 8.5 months of supply from $1.2 million to $2 million, 11.4 months from $2 million to $3 million, 15.5 months from $3 million to $5 million and 16.5 months above $5 million, versus roughly five months under $600,000. Individual communities range from 1.5 months at The Summit Club to 22 months at Canyon Fairways, so the answer is community-specific, and the negotiating leverage follows the supply rather than the headline.
When is the best time to buy a luxury home in Las Vegas?
The data favors late summer and fall for leverage. Luxury closings peaked at 213 in January 2026 with the year's longest 53-day median DOM, then ran fastest from February through June at 33-to-37-day medians. By August 2026 closings had fallen to 62 with DOM back at 42, and the listings that missed the spring window were sitting at 90 to 150 days, the buckets where median concessions were $185,000 to $210,000. Sellers see the reverse: the spring window rewards accurate pricing with a near-ask sale in about five weeks.
Should You Work With Nevada Real Estate Group on Your Luxury Purchase?
Reading days on market correctly is a small part of what separates a good luxury purchase from an expensive one, but it is the part most buyers get wrong first, and it colors every decision after it. Our team pulls the full listing history, the cumulative count, the price changes and the community supply on every home a client considers, and we build the offer from the ratios the market has actually paid rather than from a feeling about the number on the sheet. Across the 9,600+ closings we've represented and the $4.85 billion-plus in volume behind them, that discipline is the difference between the buyer who pays 97% of ask in a 16-month community and the buyer who pays 90%.
Nevada Real Estate Group is the number one real estate team in Nevada, brokered by LPT Realty, with 150+ licensed agents, 9,061+ verified five-star reviews and 16+ years in this market. In 2025 alone the team closed 789 homes and $440 million-plus in volume, a meaningful share of it in the guard-gated and estate communities covered here. We know which MacDonald Highlands streets carry the long counts, which Ridges listings are priced to the closings and which are priced to hope, and which Red Rock Country Club sellers are already past the point where the data says they will move.
If you are shopping above $1.2 million anywhere in Summerlin, Henderson or the west side, start with our luxury communities page, then call (702) 637-1759 or visit us at 8945 W Russell Rd, Suite 170, Las Vegas, NV 89148. Tell us the community and the listing, and we will send you the real history behind the number before you write an offer. If you are selling, ask for our pricing analysis against the closings, not the asks; it is the same table you have just read, applied to your street.
Which Sources Inform This Luxury Days-on-Market Guide?
- Las Vegas MLS data pulled through Repliers on September 19, 2026: closings for the 12 months ending September 18, 2026 and actives as of September 18, 2026, Las Vegas, Henderson, North Las Vegas and Boulder City, homes only. These are our own tabulations, not official Las Vegas REALTORS statistics.
- Las Vegas REALTORS August 2026 report, as covered by VEGAS INC: $475,000 single-family median, $490,000 record, 7,590 single-family listings without offers.
- National Association of REALTORS, Existing-Home Sales: August 2026 median days on market and months of supply.
- Freddie Mac Primary Mortgage Market Survey: 30-year fixed rate for the week of September 17, 2026.
- Federal Housing Finance Agency, 2026 conforming loan limit values: $832,750 baseline one-unit limit.
- Nevada Revised Statutes Chapter 116: NRS 116.4109 resale package contents and the five-day cancellation right.
- Clark County Assessor: 3% and 8% annual property tax abatement caps.
- MacDonald Highlands: 1,320 acres, two 24-hour guard-gated entries, DragonRidge Country Club.
- Summerlin by Howard Hughes: community amenities, more than 300 parks and 200 miles of trails.
- Four Seasons Private Residences Las Vegas: 171 residences from $5 million inside MacDonald Highlands.
- Fannie Mae Selling Guide B4-2.1-03: project eligibility rules that shape jumbo and condo underwriting.
- Nevada Real Estate Group luxury communities and guard-gated communities: community profiles referenced throughout.