
The most useful number in the Sparks market right now is not the median price. It is the share of sellers who have already come down off theirs.
We pulled every active residential listing in Sparks from the Northern Nevada MLS in August 2026 — 512 homes, every one carrying its original list price — and compared what each is asking today against what it asked on day one. Nearly half have cut. That single fact should change how anyone approaches an offer here, and it is the opposite of the market most buyers still think they are competing in.
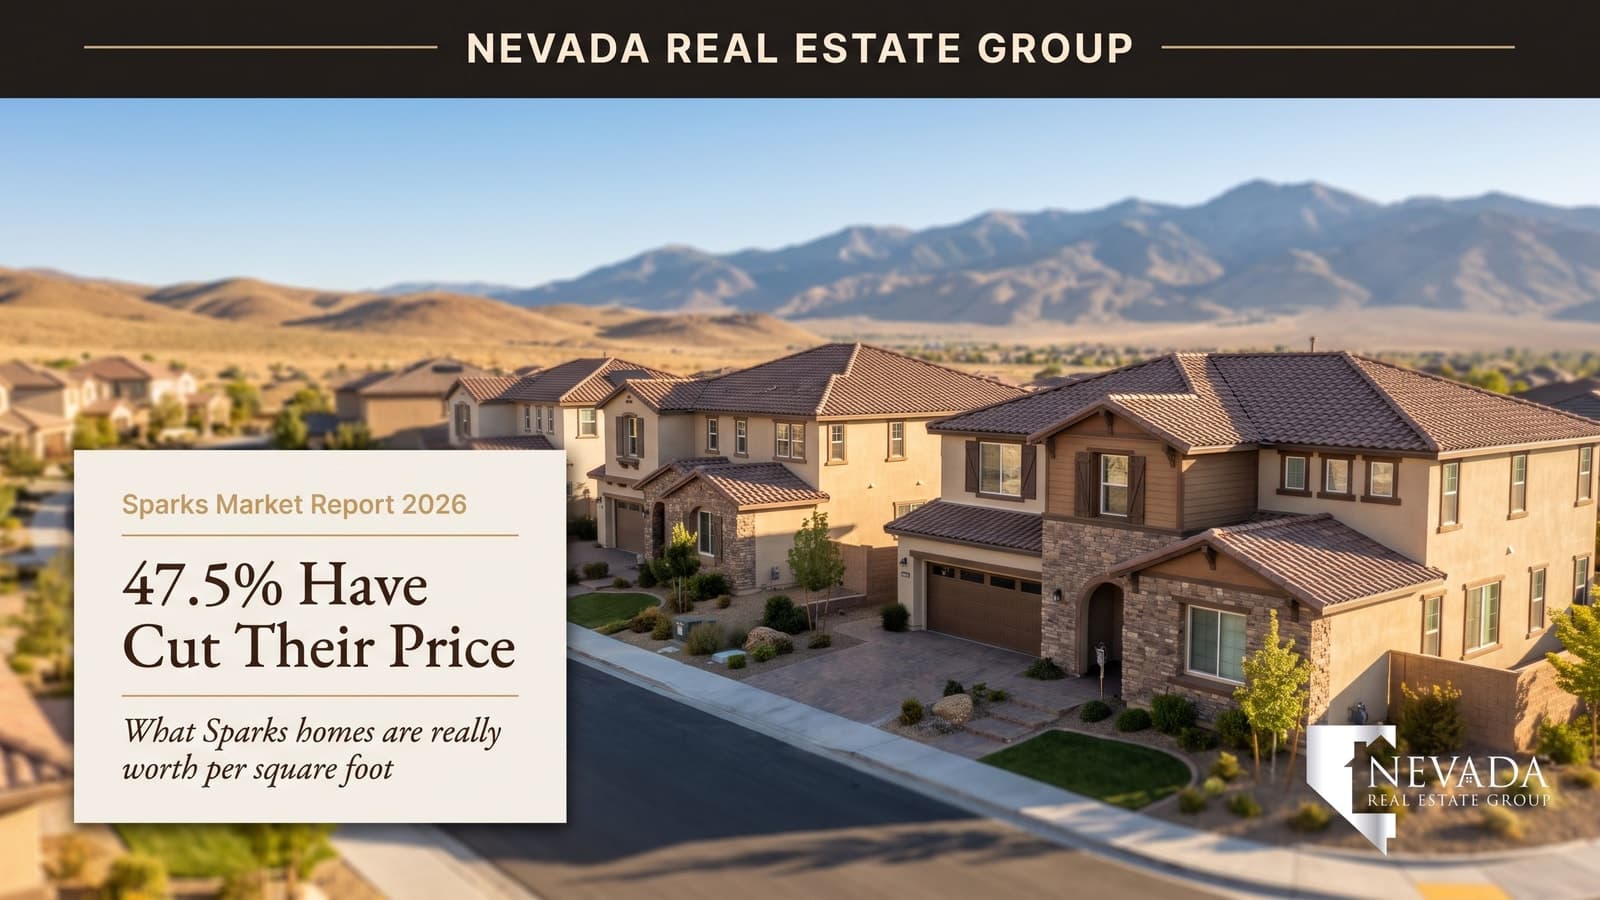
Sparks is a market where buyers hold pricing leverage. Of 512 active residential listings, 47.5% have already cut their asking price, with a median reduction of $20,000. Settled July closings (counted September 15): 146 sales at a $525,000 median and a full 100% of list, not above it. Across the last 90 days, 36% of Sparks homes sold below list and only 26% sold above. The median closed price per square foot is $304.
Restated September 15, 2026. The closing figures in this report were counted on August 20 over a trailing 90-day window, when roughly 70% of the most recent sales had posted to the MLS feed; closings keep posting for five to six weeks after a month ends. The settled figure for July is 146 closings at a $525,000 median ($555,500 single-family), a full 100% of list, 37% below asking, $306 per square foot and a 42.5-day median clock. The active count of 512 used a broader area definition than the MLS city field the series now uses (372 on September 15); the two are not a like-for-like decline. The September 2026 edition carries the settled month in full.
- 243 of 512 active Sparks listings (47.5%) have cut their asking price at least once.
- Median closed price is $549,000 — 99.9% of the median list price, not above it.
- Listings sitting past 120 days have cut a median 7.1%, or $50,000.
- Median closed price per square foot across Sparks is $304; Spanish Springs runs $318.
- In 89441, 51% of sales closed below asking and just 18% closed above.
What Do the August 2026 Sparks Numbers Show First?
Here is the market in one table, before any interpretation.
| Measure | Sparks |
|---|---|
| Active residential listings | 512 |
| Median active list price | $599,250 |
| Median closed price (90 days) | $549,000 |
| Median closed price per sq ft | $304 |
| Median days on market | 46 |
| Closings per month (Feb–Jun average) | 164 |
| Months of supply | 3.2 |
| Active listings that have cut price | 243 (47.5%) |
Two of those numbers pull in opposite directions, and it is worth saying so plainly rather than picking the one that makes a better headline. Months of supply at 3.2 is tight — by the conventional reading, under four months is a seller's market. But 47.5% of sellers cutting, a 46-day median market time, and a median sale landing at 99.9% of asking are not seller's-market behaviors. They are what a market looks like when list prices have run ahead of what buyers will actually pay.
The resolution is that Sparks does not have a surplus of homes. It has a surplus of optimistic pricing. That distinction matters enormously for how you write an offer, and it is the through-line of everything below.
One more number belongs in the frame. As of September 6, 2026, the four Sparks ZIP codes together carried 603 active listings of all property types and closed 303 sales in the trailing 90 days, according to our analysis of Northern Nevada Regional MLS data via Repliers — a wider net than the 512 residential city listings above, and the ZIP table further down breaks it out.
How Many Sparks Listings Have Actually Cut Their Price?
This is the number the market gives away for free and almost nobody looks at.
| Measure | Result |
|---|---|
| Active listings analyzed | 512 |
| Carrying original-price history | 512 (100%) |
| Have reduced at least once | 243 (47.5%) |
| Never reduced | 269 (52.5%) |
| Median reduction | $20,000 (3.6%) |
Nearly one in two sellers currently on the market in Sparks has publicly admitted their first number was wrong. That is not a distressed market — there are no forced sales driving this — but it is a market telling you, in writing, that asking prices are negotiable.
According to the Nevada Association of REALTORS, price reductions are the clearest available signal of a gap between seller expectation and buyer behavior, precisely because they are voluntary. A seller cuts when the market has stopped responding.
Two things the table does not say. It counts each listing's own history — a home relisted under a new MLS number after a cancellation starts its price record over — so the true share of Sparks sellers who have come down since their first attempt is, if anything, higher than 47.5%. And it says nothing about the concession that happens after the offer: a listing that has never cut can still close 3% under ask, which is why the sale-to-list figures below matter as much as the cut count. The cut is the public concession; the negotiation is the private one, and in Sparks right now both are running in the buyer's favor.
Why Does a Listing's Time on Market Predict the Size of the Cut?
Because sellers do not arrive at a realistic number all at once. They get there in stages, and the stages are measurable.
| Days on market | Reduced listings | Median cut | Median dollars |
|---|---|---|---|
| 0–30 days | 53 | 2.4% | $15,000 |
| 31–60 days | 68 | 2.8% | $15,000 |
| 61–90 days | 40 | 3.6% | $21,000 |
| 91–120 days | 35 | 5.0% | $25,500 |
| 120+ days | 46 | 7.1% | $50,000 |
The gradient is clean and it does not flatten. A seller in their first month gives up a median $15,000. A seller past four months has given up $50,000 — and is, by definition, still on the market.
Read that last row against the way most buyers behave. The 46 Sparks listings sitting past 120 days have already surrendered a median $50,000, and they are the most negotiable sellers in the city. A buyer who sorts by days on market before sorting by price is looking at a completely different market than one who sorts by "new."
Note what the first row implies, too. Fifty-three listings cut inside their first 30 days — sellers who priced high on purpose to test the market and came down fast. That is the cheapest cut on the table at a median $15,000, and it is still a cut every buyer's agent can see in the listing history. The seller who tests the market pays for the test in public, which is the strongest argument for pricing to the closed comps on day one rather than to the neighbor's asking price.
What Does the Median Sparks Home Actually Sell For Against Asking?
This is the number to internalize before writing any offer in this market.
Across the trailing 90 days, the median Sparks closed price was $549,000. The median list price on those same closed homes was $549,448. The median home sells for 99.9% of asking — a rounding error below the number on the sign.
The distribution matters as much as the median:
- 36% of Sparks sales closed BELOW list price
- 26% closed ABOVE list price
- The remainder closed at list
That pattern is stable, not a one-month blip — measured over 180 days and 749 sales it reads 38% below and 27% above. According to Las Vegas REALTORS and the Northern Nevada boards, a market where below-list closings outnumber above-list closings by roughly three to two is not a market that rewards pre-emptive overbidding.
So when someone tells you that you need to go over asking to win a house in Sparks, the market's own record says that is true for about a quarter of transactions — and that the larger share of sellers accepted less than they asked.
Translate that into an offer on the median home. A 2% under-ask offer on $549,000 is $538,020 and 3% under is $532,530 — the band a below-list closing typically falls in — and the 99.9% median is the middle of a distribution, not a rule that every house clears at asking. The homes that closed above list are the ones that drew more than one buyer early; the ones that closed below are the ones that did not, and after 46 days on market a seller usually knows which kind of listing they have.
What Should You Actually Pay Per Square Foot in Sparks?
Price per square foot is the single most portable benchmark a buyer has, because it survives comparison across homes of different sizes. Here is where Sparks actually trades.
| ZIP | Area | Median closed | Closed $/sq ft | Median DOM | Sold below list |
|---|---|---|---|---|---|
| 89431 | Central / older Sparks | $425,000 | $302 | 43 | 34% |
| 89434 | East Sparks | $480,000 | $302 | 39 | 32% |
| 89436 | North Sparks / Wingfield | $580,000 | $305 | 49 | 39% |
| 89441 | Spanish Springs | $750,000 | $318 | 67 | 51% |
The remarkable thing about that table is how flat the per-square-foot column is. Median closed price ranges from $425,000 in 89431 to $750,000 in 89441 — a 76% spread — while price per square foot moves only from $302 to $318, about 5%. Sparks is not four different markets at four different rates. It is one market where the expensive ZIPs are expensive mostly because the houses are bigger.
That is genuinely useful, because it gives every buyer in the city one number to test an offer against: roughly $300 to $320 per square foot, closed. A 2,200-square-foot home in Sparks that pencils to $660,000 to $704,000 is priced at market. One that pencils to $380 per square foot is not, regardless of what the listing says or how nice the finishes are.

How Do the ZIP Codes Inside Sparks Compare?
Spanish Springs, 89441, is where buyers hold the most leverage, and it is not close.
In that ZIP, 51% of closed sales came in below asking and only 18% came in above on the 120-day window behind the August table. The median listing took 67 days to sell — 21 days longer than the Sparks median and 28 days longer than 89434. It also carries the highest price per square foot in the city at $318, which tells you list prices there have been the most ambitious relative to what buyers will actually pay.
Compare that to 89431 and 89434, where above-list sales run 30% and 32% respectively and homes move in 39 to 43 days. Central and east Sparks are the competitive end of this market; Spanish Springs is where a patient buyer writes a below-list offer and gets a conversation instead of a rejection.
To put current numbers on that split, we pulled each ZIP's active board and its closings for the 90 days ending September 6, 2026, according to our analysis of Northern Nevada Regional MLS data via Repliers. All property types are included, ZIP boundaries do not match city limits — much of Spanish Springs in 89441 is unincorporated Washoe County — and the window is a rolling 90 days rather than the 120-day window above, so read these rows against each other rather than against the August table.
| ZIP | Area | Active listings | Median ask | Closed (90 days) | Median closed | Median DOM |
|---|---|---|---|---|---|---|
| 89431 | Central / older Sparks | 102 | $387,500 | 66 | $432,500 | 42 |
| 89434 | East Sparks — Sparks Marina / D'Andrea | 76 | $497,000 | 53 | $474,895 | 43 |
| 89436 | North Sparks — Wingfield Springs / Kiley Ranch | 300 | $624,950 | 147 | $570,000 | 46 |
| 89441 | Spanish Springs | 125 | $715,000 | 37 | $699,000 | 52 |
Three readings. First, 89436 is half the city: 300 of the 603 active listings and 147 of the 303 closings sit in north Sparks, and its $54,950 gap between median ask and median close is the widest in dollars on the table. When someone says "the Sparks market," they are mostly describing 89436 — the Wingfield Springs, Kiley Ranch and Pioneer Meadows tract product — with three satellites around it. Second, 89441 is still the slowest and thinnest ZIP at 52 days and 37 closings, and its $699,000 median close against a $715,000 ask is the same story the 120-day table told: ambitious asks, patient buyers, and a small sample that swings from window to window, which is why the 90-day median sits below the $750,000 figure above rather than contradicting it. Third, 89431 closed above its median ask — $432,500 against $387,500 — and that is mix, not bidding: the central Sparks active board carries the condos and the oldest stock while its closings skew to the single-family homes, so an ask-versus-close comparison at ZIP level tells you about product before it tells you about negotiation. Read it alongside the 30% above-list share from the August table and the conclusion holds — central Sparks is the competitive end, and a buyer there should not expect Spanish Springs leverage. For a buyer, the table is a budget map: a $500,000 ceiling shops 89431 and 89434 realistically, $600,000 opens the bulk of 89436, and Spanish Springs starts at a different number. For a seller, it is the comp set your buyer already has open on their phone.
What Does the Sparks Price-Band Picture Look Like?
Inventory is not distributed evenly, and neither is competition.
| Price band | Active listings | Median list | Asking $/sq ft |
|---|---|---|---|
| Under $450,000 | 116 | $357,500 | $290 |
| $450,000–$600,000 | 153 | $535,000 | $309 |
| $600,000–$800,000 | 170 | $685,000 | $280 |
| $800,000+ | 84 | $949,000 | $320 |
The $600,000 to $800,000 band is the value pocket in Sparks right now: it holds the most inventory of any band at 170 listings and the lowest asking price per square foot at $280. Buyers in that range have the widest selection and the softest per-foot pricing in the city.
The $450,000 to $600,000 band is the opposite — the entry-to-middle segment where most Sparks buyers compete, asking $309 per square foot against a citywide closed median of $304.
Map the bands onto the ZIP table and the picture sharpens. The under-$450,000 band is mostly 89431 and the condo stock along the Marina in 89434. The $450,000-to-$600,000 band is where east Sparks and the older half of 89436 compete, and it is the band most first-time and move-up buyers in the city are actually shopping. The $600,000-to-$800,000 value pocket is largely Wingfield Springs and Kiley Ranch — the newest and largest tract product in Sparks — which is exactly why it holds the most listings at 170 and the softest asking rate at $280 a foot: bigger houses on a per-foot basis are cheaper houses. And the $800,000-plus band is Spanish Springs, where acreage lots and custom homes push the asking rate back up to $320.
How Long Are Sparks Homes Taking to Sell?
The Sparks median is 46 days on the trailing 90-day window, and 49 days on the most recent 30. For context, a genuinely hot market runs under three weeks.
Six to seven weeks is enough time that a well-prepared buyer is rarely forced into a same-day decision. It is also enough time for the reduction gradient above to do its work: a home listed in early July that has not sold is now in the 31-to-60-day bucket and statistically likely to cut $15,000 next.
According to Freddie Mac PMMS data, mortgage rates have held in a narrow enough band through 2026 that carrying-cost math is stable to model — which means a seller's decision to wait is a decision with a knowable monthly price attached, and both sides of a negotiation can compute it.
The September 6 ZIP pull puts the clock by area for the 90 days ending that date: 42 days in 89431, 43 in 89434, 46 in 89436 and 52 in 89441, according to our analysis of Northern Nevada Regional MLS data via Repliers. The order has not changed since the August table — central and east Sparks fastest, Spanish Springs slowest — but the spread between fastest and slowest has narrowed from 28 days to 10, which is what happens when the slowest ZIP's overpriced tail finally cuts or comes off the market. Six to seven weeks citywide remains the working assumption for any seller pricing a listing this fall, and a buyer who has been told a house will be gone by the weekend should ask which ZIP the agent is describing.
What Should a Sparks Buyer Do With All of This?
Concretely, here is how I would use these numbers if I were writing an offer in Sparks this month.
Price the home per square foot before you look at the asking price. Sparks closed at $302 to $318 per square foot across every ZIP. Multiply that range by the home's square footage and you have the market's own opinion, arrived at independently of the seller's.
Sort by days on market. The 46 listings past 120 days have already cut a median $50,000 and are the most negotiable sellers in the city. That is a workable shortlist, not an ocean.
Do not open above asking without a reason you can name. Twenty-six percent of Sparks sales close above list. If you are writing over asking, you should be able to say what puts this specific house in that quarter — a genuinely scarce floor plan, multiple confirmed offers, a location that does not come up twice a year. "I really like it" is not that reason, and neither is a listing agent saying there is interest.
Support your number with closed comparables, not a percentage. A seller who has sat for two months has heard every lowball. Three closed comps at $304 per square foot are an argument; "10% under" is an insult, and it gets countered at full price or ignored.
Run the search yourself before you rely on anyone's summary. Every number in this report came from the same MLS feed that powers our Sparks home search, and the two filters that matter most — days on market and price reduced — are the ones buyers most often leave switched off. Sorting by "newest" shows you the sellers with the least reason to negotiate. Sorting by longest-listed shows you the 46 homes that have already given up a median $50,000.
Know what a mistake costs here. Overpaying by $50,000 on a median Sparks home is 9.1% above list. Against a market where the median home sells at 99.9% of asking and 36% sell below, that is not a competitive stretch — it is roughly a year and a half of the appreciation this market has historically delivered, spent on day one. It is also money that does not appraise, which means it comes out of the down payment in cash.

What Happens When You Pay More Than the Home Appraises For?
This is the part of overpaying that catches people, and it is worth walking through with real numbers because it does not behave the way buyers expect.
A lender does not finance a purchase price. It finances a percentage of the appraised value, and if those two numbers disagree, the difference is the buyer's problem in cash. According to the Consumer Financial Protection Bureau, the appraisal is ordered by the lender specifically so that the valuation is independent of the transaction — the appraiser is not told to justify the contract price, and in a market like this one they frequently cannot.
Work the arithmetic on a median Sparks home. A house lists at $549,000. A buyer, worried about competition, offers $599,000 — $50,000 over asking. The appraiser then values it against the same closed comparables in this report, which say Sparks trades at $302 to $318 per square foot, and returns $555,000.
The lender will finance its percentage of $555,000, not $599,000. The buyer now owes the $44,000 gap in cash, on top of the down payment, or renegotiates, or walks and risks the deposit. According to Fannie Mae selling guidance, this is the ordinary and expected function of the appraisal, not an unusual outcome — and it is why an appraisal contingency exists.
Now assume the buyer has the cash and closes anyway. They own a home whose market value is $44,000 below what they paid on day one. According to the Federal Housing Finance Agency House Price Index, Reno-Sparks has delivered meaningful long-run appreciation, but a $44,000 hole is roughly a year and a half of typical annual gains — which means the buyer spends the first eighteen months of ownership getting back to even before building a dollar of real equity. If they need to sell inside that window for any reason, they sell at a loss in a market that went up.
None of that requires the market to fall. It only requires the market to be what the numbers already say it is.
What Should Sparks Sellers Take From This Report?
The mirror image, and it is not bad news if you act on it early.
Fifty-two percent of active Sparks listings have never reduced — but a meaningful share of those are simply new. The reduction data says the market's patience runs about 60 days: through the first two months, cuts are modest ($15,000). After that they roughly triple.
The sellers doing best in Sparks right now are the ones who priced at the closed $/sq ft rather than at the asking $/sq ft of their neighbors. Asking prices in the $450,000 to $600,000 band run $309 per square foot against a $304 closed median — a small gap, but it is the gap that turns into a 46-day market time and then a $20,000 reduction.
There is a second, quieter cost to overpricing that sellers rarely price in: a listing that sits accumulates days on market, and days on market is public. By the time a home crosses 60 days, every buyer's agent in Sparks can see it, and the negotiation starts from a different place than it would have on week one. The seller who prices at market and sells in 40 days often nets more than the seller who prices 6% high, cuts twice, and sells in 110 — even when the second seller's final contract price looks similar, because they carried the property three extra months.
If your home has been listed more than 60 days without an offer, the market has already told you its opinion. The only question left is whether you would rather find that out now or in the 120-day bucket, where the median seller has given up $50,000.
How Does Sparks Compare to the Rest of Northern Nevada?
Sparks sits just below Reno on price and just above it on buyer friendliness.
Reno and Sparks share a valley, a labor market, and a school district boundary, but they do not share a price. Reno's median active list runs $649,990 against Sparks at $599,250, and Reno's asking price per square foot is $347 against $299 in Sparks. Both cities carry median market times in the high 40s. For a buyer who works in Reno and is willing to look east, Sparks is meaningfully cheaper per foot for a commute measured in minutes.
In my experience the buyers who do best in Sparks are the ones who shopped Reno first and worked out what their money buys in each city per square foot rather than per house. Reno's higher rate is not arbitrary — it reflects proximity to employment, the university, and a tighter land supply against the mountains — but a great many Sparks buyers discover that the specific things they wanted were never Reno-specific to begin with.
According to the U.S. Bureau of Labor Statistics, the Reno-Sparks metro operates as a single labor market, which is the underlying reason the two cities' housing markets move together while pricing differently. A job in either city is commutable from either city, so the price gap between them is a preference premium rather than a necessity — and preference premiums are exactly the kind that compress when buyers get disciplined about per-foot math.
Our Reno market report covers the west side of the valley, and last month's Sparks report gives the month-over-month comparison for this same data set.
Frequently Asked Questions
Is Sparks a buyer's market in August 2026?
On price behavior, yes — 47.5% of active listings have cut, the median home sells at 99.9% of asking, and below-list closings outnumber above-list ones 36% to 26%. On inventory, no: months of supply is 3.2, which is tight by the conventional four-month threshold. Sparks does not have too many homes; it has too many optimistically priced ones, and that is where a buyer's leverage comes from.
How much should I pay per square foot in Sparks?
Closed sales over the last 120 days ran $302 to $318 per square foot across every Sparks ZIP, with a citywide median of $304. Multiply the home's square footage by that range to get the market's own valuation before you consider the asking price. A home penciling well above $320 per square foot needs a specific reason — a view lot, a recent full renovation, or genuinely scarce product.
How many Sparks homes sell above asking price?
About 26% over the last 90 days, against 36% that sold below asking. Measured over 180 days and 749 sales the split is 27% above and 38% below. Most Sparks homes do not sell over list, and the median sale lands at 99.9% of it.
Which Sparks ZIP code gives buyers the most negotiating room?
89441, Spanish Springs. Fifty-one percent of closed sales there came in below asking and only 18% above, with a 67-day median market time — the slowest in the city. Central Sparks (89431) and east Sparks (89434) are the competitive end, with 30% and 32% of sales closing above list.
How big are price reductions in Sparks right now?
The median reduction across the 243 reduced listings is $20,000, or 3.6%. Depth scales sharply with time on market: 2.4% in the first month, 5.0% at three to four months, and 7.1% — a median $50,000 — past 120 days.
Is it a mistake to offer over asking price in Sparks?
Not automatically, but it requires a reason you can name. Roughly a quarter of Sparks sales close above list, so it is a real if uncommon outcome. What the data argues against is going over asking by default — on a median $549,000 home, $50,000 over list is 9.1% above asking in a market where the median transaction settles at 99.9% of it, and lenders will not finance the gap between the contract price and the appraisal.
How long do Sparks homes take to sell?
The median is 46 days over the trailing 90 days, and 49 days over the most recent 30. Spanish Springs runs longest at 67 days; east Sparks is fastest at 39.
Which Sources Inform This Sparks Market Report?
The market figures in this report are original NREG analysis of the Northern Nevada Regional MLS, pulled in August 2026. We queried every active residential listing in Sparks (512 homes, all carrying original-list-price history) and compared current asking price to original list price to produce the reduction figures. Closed-sale medians, price per square foot, days on market and sale-to-list distribution come from the same feed on trailing 90-day and 120-day windows. Monthly closing counts use February through June, because July and August closings are still being reported and would understate volume. Months of supply divides active inventory by that stable monthly rate. Medians are reported rather than averages throughout. The ZIP-level table uses a separate pull made September 6, 2026 — active counts as of that date and closings for the 90 days ending that date, all property types, ZIP by ZIP through the same Repliers access to Northern Nevada Regional MLS data — and its window and boundaries differ from the August citywide figures by design. Neighborhood figures are directional; verify any specific address before making an offer.
- Nevada Association of REALTORS — Statewide market statistics and REALTOR practice standards.
- Las Vegas REALTORS — Nevada MLS reporting conventions and statewide market context.
- U.S. Census Bureau — Sparks and Washoe County population and housing stock data.
- Nevada Department of Taxation — Property tax abatement caps for residential property.
- Washoe County Assessor — Parcel-level assessed values and ownership records.
- Freddie Mac Primary Mortgage Market Survey — Weekly national mortgage rate benchmarks.
- Consumer Financial Protection Bureau — Appraisal, loan estimate and closing disclosure guidance.
- U.S. Bureau of Labor Statistics — Reno-Sparks MSA employment and wage data.
- Federal Housing Finance Agency House Price Index — Long-run Reno-Sparks appreciation benchmarks.
- Nevada Real Estate Division — Common-interest community resale package and disclosure requirements.
- GreatSchools — School attendance-zone ratings across Washoe County.
- U.S. Energy Information Administration — Northern Nevada residential energy consumption patterns.
All market data reflects live NNRMLS information as of August 2026. Medians, inventory and days on market change continuously; contact Nevada Real Estate Group at (775) 277-2120 for current figures before making any buying or selling decision. Information is believed accurate but not guaranteed — verify all figures with a licensed Nevada real estate professional. Nevada Real Estate Group | LPT Realty | License S.181401.
Buying or selling in Sparks? Nevada Real Estate Group is Nevada's #1 real estate team, with agents across Reno, Sparks and the Northern Nevada valley. We can pull the current price-reduction list for any Sparks ZIP or price band — the same data behind this report — and run the per-square-foot math on any address before you write an offer.
Call or text (775) 277-2120 | Email info@nevadagroup.com | Search Sparks homes for sale | Talk to an agent