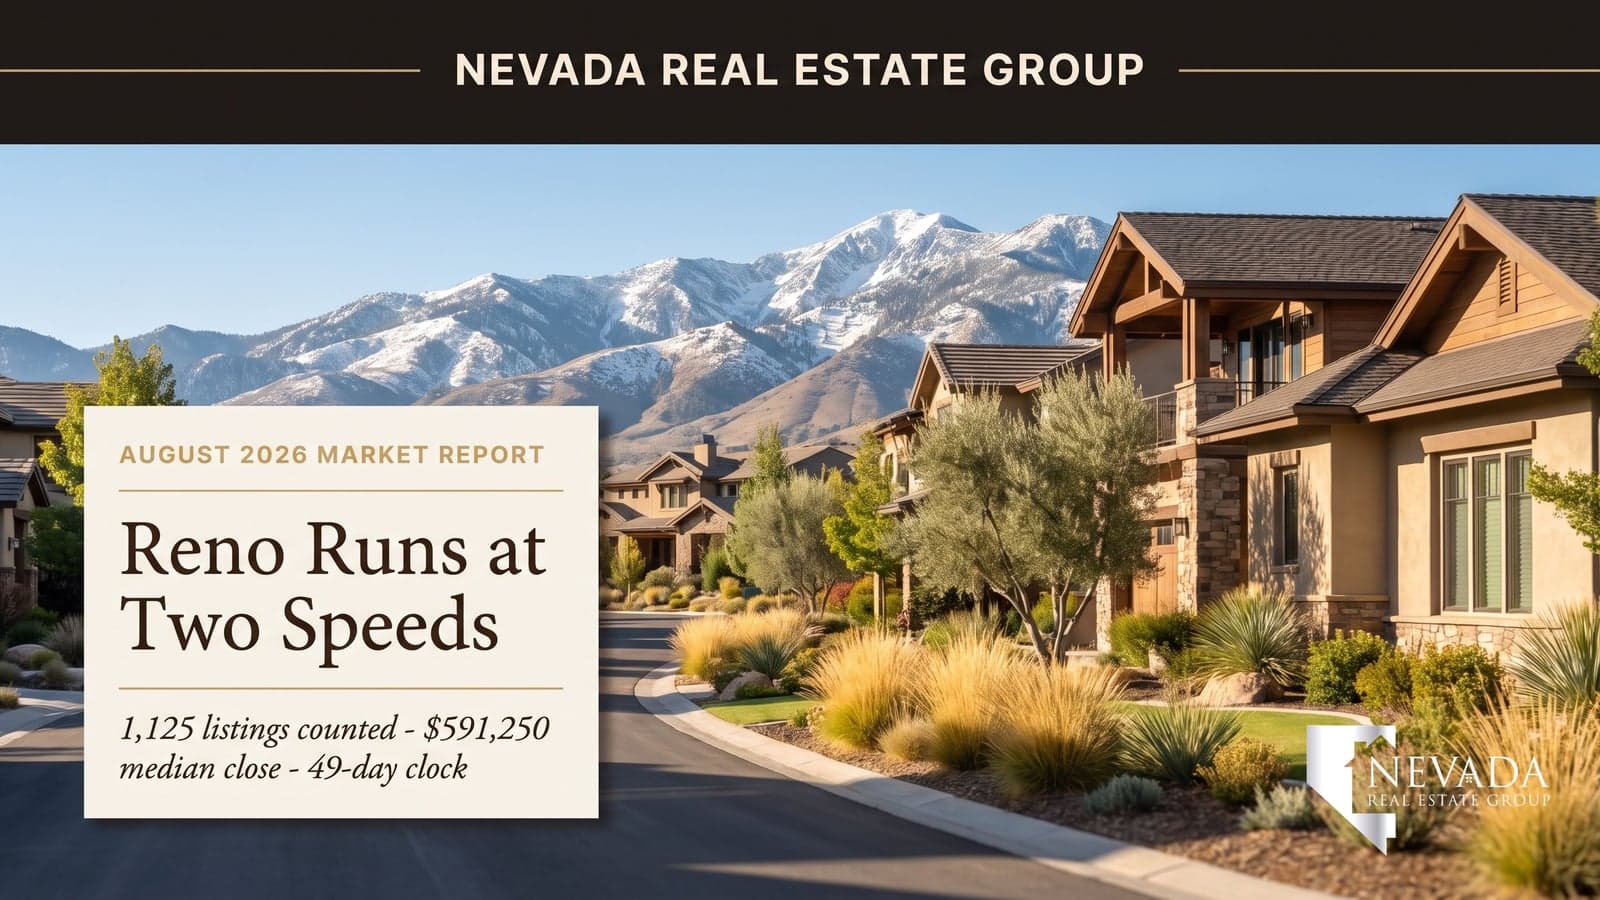

Reno's August board contains a contradiction that would confuse any single-number headline: the median July sale closed at exactly 100% of its asking price — full ask, no discount — and the median sale also took 49 days to happen, the longest big-market clock in Nevada. Both numbers are real. Together they describe a market that has split cleanly in two.
Every figure below comes from a complete sweep our team ran on August 23, 2026 — all 1,125 active Reno listings on the NNRMLS board, examined individually, plus the 245 July sales that had posted by that date; July settled at 343 closings once the month finished posting (see the restatement below). Counted, not sampled.
Reno in August 2026 runs two markets at once: July's 343 closings (settled September 15) hit a $587,000 median ($669,063 single-family) at 99.5% of list — but on a 51-day clock, after 43.2% of the board cut a median $29,100. Homes priced to the $339 bench sell at full ask; homes above it sit seven weeks, cut, then sell at full reduced ask. The discount happens before the offer, not at the table.
Restated September 15, 2026. The July closing figures in this report were counted on August 23, when about 70% of July's sales had posted to the MLS feed; closings keep posting for five to six weeks after a month ends. Fully posted, July shows 343 closings, not the 245 this report originally counted, at a $587,000 median ($669,063 single-family), 99.5% of list, 51.9% below asking, $341 per square foot and a 51-day median clock. The medians moved within a few percent and the conclusions stand; the active-listing figures, counted the same day, are unaffected. The Direct Answer and snapshot table above carry the settled figures; percentages elsewhere in the body reflect the August 23 count. The September 2026 edition of this report carries the settled month in full, and this series now waits for a month to settle before counting it.
- July median sale: $591,250 all types, $668,500 single-family — Northern Nevada's big-market premium.
- 100% median sale-to-list — but 43.2% of the board cut a median $29,100 to earn it.
- 49-day median market time: the longest big-market clock in Nevada, and the tell of the two-speed split.
- $339 per square foot — $53 above the Summerlin corridor, $87 above Las Vegas proper.
- 50% of July sales closed below list, 22% above — the healthiest over-ask share outside North Las Vegas.
What Are Reno's Key Housing Numbers for August 2026?
| Metric | Value | Context |
|---|---|---|
| Active listings | 1,125 | The full NNRMLS Reno board |
| Listings with a price cut | 43.2% | Matching Las Vegas proper's share |
| Median price cut | $29,100 | Nevada's second-largest, behind only Carson City |
| Median active list price | $583,000 | What sellers are asking |
| July closings | 343 (245 posted by Aug 23) | NNRMLS records, city of Reno |
| July median sale — all types | $591,250 | Above the asking median — mix at work |
| July median sale — single-family | $668,500 | The Sierra-market premium |
| Median sale-to-list | 100.0% | Full ask — after the pre-offer cuts |
| Sold below list / over list | 50% / 22% | A genuinely balanced split |
| Median price per square foot | $339 | Nevada's highest big-market bench |
| Median days on market | 49 | The number that explains everything |
Notice the oddity the table carries quietly: the July closing median ($591,250) sits ABOVE the active asking median ($583,000). That is mix, not magic — larger single-family homes dominated July's closings while condos and townhomes stack the active board — but it underlines the report's theme: what actually sells in Reno is not what the average listing looks like.
Two framing notes before the sections below lean on these figures. First, the windows: the active board, its 43.2% cut share, and the $583,000 asking median are as of the August 23, 2026 sweep; every closing statistic — $591,250, $339 a foot, 100% of list, 49 days — comes from the 245 sales recorded in July 2026. Second, that inverted gap is worth holding onto as a diagnostic, because it is unique in the state this month. Carson City's asking median sits $137,000 above its closing median; Sparks closes at 99.9% of a list median within $500 of its closing median; Reno's closing median sits $8,250 above its ask. The reading is not that Reno buyers are overpaying — the 100% sale-to-list ratio rules that out — but that the active board is stacked with the product that sells slowest and cheapest, while the product that sells is larger, dearer, and mostly already gone. For a buyer, that means the "typical Reno listing" you scroll past is not the typical Reno purchase; for a seller with a single-family home priced to the bench, it means you are in the half of the market that is clearing.
Why Does Reno Close at Full Ask on a 49-Day Clock?
Because the discount happens before the offer is ever written. Follow the typical journey of an overpriced Reno listing: it opens high in week one, shows quietly for a month, cuts $29,100 around day 35, draws its buyer in the following fortnight — and then closes at 100% of the reduced price. The MLS records a full-ask sale and a 49-day clock. The seller records a $29,100 lesson.
That sequence is why Reno's sale-to-list ratio flatters sellers while its market time warns them. According to the Sierra Nevada REALTORS, the region has been settling into balance all year — and Reno's version of balance is this two-step: honest pricing sells fast at ask, optimistic pricing sells slow at ask-minus-a-cut. In our experience the fast lane runs about three weeks; the slow lane runs the full seven-plus and pays the $29,100 toll for the privilege.
The slow lane also has a geography, and the ZIP-level record further down locates it. In the 90 days ending September 6, 2026, according to our analysis of Northern Nevada Regional MLS data via Repliers, 89521 — South Reno and Damonte Ranch, the city's volume engine — carried a 67-day median market time on 144 closings, while 89523 (Somersett and the northwest) ran 41 days on 85 and 89509 (the Old Southwest) ran 49 on 85. The slowest big ZIP in Reno is not the luxury foothills; it is the relocation corridor, where the most listings compete for the same arriving households and the overpriced ones wait longest for their turn.

What Did Reno Homes Actually Sell For in July?
All 245 closings, one by one:
- All-types median: $591,250. For calibration against the south: that's $161,000 above Las Vegas proper's July figure and $66,000 above the Summerlin corridor's — Reno's premium over the southern metros keeps widening.
- Single-family median: $668,500 in a 49-day median. The Sierra-market house is now firmly a two-thirds-of-a-million purchase.
- $339 per square foot — Nevada's highest big-market bench. A 2,000-square-foot Reno home benches at $678,000; a listing asking $750,000 for it is claiming $36 a foot of view, remodel, or Old Southwest address, and July's buyers made sellers prove every dollar of it.
- The 50/22/28 split — half below ask, 22% above, the rest at list. The over-ask fifth concentrates in the $450,000–$600,000 band and in turnkey condition — the same entry-tier competitiveness that drives Sparks next door.
- 100.0% median sale-to-list — with the asterisk this whole report exists to explain.
The bench turns into a price test with one multiplication. At July's $339 a foot, a 1,600-square-foot Northwest Reno ranch benches at about $542,400, a 2,000-square-foot Damonte two-story at $678,000, and a 2,800-square-foot Somersett view home near $949,200 — before the adjustments for view, lot, and remodel state that, in our experience, move a specific Reno house 5–15% to either side of the bench, a wide band because the city's housing stock spans a century of construction. The 28% of July's closings that settled exactly at list — neither above nor below — are the fast lane in its purest form: sellers who opened at the comp and got the comp, without a cut and without a counter. Add the 22% that closed over ask and exactly half of Reno's July sellers collected at least their full asking price. That is the number to picture when a listing agent says a home is "priced to sell" in Reno: it means priced to the bench, because that is where the full-ask buyers are, and the other half of the market is what happens when a listing is not.
Which Reno Areas Are Moving and Which Are Sitting?
| Dimension | South Reno / Damonte | Northwest / Somersett | Old Southwest / Midtown | Foothills luxury (Montrêux, ArrowCreek, Galena) |
|---|---|---|---|---|
| Typical band | $500K–$800K | $550K–$900K | $450K–$1M+ | $900K–$4M+ |
| August speed | The volume engine — steady | Selective; HOA-view homes move | Character demand, thin supply | Slowest — months, not weeks |
| Cut-share behavior | Near average | Near average | Below average | Well above — the $29,100 median lives here |
| Buyer profile | Families, relocators | Move-up, golf/view buyers | Character hunters, walkers | Tahoe-adjacent wealth, CA equity |
South Reno remains the market's engine room — the Damonte Ranch corridor's newer stock is where relocation demand lands first, and where the 22% over-ask sales cluster. The Old Southwest runs Boulder-City physics in miniature: fixed character stock, buyers who wait for it, sellers who rarely need to cut. And the foothills tier is where Reno's 49-day clock is actually made — luxury listings carrying six-figure spreads between neighbors, patient California equity on both sides of the table, and the board's largest cuts when patience breaks.
The 90-day ZIP record puts numbers under each column. In the 90 days ending September 6, 2026, according to our analysis of Northern Nevada Regional MLS data via Repliers, the foothills ZIP 89511 — Montrêux, ArrowCreek, and Galena — carried a $1,347,500 median ask against a $1,142,500 median closing, a $205,000 gap that is the widest in the city and the source of the largest cuts on the board. 89509, the Old Southwest and Lakeridge, closed at $650,000 in 49 days against a $700,000 ask, a tight gap for character stock. And 89506, the North Valleys, closed 103 sales at a $428,000 median — the city's entry bench, and the ZIP that absorbs the buyers priced out of everything above it. Same city, and the closed median runs from $428,000 to $1,142,500 depending on which exit you take off the freeway.
What Is Driving Reno Demand in 2026?
The fundamentals under this market have not blinked. According to the Economic Development Authority of Western Nevada, the Truckee Meadows keeps landing advanced manufacturing, logistics, and data-center employment — the Tahoe Reno Industrial Center's gravity keeps pulling households north of the California line. According to the U.S. Census Bureau, Washoe County's in-migration has run positive throughout the decade, heavily weighted toward California license plates — and those arrivals price Reno against Sacramento and the Bay Area, not against Las Vegas, which is how a $668,500 single-family median keeps finding full-ask buyers.
Two structural notes for anyone reading this market from outside it. First, Reno's supply response is genuinely constrained — the Truckee Meadows' developable land sits between federal ownership, slope, and water rights, so the valley cannot build its way to softness the way the southern metro can. Second, the Sparks alternative next door runs $100,000-plus cheaper at the median and absorbs the demand Reno prices out — our Sparks August report covers that half of the Truckee Meadows equation in the same full-count detail.
Where the demand lands is measurable. In the 90 days ending September 6, 2026, 89521 — Damonte Ranch and South Reno — closed 144 sales, the most of any Reno ZIP and more than a fifth of the city's quarterly volume across the nine ZIPs we pulled, at a $697,000 median. That is the relocation corridor by the numbers: newer stock, freeway access to the industrial center, and a price point that reads as a discount to the coastal households buying it.
What Should Reno Buyers Do With This Market?
The two-speed structure writes the playbook:
- Decide which lane your target is in before you strategize. A fresh, bench-priced South Reno listing is a fast-lane purchase: clean offer, quick decision, expect company — 22% of July sales beat asking. A 50-day foothills listing is a slow-lane negotiation: patience, evidence, and a number well under the current ask.
- Test everything against $339 a foot, adjusted by area — the bench runs higher in the Old Southwest and Somersett's view streets, lower in the older northeast.
- Hunt the pre-cut window. The most inefficient moment in Reno's market cycle is day 30–35 of an overpriced listing — after the seller has learned, before they've publicly cut. A well-evidenced offer landing in that window routinely beats the eventual post-cut competition.
- Weigh Sparks seriously at the entry bands. The $100,000 median gap between the cities buys the same commute shed; the Sparks trade-off is the single highest-leverage decision most Truckee Meadows buyers never model.
- Mind wildfire insurance in the foothills. According to the Nevada Division of Insurance, wildland-urban interface premiums keep climbing — on a Galena or Montrêux purchase, get the insurance quote before the offer, not after.
- Pick the ZIP before the house. The 90-day closed medians in the table below run from $422,000 in 89502 to $1,142,500 in 89511 — a $720,500 spread inside one city. A buyer with a $700,000 ceiling is realistically shopping four ZIPs, and a buyer with a $500,000 ceiling is shopping two; the Reno ZIP code guide maps each one to its neighborhoods so the first weekend of showings lands in the right ones.
What Should Reno Sellers Do in September?
- Choose your lane on day one. The market will assign you one anyway; the $29,100 median cut is the fee for letting it. Price to your area's trailing 90 days and the fast lane — full ask, about three weeks — remains entirely real.
- If you're in the foothills tier, price to the last six months of CLOSED luxury comps — not to the neighbor's ask, which has probably been sitting since April. July closed the full-ask sales it did because those sellers had already met the market.
- Sell into the September window. The autumn buyer pool — relocation arrivals ahead of winter, Tahoe-adjacent purchases before the snow — is Northern Nevada's last deep pool of the year. According to SNR's seasonal patterns, the fourth quarter thins fast; an overpriced September listing becomes a January negotiation.
- Document the systems. Reno's older stock — and its buyers' California-honed inspection habits — reward pre-listing inspections and service records. Every surprise the inspector finds after the cut is a second negotiation you fund.
Put numbers on the toll, because in Reno it is paid before the offer rather than at the table. On the $591,250 median, the at-table concession for the median seller is $0 — the 100% sale-to-list ratio means the price you print is the price you get, if you printed the right one. The cost of overreach is the $29,100 median public cut plus the calendar: roughly four extra weeks between the three-week fast lane and the 49-day median, during which the listing shows against every fresh, bench-priced competitor that arrives. In the foothills the toll scales with the price: the 90-day ZIP record shows 89511 closing $205,000 under its median ask, and a $1.14 million sale that opened at the ZIP's asking median gave up the equivalent of seven of the city's median cuts to get there. The seller who priced to the bench on day one paid none of it and, one time in five, collected more than asking. September's buyer pool is the last deep one of the year; the cut you avoid in September is worth more than the cut you take in November.
How Does Reno Compare Across Nevada This Month?
The statewide August scoreboard puts Reno's numbers in context: its $339 bench towers over the southern metro (Las Vegas proper $252, Henderson $257, the Summerlin corridor $286) and trails only tiny Boulder City's scarcity bench and the Tahoe basin's resort pricing. Its 43.2% cut share matches Las Vegas exactly — the correction is statewide — but its 100% sale-to-list median and 22% over-ask share reveal the deeper supply constraint underneath. And its 49-day clock is the honest cost of its premium: Reno buyers deliberate like the purchase is two-thirds of a million dollars, because it is. Next door, Carson City runs the state's widest ask-to-close gap — its August report makes an instructive companion read on what happens when a small market's sellers anchor hardest.
The Northern Nevada half of the scoreboard, from the same-day sweeps across this series, is the more useful comparison for anyone actually choosing between the three cities. Sparks carried 512 active listings with 47.5% cut at a $20,000 median — a higher cut share than Reno's, on smaller cuts — and its median closed at $549,000 against a $549,448 list, 99.9% of asking, at $304 a foot. Carson City carried 272 actives with 33.5% cut at a state-leading $39,900 median, and its 59 July closings ran $525,000 at $314 a foot on a 56-day clock, Nevada's longest. Reno sits between them on the bench and above both on the median, and it is the only one of the three whose median seller conceded nothing at the table. According to the Sierra Nevada REALTORS, the association reports the region's headline statistics for the Reno-Sparks market as a whole as well as by area, which is why a Reno-only decision needs the city-level count: blended with Sparks, the region's median drops and its cut share rises, and neither blended number describes the house you are actually pricing.
How Do the ZIP Codes Inside Reno Compare?
The city median blends a $422,000 ZIP with a $1,142,500 one, which is why it is a poor guide to any specific street. To separate them, we pulled each ZIP's active board and its closings for the 90 days ending September 6, 2026, according to our analysis of Northern Nevada Regional MLS data via Repliers. All property types are included, ZIP boundaries do not match city limits exactly, and the window is a rolling 90 days rather than July alone — so read the rows against each other, not against the July table above. The six largest ZIPs are in the table; the three smaller ones are discussed after it.
| ZIP | Area | Active listings | Median ask | Closed (90 days) | Median closed | Median DOM |
|---|---|---|---|---|---|---|
| 89511 | South foothills — Montrêux, ArrowCreek, Galena | 218 | $1,347,500 | 94 | $1,142,500 | 56 |
| 89521 | South Reno / Damonte Ranch | 312 | $712,500 | 144 | $697,000 | 67 |
| 89523 | Northwest — Somersett | 148 | $675,000 | 85 | $658,500 | 41 |
| 89509 | Old Southwest / Lakeridge | 171 | $700,000 | 85 | $650,000 | 49 |
| 89506 | North Valleys — Stead / Lemmon Valley | 175 | $471,990 | 103 | $428,000 | 47 |
| 89502 | Southeast / airport corridor | 113 | $450,000 | 49 | $422,000 | 41 |
Three readings. First, the premium is a single ZIP: 89511 is the only row above $1 million, and it carries the city's widest ask-to-close gap at $205,000 — the $29,100 median cut, seven times over, is manufactured here. Second, the two ZIPs that look alike on price behave differently on the clock: 89523 and 89509 both close in the mid-$600,000s, but Somersett's newer stock clears in 41 days while the Old Southwest's character homes take 49, and 89521 — the highest-volume ZIP in the city at 144 closings — takes 67, the longest clock of the six, because the relocation corridor is also where the most sellers are competing for the same arriving households. Third, the two entry ZIPs are where the fast lane actually lives: 89506 and 89502 closed 152 sales between them at $428,000 and $422,000, which is where the 22% over-ask share concentrates and where the Sparks comparison is most worth running. The three smaller ZIPs round out the picture: 89503, the Old Northwest near the university, closed 50 at $482,500 in 43 days; 89519, Caughlin Ranch, closed 24 at $782,500 in 42 against a $965,000 ask; and 89501, downtown, closed just 16 at $299,000 with a 116-day median — a condo market with a sample too thin to read as anything more than slow. For a buyer, the table is a budget map; for a seller, it is the comp set already open on your buyer's phone.
What Does the Median Reno Home Cost Per Month?
The $591,250 July median at the current 6.65% thirty-year rate (Freddie Mac PMMS, August 21):
| Down payment | Loan amount | P&I / month | With a seller-funded buydown to 5.9% |
|---|---|---|---|
| 10% ($59,125) | $532,125 | $3,416 | $3,157 |
| 20% ($118,250) | $473,000 | $3,036 | $2,806 |
| 30% ($177,375) | $413,875 | $2,657 | $2,455 |
The buydown column deserves a Reno-specific note: it works here, but differently than a buyer might expect. On fast-lane listings — bench-priced, under three weeks old — sellers aren't funding concessions; the 22% over-ask dynamic says they don't have to. The credit conversation lives entirely in the slow lane: the 43.2% of the board that has already cut once, where a $15,000–$20,000 buydown request lands as the second half of a negotiation the seller has already started with themselves. Same tool as the southern markets, half the board to use it on.
Two ownership-cost facts belong beside the table. According to the Washoe County Assessor, Nevada assesses property at 35% of its taxable value, and an owner-occupied primary residence carries the state's partial abatement, which caps the annual increase in the tax bill at 3% — so the tax line in a Reno payment is the one cost that is effectively capped over a long hold. The line that is not capped is insurance, and in this city it varies by ZIP more than by house: a wildland-urban interface address in 89511 or the Galena corridor can carry a premium that moves the all-in payment by more than the difference between two down-payment rows in the table above, which is why the quote belongs before the offer. Between the two, the honest all-in on the median at 20% down runs roughly $3,400–$3,700 in the flats and meaningfully more in the foothills, before any HOA — and Reno's newer master plans carry association dues that the Old Southwest's 1930s streets do not.
How Has Reno Shifted Since the June Report?
Our June Reno report described a market finding its post-frenzy footing; August shows the footing found — and the two-speed structure fully formed. Since early summer the cut share climbed into the low forties, the median public concession grew to $29,100, and the clock stretched toward seven weeks — while the closing bench and the full-ask median held. Same paradox as June, sharper edges.
The June figures make two of those movements concrete. June's report printed a $549,950 median sold price and a 42-day median market time; August's sweep prints $591,250 for July and 49 days. The clock stretched a full week, which is the slow lane growing, and the median rose 7.5%, which is mix rather than appreciation — July's closings skewed toward larger single-family homes, as the inverted ask-to-close gap in the first table shows. The June report's inventory and per-square-foot figures were measured on a different cut of the feed and are not compared here; the two numbers that are on the same basis both point the same way, toward a market that is taking longer to clear the homes it does not want and paying full price for the ones it does.
According to the Sierra Nevada REALTORS, regional inventory build has been steady rather than sudden all year — Reno's version of the statewide correction is measured in patience, not panic. And according to EDAWN's pipeline reporting, the employment engine underneath has kept adding through the summer, which is why the demand side of the two-speed market never thinned: the fast lane stayed fast even as the slow lane grew.
What September should tell us: which lane wins autumn. If the fast lane holds — bench-priced homes still clearing in three weeks at ask — the fall market stays healthy for accurate sellers. If the 49-day median stretches toward 60 while cuts spread, the slow lane's gravity is winning and winter belongs to buyers. The single number to watch is the clock; in a two-speed market, the median DOM is the referee.

How Was This Report Built?
Counted, not sampled — and Reno was this month's proof of why the discipline matters. The first automated pass at this board misread it twice: a display-permission filter hid the sold records entirely (NNRMLS gates them from public feeds), and a partial sweep of actives read the cut share at a nonsensical 1% because the original-price field thinned on the visible slice. The numbers above come from the corrected full-board sweep — all 1,125 actives, each original price against current, and all 245 July closings ratioed individually through the analytical access agents hold. This is also the practical warning for anyone comparing sources: portal "Reno sold data" is built from the public feed that hides half the story, which is why it routinely disagrees with the association's figures and with ours. When two Reno numbers conflict, ask which feed each one drank from. Across the 9,600-plus closings Nevada Real Estate Group has represented statewide, no board has punished lazy instrumentation like NNRMLS — and no market has rewarded careful reading of its two lanes more.
The ZIP-level table is this month's one addition to the method, and it deliberately uses a different window: active counts as of September 6, 2026, and closings for the 90 days ending that date, pulled ZIP by ZIP through the same analytical Repliers access to the Northern Nevada Regional MLS and including every property type. A rolling 90 days gives each ZIP enough closings — 49 to 144 in the table — to print a median worth reading, which a single month at ZIP level would not; the three smaller ZIPs discussed after the table run 16 to 50, and 89501's sixteen closings are flagged as too thin to read. Where the ZIP figures and the July city-wide figures disagree, the window and the boundary are the reasons, and both are labeled so you can tell which is which.
What Does This Mean for Your Reno Move?
Buying: lane-first strategy — sprint the fresh bench-priced stock, negotiate the aged tail, and model Sparks honestly before paying Reno's full premium. Selling: the fast lane pays full ask in three weeks and the toll booth charges $29,100 — pricing is the entire game. Watching: the number to track is the 49-day clock; if it stretches toward 60 while the cut share climbs, Reno's slow lane is winning, and the fall market will belong to buyers even at the bench.
A renter's postscript, because Reno's version of the rent-vs-buy math cuts differently than the south's: the typical three-bedroom Reno rental now runs $2,200–$2,600 against the $3,036 principal-and-interest on the median at 20% down — a wider gap than Las Vegas carries, which is the honest cost of the Sierra premium. What narrows it here is trajectory rather than parity: Reno rents have climbed with the same supply constraint that drives its prices, the fast-lane buydown play can close a third of the spread, and ownership converts the region's structural scarcity from the thing squeezing you into the thing working for you. Renters with five-year horizons in this market are, in effect, short the very scarcity their landlords are long. And for the out-of-state readers this report reliably draws — Sacramento, Bay Area, Southern California — the calibration that matters most is not Reno against Las Vegas but Reno against where you're leaving: the $668,500 single-family median that reads expensive from Nevada reads like a 40% discount from most coastal California metros, with no state income tax waiting on the other side of the move. That arbitrage, not local wage growth, is what keeps the fast lane fast.
September's sweep will run the same count, listing by listing, and publish whichever way the two-speed market breaks — the bench has earned that trust all year, and it keeps it by being counted, not sampled.
Northern Nevada specifics, street by street: (775) 277-2120 · current Reno inventory · what your home would bring.
Frequently Asked Questions
What is the median home price in Reno in August 2026?
July closings ran a $591,250 median across all property types and $668,500 for single-family homes, at $339 per square foot — Nevada's highest big-market bench, $87 a foot above Las Vegas proper. The median active listing asks $583,000; the closing median runs above it because larger single-family homes dominated July's sales mix.
Why is Reno's sale-to-list ratio 100% if the market is cooling?
Because Reno's discount happens before the offer. The typical overpriced listing cuts a median $29,100 around week five, then sells at full reduced ask — the MLS records a 100% ratio and a 49-day clock. The market is genuinely negotiable; it just negotiates through public price cuts rather than at the offer table.
How long does it take to sell a house in Reno right now?
The July median was 49 days — Nevada's longest big-market clock — but it averages two very different lanes. Bench-priced homes sell in roughly three weeks at full ask; overpriced ones sit five-plus weeks, cut $29,100 at the median, and restart. Your list price picks your lane.
Is Reno more expensive than Las Vegas?
Substantially: $161,000 more on the July all-types median and $87 more per square foot. The gap reflects Reno's constrained supply — federal land, slope, and water rights cap the buildable valley — plus a buyer pool pricing against California rather than the Southwest. For the same commute shed at a $100,000 discount, Sparks is the Truckee Meadows' value answer.
Are Reno sellers negotiating in August 2026?
43.2% of the active board has already cut publicly — the negotiation is happening, mostly pre-offer. At the table, expect little on fresh bench-priced stock (22% of July sales closed OVER ask) and real movement on anything past 45 days, where buydown credits of $15,000–$20,000 ride on top of the cuts already made.
What is driving Reno home prices in 2026?
Employment and migration against fixed supply: the Tahoe Reno Industrial Center's manufacturing and data-center growth keeps importing households, California equity keeps arriving with its own price anchor, and the valley physically cannot expand its buildable land. Demand grew into a wall; the $339 bench is where they meet.
Should I buy in Reno or Sparks?
Sparks trades roughly $100,000 of median price for a nearly identical commute shed — the highest-leverage decision in the Truckee Meadows. Reno buys the Old Southwest's character, the foothills' views, and the stronger long-run scarcity; Sparks buys the same regional economy at the entry bench. Our Reno vs Sparks comparison runs it neighborhood by neighborhood.
Which Sources Inform This Reno Market Report?
- Full NNRMLS feed sweep, August 23, 2026 — all 1,125 active Reno listings and all 245 July closings, examined individually via NREG's Repliers MLS access
- ZIP-level pull, September 6, 2026 — active counts and 90-day closings for Reno ZIPs 89501 through 89523, via NREG's Repliers access to Northern Nevada Regional MLS data
- Sierra Nevada REALTORS — regional statistics and seasonal context
- EDAWN — the employment pipeline behind demand
- U.S. Census Bureau — migration and household growth
- Freddie Mac PMMS — the 6.65% rate environment
- Nevada Division of Insurance — wildfire-zone premium context
- Washoe County Assessor — parcel records
- FHFA — price-trend context
- Bureau of Labor Statistics — Reno MSA employment
- NAR — national benchmarks
Methodology: cut share measured on the complete 1,125-listing active board (original vs current list price — a four-page sample of the same board this week would have misread the share badly, which is why this series counts). Sales measured on all 245 NNRMLS-recorded July closings in the city of Reno. One board-specific note: NNRMLS display rules hide sold records from public-facing feeds; these figures come from the analytical access agents hold, which is also why portal "Reno sold data" often disagrees with the association's. Not an appraisal of any individual home.