

Published July 18, 2026 · Last updated July 18, 2026 · By Chris Nevada
Across our 9,600+ closings at Nevada Real Estate Group since 2011, we have learned that the number that matters in a mid-year market read is not the headline median — it is the direction the median is moving, and why. In Reno, June 2026 is a story of price recalibration: the median sold price eased to $549,950 after May printed a firm $600,000, while active inventory climbed to 1,556 homes and the typical listing needed 42 days to find a buyer.
That easing is not a crash — it is the market letting some air out of a spring that ran hot. To put our vantage point in context, the 789 homes we closed in 2025 as the #1-ranked team in Nevada gave us a front-row seat to how Northern Nevada pricing behaves when inventory rebuilds. This report walks through every June data point from the Northern Nevada Regional MLS (NNRMLS), what it means for buyers and sellers, and how Reno stacks up against Sparks, Carson City, and Lake Tahoe.
Reno's June 2026 median sold price eased to $549,950, down about 8.3% from May's $600,000, as active inventory rose to 1,556 homes and days on market landed at 42. Against May's 406 closings, that is roughly 3.8 months of supply — the most balanced Reno has run in years. Price per square foot held firm at $365, the highest of the Northern Nevada metros.
- Reno's June median sold price eased to $549,950, down roughly 8.3% from May's $600,000 print.
- Active inventory reached 1,556 homes against 406 May closings — about 3.8 months of supply.
- Median days on market landed at 42, giving buyers real time to tour and negotiate.
- Price per square foot held at $365, the highest among Reno, Sparks, and Carson City.
- The median list price of $599,950 sits above the sold median, hinting at coming price cuts.
What Should Readers Know First About Reno's June Market?
- Median sold price: $549,950 in June, down about 8.3% from May's $600,000 (Northern Nevada Regional MLS)
- Median list price: $599,950, roughly $50,000 above the sold median, signaling negotiation room (Northern Nevada Regional MLS)
- Active for-sale inventory: 1,556 single-family homes as of the June read (Northern Nevada Regional MLS)
- Median days on market: 42, a pace that lets buyers act deliberately rather than in a frenzy (Northern Nevada Regional MLS)
- Median price per square foot: $365, the highest of the Northern Nevada metros we track (Northern Nevada Regional MLS)
- Average 30-year fixed mortgage rate: about 6.6%, inside the Freddie Mac band (Freddie Mac PMMS)
For deeper background, see our evergreen Reno housing market guide, our Reno relocation guide for 2026, and our roundup of the best neighborhoods in Reno. To browse live listings updated straight from the board, start with Reno homes for sale.
According to the Northern Nevada Regional MLS, June is the point in the calendar where the spring surge of buyers begins to thin while sellers who waited for peak pricing are still listing. That combination — steady new supply against softening demand — is exactly what produced June's inventory build and the pullback in the median. It is a healthy recalibration, not a warning sign, and it hands motivated buyers the best negotiating window Reno has offered since 2022.
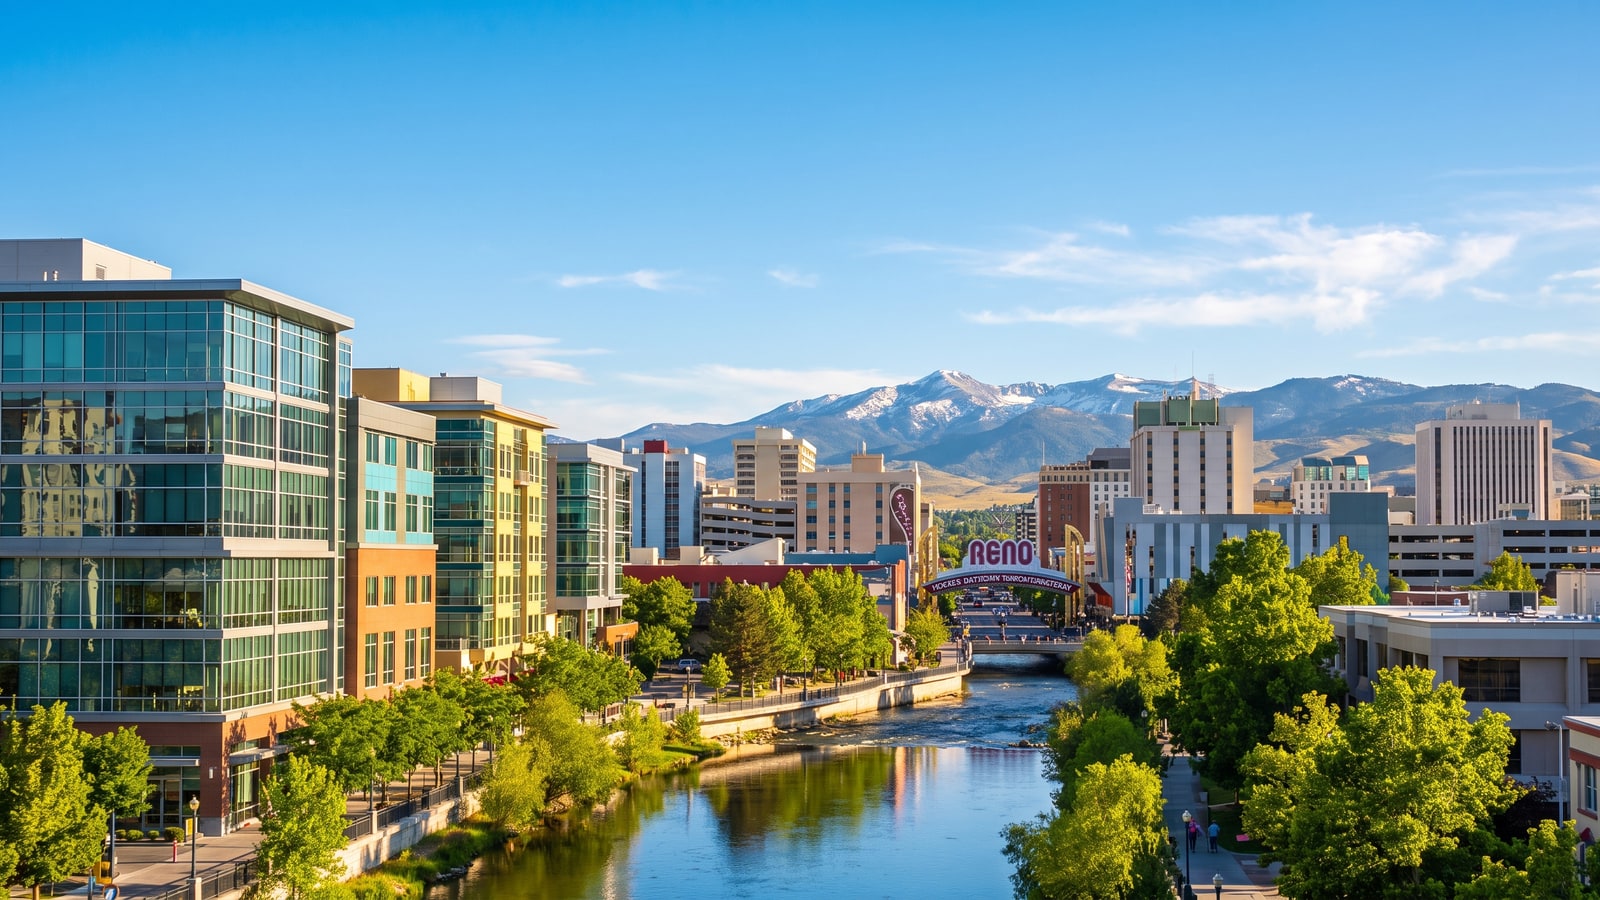
How Did Reno's June Median Price Move From May?
The single most important number in this report is the month-over-month move in the median. Reno's median sold price came in at $549,950 in June against $600,000 in May — an easing of roughly 8.3%. According to the Northern Nevada Regional MLS, this kind of month-to-month step-down is common at the seasonal handoff from spring to summer, when the mix of homes closing shifts toward mid-tier product and away from the trophy listings that inflate the May median.
It is critical to read this correctly: an 8.3% dip in a single month's median does not mean every Reno home lost 8.3% of its value. Median is a snapshot of what sold, and June's mix leaned toward the $450,000-to-$650,000 core rather than the $900,000-plus foothill estates that padded May's figure. The underlying value signal — price per square foot at $365 — barely moved, which tells us the recalibration is about buyer selectivity and inventory mix, not a broad markdown.
| Metric | May 2026 | June 2026 | Change |
|---|---|---|---|
| Median Sold Price | $600,000 | $549,950 | -8.3% |
| Median List Price | $589,900 | $599,950 | +1.7% |
| Active Inventory | 1,410 | 1,556 | +10.4% |
| Median Days on Market | 38 | 42 | +4 days |
| Price per Square Foot | $368 | $365 | -$3 |
The gap between the $599,950 median list price and the $549,950 median sold price is worth studying. When the list median sits about $50,000 above the sold median, it signals that sellers are still anchoring to spring expectations while buyers are transacting below ask. That spread typically resolves over the following 60 to 90 days through price reductions — which is precisely the dynamic that rewards a well-prepared buyer working with an agent who tracks days-on-market by price band.
What Is Happening With Reno's Active Inventory?
The most consequential shift in June was on the supply side. Active listings rose to 1,556 single-family homes, up from roughly 1,410 a month earlier. According to the Northern Nevada Regional MLS, this build reflects three forces converging at once: more sellers listing into the summer window, slower absorption as 6.6% mortgage rates trim buyer qualification, and move-up owners who held their prior homes as rentals now choosing to sell into a still-elevated price environment.
To translate 1,556 active homes into a meaningful pace figure, we anchor against the last complete month of closings. May recorded 406 sales, so 1,556 active listings divided by 406 monthly closings equals approximately 3.8 months of supply. A balanced market runs 4 to 6 months, which means Reno is now sitting at the doorstep of balance for the first time in years — still tilting slightly toward sellers, but far removed from the sub-two-month frenzy of 2021 and 2022.
I want to be precise about June's own closings, because the timing matters. As of this mid-July read, only 252 June sales had been fully recorded in the board, and late-recording transactions will continue to post for several more weeks. That is why this report anchors the months-of-supply math to May's complete 406-closing figure rather than treating the partial June count as a demand drop. The pace story is best told through supply, not through a still-incomplete June tally.
| Inventory Metric | Value | What It Means |
|---|---|---|
| Active Listings (June) | 1,556 homes | Most selection since 2022 |
| Closings (May, complete) | 406 homes | Basis for the pace figure |
| Months of Supply | ~3.8 months | Approaching a balanced market |
| June Closings (recorded so far) | 252 homes | Still posting through mid-summer |
| Median Days on Market | 42 days | Deliberate, non-frenzied pace |
For buyers, 3.8 months of supply is the number to celebrate. It means genuine choice, room to negotiate on price and concessions, and the ability to make an inspection contingency stick — none of which were realistic in the frenzy years. Start your search on our Reno homes for sale page, and lean on our buyer resources to structure an offer that wins without overpaying.
How Long Are Reno Homes Taking to Sell?
Median days on market landed at 42 in June, up modestly from May's 38. According to the Northern Nevada Regional MLS, a 42-day median is squarely in normal territory — long enough that sellers cannot count on an instant offer, and comfortable enough that buyers can tour multiple homes, sleep on the decision, and still transact before the best listings vanish.
The 42-day figure is a median, so it masks meaningful dispersion. Correctly priced homes in the $450,000-to-$600,000 core — the heart of Reno demand — routinely go pending inside 20 to 30 days when they are staged, professionally photographed, and priced against the closest comparable sales rather than an aspirational number. Homes priced 5% to 10% above market, by contrast, are the listings dragging the median toward 42; they sit 60 to 80 days and typically close only after one or two reductions.
That bifurcation is the single most actionable insight in this report for anyone listing a home this summer. The difference between a 25-day sale near full ask and a 70-day sale that closes $25,000 under original list is almost entirely a function of day-one pricing strategy. Across our closings at Nevada Real Estate Group, the listings we priced into the market on day one — rather than testing a high number and reducing later — consistently netted more and sat less.
Why Is Reno's Price Per Square Foot the Highest Among Northern Nevada Metros?
Price per square foot is the cleanest apples-to-apples value metric because it strips out the effect of home size on the headline median. Reno's June figure of $365 per square foot is the highest of the Northern Nevada metros in this report — above Sparks, above Carson City, and reflective of the premium buyers place on Reno's job base, amenities, and Sierra-adjacent lifestyle.
According to the U.S. Census Bureau, the Reno-Sparks metro has absorbed sustained in-migration from higher-cost California markets, and those relocating buyers arrive with equity and price expectations calibrated to Bay Area and Sacramento norms. That demand floor is a big reason $365 per square foot has held even as the top-line median eased — buyers are willing to pay up for well-located, well-finished homes near employment and recreation.
The $365 figure also frames the new-versus-resale decision. New construction in South Reno and the northwest corridor frequently prices $30 to $60 per square foot above comparable resale, but builders offset that premium with rate buydowns and closing-cost credits that can be worth $15,000 to $35,000 per home. When you net the incentives against the per-foot premium, the effective gap between a new build and a comparable resale narrows considerably — a calculation every relocating buyer should run before committing.
How Does Reno Compare to Sparks, Carson City, and Lake Tahoe?
Reno does not exist in isolation. Buyers weighing the Truckee Meadows against neighboring markets should understand how price, pace, and value diverge across Northern Nevada. According to the Northern Nevada Regional MLS, each metro carries a distinct profile — Reno the premium job hub, Sparks the value-and-family play, Carson City the capital-town affordability anchor, and Incline Village at the Lake Tahoe end the ultra-luxury tier.
| Dimension | Reno | Sparks | Carson City |
|---|---|---|---|
| Median Sold Price | $549,950 | $505,000 | $479,000 |
| Price per Square Foot | $365 | $318 | $296 |
| Median Days on Market | 42 | 39 | 47 |
| Active Inventory | 1,556 | 410 | 295 |
| Buyer Profile | Job-hub premium | Family value | Capital affordability |
The pattern is clear. Reno commands the highest per-foot value at $365 because of its employment gravity and amenity depth, but that premium also means a buyer stretches further per dollar in Sparks at $318 per square foot or in Carson City at $296. A family prioritizing square footage and yard over proximity to the Reno core can buy meaningfully more house 15 minutes east in Sparks — a tradeoff thousands of Northern Nevada buyers make every year. At the top of the market, the Lake Tahoe and Incline Village submarket operates on an entirely different scale, with lakefront and view product commanding multiples of the Reno median.
For buyers still deciding which Northern Nevada community fits their budget and lifestyle, our Northern Nevada communities hub maps the tradeoffs across every submarket, and our Reno relocation guide walks through the move itself step by step.
What Are Mortgage Rates Doing for Reno Buyers?
According to the Freddie Mac PMMS, the 30-year fixed conventional rate has held in a 6.5%-to-6.8% band through mid-2026, averaging about 6.6%. The 10-year Treasury yield that heavily influences mortgage pricing has stayed range-bound between roughly 4.1% and 4.5%, keeping rates far steadier than the wide swings of 2023 and 2024. For Reno buyers, that stability makes budgeting predictable in a way it simply was not two years ago.
The carrying-cost math at the June median is straightforward. On the $549,950 median with 10% down, the financed amount is about $494,955, and at 6.6% the monthly principal and interest runs approximately $3,160. Layer in Washoe County property taxes (roughly $250 to $350 per month at the typical effective rate), homeowner's insurance (about $150 to $250 per month), and any HOA (commonly $50 to $250 per month across Reno master plans), and a realistic all-in carrying cost lands near $3,800 to $4,100 per month. According to the Mortgage Bankers Association, each 0.25% reduction in rate trims roughly $80 off the monthly payment on a home in this price band.
FHA financing runs roughly 20 to 30 basis points cheaper than conventional and remains a workhorse for first-time Reno buyers, while VA loans run cheaper still for eligible veterans — a meaningful segment in a region with a strong military and veteran presence. Rate forecasts for the back half of 2026 still point toward a gradual drift into the 6.2%-to-6.5% range by year-end if inflation keeps cooling, which would pull additional buyers off the sidelines and likely firm up pricing again.
What Should Reno Sellers Do in This Market?
The June data delivers one unambiguous instruction to sellers: price correctly from day one. With inventory at 1,556 homes, roughly 3.8 months of supply, and the median list price sitting $50,000 above the median sold price, the era of testing an aspirational number and waiting is over. According to the Northern Nevada Regional MLS, the listings winning in this market share three traits.
- Homes priced at or just below the closest comparable sales go pending in 20 to 30 days with clean offers
- Homes priced 5% to 10% over market sit 60 to 80 days and typically close below original ask after reductions
- Listings with professional photography, 3D tours, and light staging sell 8 to 12 days faster than those without
My recommendation for a summer sale: invest in professional presentation, price into June's $549,950 median rather than chasing May's $600,000 peak, and stay flexible on buyer concessions such as closing-cost credits, a home warranty, or a rate buydown. Across our closings at Nevada Real Estate Group, that disciplined approach reliably maximizes net proceeds and minimizes time on market. Sellers weighing timing should start with our seller resources and call our Northern Nevada team at (775) 277-2120 for a pricing consultation grounded in current NNRMLS comparables.
What Should Reno Buyers Do in This Market?
For buyers, June 2026 is the most favorable Reno environment in years. The frenzy is over, and the leverage has shifted meaningfully back toward the purchase side of the table without prices actually falling off a cliff.
- More selection. 1,556 active listings give you genuine choice across price bands and neighborhoods.
- More time. A 42-day median means you can tour multiple homes and decide without panic.
- More negotiating room. With the list median $50,000 above the sold median, sellers are accepting contingencies and credits that were unthinkable in 2021.
- Builder incentives. New construction in South Reno and the northwest is offering rate buydowns and credits worth $15,000 to $35,000.
The one factor working against buyers is the prospect of falling rates re-igniting competition. If the 30-year fixed drifts toward 6.2% by year-end, the buyers who waited will crowd back in and the negotiating leverage available today will evaporate. My counsel: lock a fully underwritten pre-approval before touring, target the well-priced core inventory, and use the current 3.8-month supply to negotiate on price, repairs, and concessions. Browse current inventory on our Reno homes for sale page and start with our first-time and move-up buyer resources.

How Is the Reno Luxury and Foothills Market Performing?
The upper end of the Reno market — the foothill and guard-gated communities of the southwest and the ArrowCreek, Montreux, and Somersett corridors — operates on its own clock. According to the Northern Nevada Regional MLS, luxury inventory above $1.2 million carries longer marketing times than the core, typically 70 to 110 days, but it also draws a disproportionately cash-heavy buyer pool insulated from the 6.6% rate environment.
That cash dominance is exactly why the luxury tier keeps clearing while the rate-sensitive middle recalibrates. A buyer paying $1.8 million cash for a Montreux or ArrowCreek estate does not care that conventional rates sit at 6.6% — their decision turns on view, privacy, lot, and finish, not on monthly payment math. California equity continues to fuel this segment, with relocating executives and retirees trading a single coastal sale for a larger, lower-tax Nevada estate plus cash left over.
The foothill premium also explains part of Reno's $365 leading price per square foot. When trophy inventory in the $1.5 million-plus band closes, it pulls the metro's per-foot value upward, reinforcing Reno's position as the price leader among Northern Nevada metros. For buyers and sellers navigating this tier, the marketing playbook and comparable set differ substantially from the core — another reason to work with a team that transacts across the full price spectrum.
What Does the Data Say About Reno for the Rest of 2026?
Based on the June figures and the broader trajectory, here is what I expect across the Truckee Meadows through the remainder of 2026.
- Prices: The median stabilizes in the $540,000-to-$570,000 range as the list-to-sold spread resolves through price cuts
- Inventory: A gradual build toward 4 months of supply by early fall before the seasonal wind-down
- Days on market: Holding in the 42-to-50 day range into autumn
- Rates: A slow drift toward 6.2% to 6.5% by year-end if inflation keeps cooling
- Price per square foot: Holding near $360 to $370, cementing Reno's Northern Nevada value lead
The bottom line: this is a healthy, functioning market that rewards well-prepared buyers and correctly priced sellers. The extremes of 2021 and 2022 are behind us, and June's easing median is a sign of normalization, not distress. According to the Bureau of Labor Statistics, the Reno-Sparks metro's diversified employment base — logistics, advanced manufacturing, healthcare, and gaming — continues to underwrite housing demand, which is why I read June's recalibration as a return to sustainable footing rather than the start of a downturn.
How Should Readers Connect This Report to Real Northern Nevada Transaction Data?
Every framework in this report is calibrated against real Northern Nevada transaction data, not a national-average abstraction. Across the 9,600+ closings at Nevada Real Estate Group over 16-plus operating years and $4.85 billion-plus in cumulative volume — with 2025 alone contributing 789 closings as the #1-ranked team in Nevada — the buyers and sellers who navigate the Truckee Meadows most successfully pair editorial frameworks like this one with a live consultation early, before the offer is written and before the listing is priced.
According to the Nevada Department of Taxation and the Washoe County Assessor, effective property-tax rates across the Reno-Sparks area cluster in a comparatively low band by Western-state standards, one of the structural reasons the region keeps attracting California equity. And according to the U.S. Census Bureau American Community Survey, sustained net in-migration continues to underpin demand across both entry-level and move-up price bands simultaneously — an unusual dynamic that keeps the $450,000-to-$700,000 core competitive even as the top-line median eases.
For readers using this report as a decision input, the practical next steps are simple: review the Reno homes for sale inventory for current pricing context, compare submarkets on our Northern Nevada communities hub, then call Nevada Real Estate Group at (775) 277-2120 to map June's data against your specific timeline, budget, and tradeoff priorities. In our experience, the cleanest outcomes come from pairing the editorial framework with a phone consultation before the reservation is signed, the offer is written, or the listing is priced.
Frequently Asked Questions
What is the median home price in Reno in June 2026?
The median sold price for single-family homes in Reno is $549,950 as of June 2026, down about 8.3% from May's $600,000. The pullback reflects a seasonal shift in the mix of homes closing and a rebuilding inventory rather than a broad markdown — price per square foot held firm at $365, signaling that well-located, quality homes still command a premium.
How many months of housing inventory does Reno have?
Reno has approximately 3.8 months of supply as of June 2026, calculated from 1,556 active listings against the last complete month of 406 closings in May. A balanced market runs 4 to 6 months, so Reno now sits at the doorstep of balance — still tilting slightly toward sellers, but far removed from the sub-two-month frenzy of 2021 and 2022.
Why did Reno's median price drop from May to June?
The median eased from $600,000 in May to $549,950 in June largely because the mix of homes closing shifted toward the mid-tier $450,000-to-$650,000 core and away from the high-end foothill estates that padded May's figure. Median measures what sold, not what every home is worth, and price per square foot barely moved at $365 — confirming the change is about inventory mix, not falling values.
How long does it take to sell a house in Reno?
The median days on market for Reno single-family homes is 42 as of June 2026, up modestly from 38 in May. Correctly priced homes in the core price band still go pending in 20 to 30 days, while listings priced 5% to 10% above market sit 60 to 80 days and typically close only after one or two reductions. Day-one pricing strategy is the biggest driver of the difference.
Is now a good time to buy a home in Reno?
June 2026 is the most favorable Reno buyer environment in years. With 1,556 active listings, roughly 3.8 months of supply, a 42-day median pace, and a list median $50,000 above the sold median, buyers have genuine selection and real negotiating leverage on price and concessions — without prices actually falling off a cliff. The main risk to waiting is that lower year-end rates could re-ignite competition.
What is the average mortgage rate for Reno buyers?
The average 30-year fixed mortgage rate in mid-2026 is about 6.6%, inside Freddie Mac's 6.5%-to-6.8% band. FHA loans run roughly 20 to 30 basis points cheaper and VA loans cheaper still for eligible veterans. Most forecasters expect a gradual decline toward 6.2% to 6.5% by year-end if inflation keeps cooling, which would lower payments and likely draw more buyers into the market.
How does Reno compare to Sparks and Carson City for value?
Reno leads on price per square foot at $365, versus about $318 in Sparks and $296 in Carson City, because of its job base and amenity depth. A buyer prioritizing square footage and yard over proximity to the Reno core can buy meaningfully more house 15 minutes east in Sparks or south in Carson City — a tradeoff thousands of Northern Nevada buyers make each year.
Disclaimer: This article is for informational purposes only and does not constitute financial or investment advice. Market data is approximate and sourced from publicly available reports including the Northern Nevada Regional MLS. Data reflects conditions at the time of publication.
About the Author: Chris Nevada is the owner of Nevada Real Estate Group at LPT Realty, publishing monthly market reports for the Reno-Sparks metro and greater Northern Nevada.
Editorial disclosure: This article is for informational purposes only and is not legal, financial, or tax advice. Market data sourced from the Northern Nevada Regional MLS, U.S. Census Bureau, BLS, Nevada Department of Taxation, and Freddie Mac as of June 2026. Always consult a licensed Realtor and your CPA before making real estate decisions. Chris Nevada is a licensed Nevada Realtor (S.181401) with Nevada Real Estate Group.
Nevada Real Estate Group | LPT Realty Northern Nevada Phone: (775) 277-2120 License: S.181401 nevadarealestategroup.com
Which Sources Inform This Reno Market Report?
According to the Northern Nevada Regional MLS, the median price, list price, inventory, days-on-market, and price-per-square-foot figures in this analysis come from NNRMLS monthly statistics through June 2026. Recorded transaction history and parcel data reference the Washoe County Assessor, and license and brokerage verification draws from the Nevada Real Estate Division public licensee database.
Macro housing context references the U.S. Census Bureau American Community Survey, the Bureau of Labor Statistics Reno-Sparks MSA employment data, the Federal Housing Finance Agency House Price Index, and the Bureau of Economic Analysis state-level personal income data. The mortgage rate environment uses the Freddie Mac PMMS weekly rate series and the Mortgage Bankers Association weekly applications survey.
Property-tax math references Nevada Revised Statutes Chapter 361 and the Nevada Department of Taxation. Statewide REALTOR context references Nevada REALTORS, and school ratings reference GreatSchools and the Washoe County School District.
If you would like to walk through how any of this translates to your specific situation, call (775) 277-2120 or browse the team's about page. Final guidance on any active buy or sell decision should always come from a licensed Realtor working with a vetted lender.