

The Reno housing market in fall 2026 is a full-price market that has slowed since spring. Homes priced to recent closings still sell at or very near their asking price, but the typical sale takes about seven weeks from listing to closing, and more than four in ten active listings had already cut their price by September 15, 2026. Inventory has risen since February from a very low base, the 30-year mortgage rate rose to 7.03% in the week of September 24, 2026, and settled July 2026 sales closed at a $587,000 median for all property types and $669,063 for single-family homes.
This is our evergreen Reno market guide, rebuilt on September 27, 2026 from two kinds of numbers. The first is Sierra Nevada REALTORS' official monthly release, which reports single-family homes across Washoe County. The second is our own count of the Northern Nevada Regional MLS, which covers the city of Reno and every property type. They measure different things, so every figure below carries its source and its date. For the month-by-month detail, our September 2026 Reno market report and the live Reno market report page carry the full tables.
Reno's median home price was $587,000 on July 2026 closings, the latest settled month in our MLS count, and $669,063 for single-family homes. Sierra Nevada REALTORS' official August 2026 median for Washoe County single-family homes was $620,000, up 5.1% from a year earlier. Homes still close near full price but after a 51-day median from listing to closing, so buyers can negotiate on aged listings and sellers should price to recent closings.
- Reno's settled July 2026 median was $587,000 across 343 closings; single-family homes closed at $669,063.
- Sierra Nevada REALTORS reported Washoe County's August single-family median at $620,000, up 5.1% year over year.
- Washoe single-family inventory reached 965 active listings in August, still 21.3% below August 2025.
- July's sale-to-list ratio was 99.5%, yet 43.3% of Reno listings had cut price by September 15.
- At Freddie Mac's 7.03% rate, the single-family median carries about $4,018 monthly principal and interest, 10% down.
What Is the Median Home Price in Reno Right Now?
The honest answer depends on which homes you count, so here are all of them with their dates. On our count of the Northern Nevada Regional MLS, July 2026 is the most recent month whose closings have finished posting, and the city of Reno closed 343 homes that month at a $587,000 median across every property type. Single-family homes, 238 of those sales, closed at a $669,063 median; condos and townhomes, 79 sales, closed at $350,000. Those are the settled figures from our September 2026 Reno report, and I use the same numbers here so the two pages never disagree.
The board's official number measures something slightly different: single-family homes across all of Washoe County rather than the city alone. According to Sierra Nevada REALTORS' August 2026 Market Review, the Washoe County single-family median was $620,000 in August 2026, up 5.1% from August 2025 and down 1.6% from the board's revised July figure, on 392 closed sales. Its July release first printed the July figure at $635,000, up 6.9% year over year. Two things separate the board's county number from our city number. The first is geography: Washoe includes Sparks, where our July count closed at a $525,000 median, plus the unincorporated county. The second is timing: the board's August dashboard was updated on September 2, 2026, two days after the month ended, while our count waited roughly six weeks for July to settle.
Asking prices tell a third story. On September 15, 2026, the 1,121 active Reno listings carried a $569,900 median asking price: $775,000 for the 589 single-family homes and $349,000 for the 217 condos and townhomes. The single-family asking median sits about $106,000 above the settled single-family closing median, and most of that gap is foothill and Montreux listings stacking the active side of the board. When a client asks me what a Reno house costs, I give the single-family closing median first, because it is what buyers actually paid; the asking median is what sellers hope for.
| Measure | Median | Window | Source |
|---|---|---|---|
| All residential, city of Reno | $587,000 | July 2026 closings (343), settled | NREG count, Northern Nevada Regional MLS via Repliers |
| Single-family, city of Reno | $669,063 | July 2026 closings (238), settled | NREG count, Northern Nevada Regional MLS via Repliers |
| Condo and townhome, city of Reno | $350,000 | July 2026 closings (79), settled | NREG count, Northern Nevada Regional MLS via Repliers |
| Single-family, Washoe County | $620,000 | August 2026 closings (392); up 5.1% year over year | Sierra Nevada REALTORS, official release |
| Single-family, Washoe County | $635,000 | July 2026 closings (471); up 6.9% year over year | Sierra Nevada REALTORS, official release |
| Median asking price, all active listings | $569,900 | 1,121 listings as of September 15, 2026 | NREG count, Northern Nevada Regional MLS via Repliers |
| Median asking price, single-family | $775,000 | 589 listings as of September 15, 2026 | NREG count, Northern Nevada Regional MLS via Repliers |
What Do Sierra Nevada REALTORS' Official Numbers Show for 2026?
Sierra Nevada REALTORS posts a monthly Market Review covering six Northern Nevada counties on its market reports page, built from Northern Nevada Regional MLS data. These are the board's official figures, and they are the right numbers to quote when someone asks what the association reported. I pulled every 2026 release through August and lined up the Washoe County single-family page from each one. According to those releases, as first published, the Washoe single-family median climbed from $549,950 in January to a $640,000 peak in June, then eased to $635,000 in July and $620,000 in August.
| Month (2026) | Median sold | Change vs prior year | Closed sales | Median days to contract | Active inventory | Months of supply |
|---|---|---|---|---|---|---|
| January | $549,950 | -3.4% | 282 | 41 | 685 | 2.4 |
| February | $579,900 | +1.8% | 307 | 25 | 609 | 2.0 |
| March | $588,000 | +3.2% | 424 | 16 | 648 | 1.5 |
| April | $612,000 | +4.4% | 453 | 12 | 741 | 1.6 |
| May | $635,000 | +7.1% | 455 | 13 | 830 | 1.8 |
| June | $640,000 | +3.8% | 490 | 13 | 885 | 1.8 |
| July | $635,000 | +6.9% | 471 | 21 | 959 | 2.0 |
| August | $620,000 | +5.1% | 392 | 25 | 965 | 2.5 |
Three things stand out. The median has been higher than a year earlier in every month since February. Speed peaked in spring, when the median home went under contract in 12 to 13 days from April through June, and has slowed since, to 21 days in July and 25 in August. And inventory rose from 609 active single-family listings in February to 965 in August on first-published figures, though the August release shows it 5.7% below a revised July count; every one of those months still ran below the same month of 2025, 21.3% below in August, according to the board's August release.
Read the board's figures with two cautions. Each monthly dashboard is a snapshot taken within days of month-end (the June page notes it was updated June 30, 2026, and the August page September 2, 2026), so closing counts are early counts and later months' comparisons can shift. And the board counts median days to contract, while our MLS figures below count days from listing to closing, escrow included, so ours run roughly twice as long; compare each series only with itself. Our Reno market data desk publishes a separate city cut for journalists that locks each month about 40 days after month-end on its own schedule, so its closing counts differ somewhat from the settled count used here; the live market report hub lists every Northern Nevada city we track.
How Is the Reno Market Trending From Spring Into Fall 2026?
The spring market was the fastest of the year and the fall market is the most negotiable, and both are visible in the numbers. On the board's Washoe single-family series, closed sales rose from 282 in January to 490 in June, then fell back to 392 in August, 2.5% fewer than August 2025. New single-family listings fell to 451 in August, 21.6% below July. Months of supply, the board's measure of how long current inventory would last at the current sales pace, rose from 1.5 in March to 2.5 in August. That is still a tight market by the usual yardstick, but it is the loosest reading of 2026 so far.
Our own city count shows the same shape in different units. Between our August 23 and September 15, 2026 sweeps of the Reno board, active listings moved from 1,125 to 1,121, the share of listings with a price cut from 43.2% to 43.3%, and the median cut from $29,100 to $28,000. In plain terms, the board barely moved in three weeks: new listings arrived at roughly the pace homes sold, 294 in the 30 days before September 15 against 343 settled July closings, so the active count held near 1,120 for a month.
Rates moved more than prices did. According to Freddie Mac's weekly Primary Mortgage Market Survey history, the average 30-year fixed rate was 6.49% in the week of July 9, 2026, 6.76% in the week of September 10, 6.95% on September 17 and 7.03% on September 24, 2026, against 6.30% a year earlier. A buyer shopping the same single-family median in late September faces a noticeably higher payment than one who shopped it in July, which helps explain why sellers are cutting rather than holding out.
I do not publish price predictions, and nothing in this guide is one. What I can tell you is when the next hard numbers arrive: August closings settle in our count around October 10, and the October edition of our monthly report will restate August from the settled count, the same way the September edition restated the July figures first printed in our August 2026 Reno report. Until then, the board's August release is the most current complete read, and the live report page updates as closings post.
How Many Homes Are for Sale in Reno, and How Fast Are They Selling?
On September 15, 2026, our sweep of the Northern Nevada Regional MLS counted 1,121 active residential listings inside the city of Reno. The median listing had been on the market 37 days. The board splits in two: 35.2% of listings were two weeks old or younger, while 38.9% had passed 60 days and 27.6% had passed 90. That split is the defining feature of this market, and it is why an average understates both how fast the good listings go and how long the overpriced ones sit. You can see the live inventory behind these counts on our Reno homes for sale page or the full Northern Nevada MLS search.
| Price band | Active listings | Share of board | Share with a price cut | Median days on market (active) |
|---|---|---|---|---|
| Under $400K | 347 | 31.0% | 39.2% | 41.5 |
| $400K to $500K | 121 | 10.8% | 39.7% | 27 |
| $500K to $650K | 175 | 15.6% | 40.0% | 26.5 |
| $650K to $850K | 170 | 15.2% | 52.4% | 40 |
| $850K to $1.5M | 168 | 15.0% | 47.0% | 33 |
| $1.5M and up | 140 | 12.5% | 45.0% | 76 |
The Reno board is bottom-heavy in a way its closings are not. The largest band, 347 listings or 31.0% of everything for sale as of September 15, sits under $400,000, mostly condos, townhomes and North Valleys and Sun Valley product, while the settled closings cluster between $500,000 and $850,000. The fastest band with real volume is $500,000 to $650,000 at a 26.5-day median; the band that cuts hardest is $650,000 to $850,000, where 52.4% of listings have reduced, because that is where newer South Reno homes and remodeled Southwest Reno homes compete for the same buyers. The $1.5 million-plus tier takes 76 days at the median, the slowest band on the board.
On the sold side, our settled July count put the median at 51 days from listing to closing for the 343 Reno homes that closed, 52 days for single-family and 48 for condos and townhomes. The board's months-of-supply figure, 2.5 for Washoe single-family homes in August, is the cleanest official read of balance. We do not publish a citywide months-of-supply figure beside the board's, because our active-to-closings ratio and the board's method produce different figures, and printing one beside the other invites the wrong comparison; the luxury figures further down are labeled as $1 million-plus tiers. For entry-level shoppers, the Reno condos for sale search is the fastest way into the under-$400,000 band.
Which Reno ZIP Codes and Neighborhoods Are Selling Fastest?
The citywide median blends very different places, so the ZIP code is the more useful unit. The table below pairs active listings on September 15, 2026 with settled July 2026 closings for the same ZIP, all property types included, from the same count as our September report. ZIPs with fewer than 60 active listings or 15 July closings are left out rather than printed on a handful of sales.
| ZIP and area | Active | Median ask | Cut share | Median days on market (active) | July closings | July median sold | Sale-to-list |
|---|---|---|---|---|---|---|---|
| 89521 South Reno and Damonte Ranch | 217 | $695,000 | 47.5% | 41 | 77 | $709,000 | 99.4% |
| 89511 Southwest Reno and Montreux | 155 | $1,300,000 | 41.3% | 43.5 | 46 | $1,314,611 | 97.6% |
| 89509 Old Southwest | 117 | $680,000 | 51.3% | 34 | 41 | $650,000 | 98.6% |
| 89506 North Valleys | 108 | $482,000 | 39.8% | 29 | 51 | $428,000 | 100.0% |
| 89523 Somersett and Northwest | 106 | $692,450 | 45.3% | 31.5 | 35 | $620,000 | 100.0% |
| 89502 Central and airport | 83 | $440,000 | 48.2% | 33 | 28 | $385,500 | 100.0% |
| 89510 Palomino Valley and rural north | 78 | $199,500 | 34.6% | 70 | — | — | — |
| 89508 Cold Springs | 76 | $460,000 | 36.8% | 20.5 | — | — | — |
South Reno and Damonte Ranch, ZIP 89521, is both the volume engine and the slow lane: 77 July closings at a $709,000 median and 99.4% of list, but a 69-day median from listing to closing with 58.4% of sales below asking, because it is the relocation corridor where the most listings compete for the same arriving households. Somersett and the northwest, 89523, is the fast lane, closing July at a $620,000 median and 100% of list, 40 days from listing to closing. The North Valleys' 89506, which takes in Lemmon Valley and Stead, is the entry lane at $428,000 and 100% of list. Caughlin Ranch, ZIP 89519, closed 15 July sales at $825,000 and a full 100%.
The Old Southwest, 89509, is where sellers are conceding most: 51.3% of its listings have cut, because remodeled homes there list against older comps in a neighborhood where buyers have seen every recent sale; our Old Southwest Reno page covers its streets. At the top, 89511, home to Montreux and ArrowCreek, closed 46 July sales at a $1,314,611 median and 97.6% of list, the deepest discount at the table of any big ZIP in the city. For the full map of which neighborhoods sit in which ZIP, see our Reno ZIP code guide.
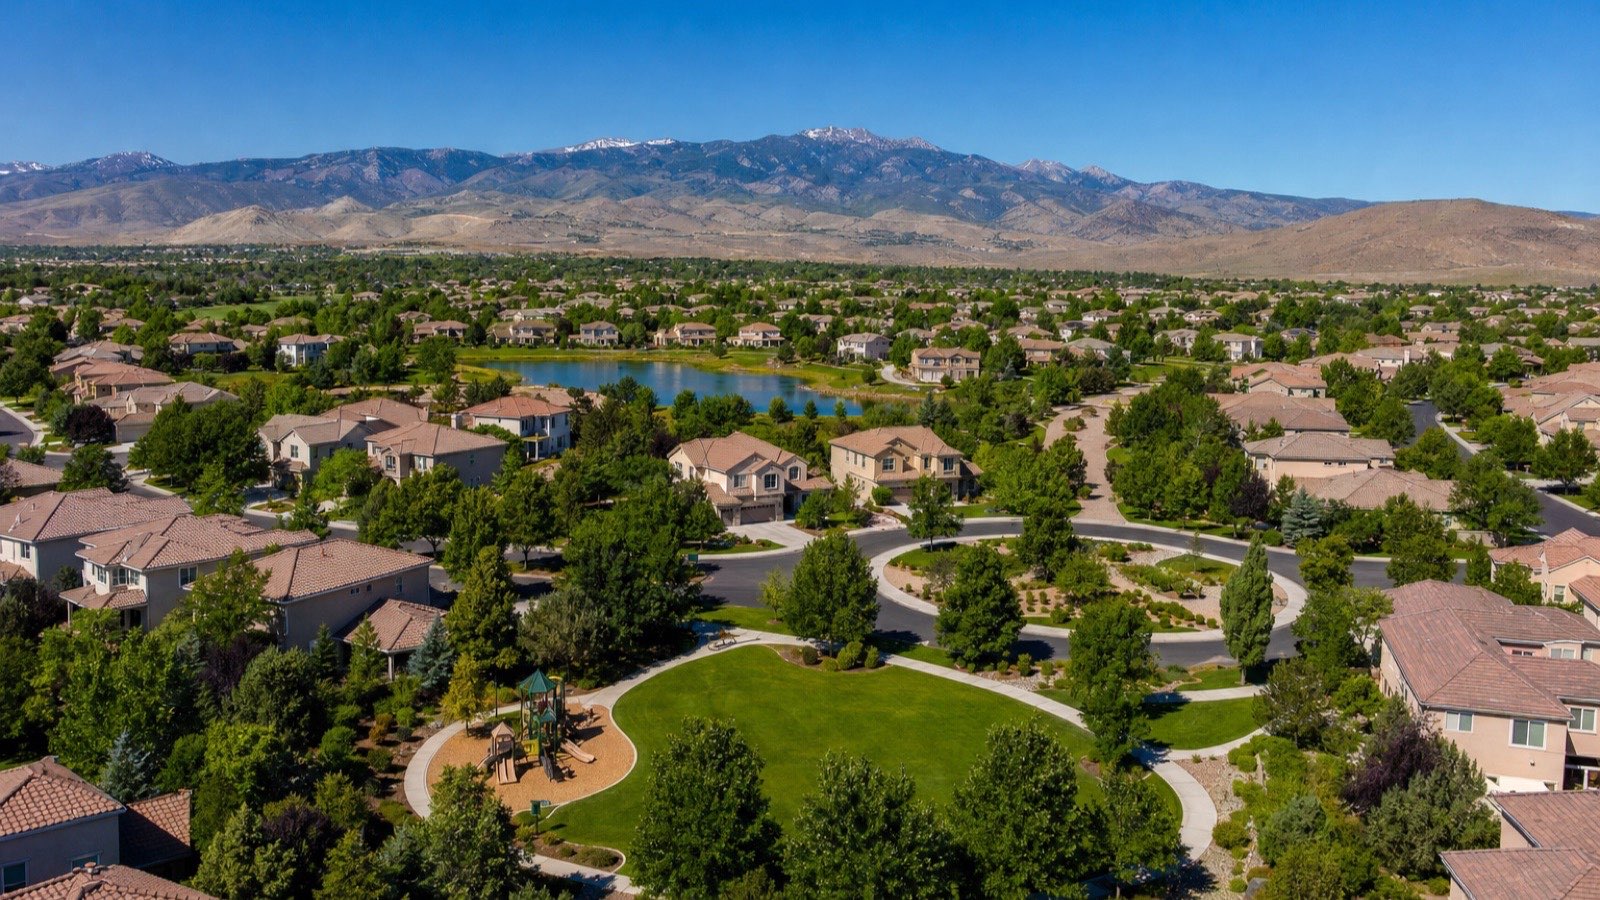
Why Do Reno Homes Sell Near Full Price When So Many Listings Cut?
Because in Reno the discount usually happens before the offer, not at the table. Across the 343 settled July closings in our count, the median home sold at 99.5% of its final list price, and 21.6% sold above asking. But 51.9% sold below asking, and 32.1% of the homes that sold had cut their price at least once before they did. The typical overpriced listing opens high, sits for a month, cuts, and then sells close to its reduced price. The MLS records a near-full-price sale; the seller records the cut and the extra weeks.
The active board shows how common that path has become. Of the 1,121 listings counted on September 15, 2026, 485 carried at least one reduction from their original asking price, a 43.3% share, with a median reduction of $28,000, or 4.9%. 174 listings had cut $50,000 or more. Among listings that had sat 60 days or longer, 70.1% had already cut. The board's own countywide numbers point the same way: according to Sierra Nevada REALTORS' August release, Washoe single-family sellers received 98.9% of list price in August 2026, down from 99.1% in July.
The two lanes also have addresses. Somersett's 89523 and the North Valleys' 89506 closed July at 100% of list, so a lowball offer on a well-priced home there usually loses to the next buyer. South Reno's 89521 and the Old Southwest's 89509 are where the slow lane lives, and a listing past 45 days with one cut is where a buyer has room. In our experience, the homes that price to the closest closed comparables in their first week are the ones that never appear in the price-cut count at all; the cheapest price reduction is the one a seller never has to make.
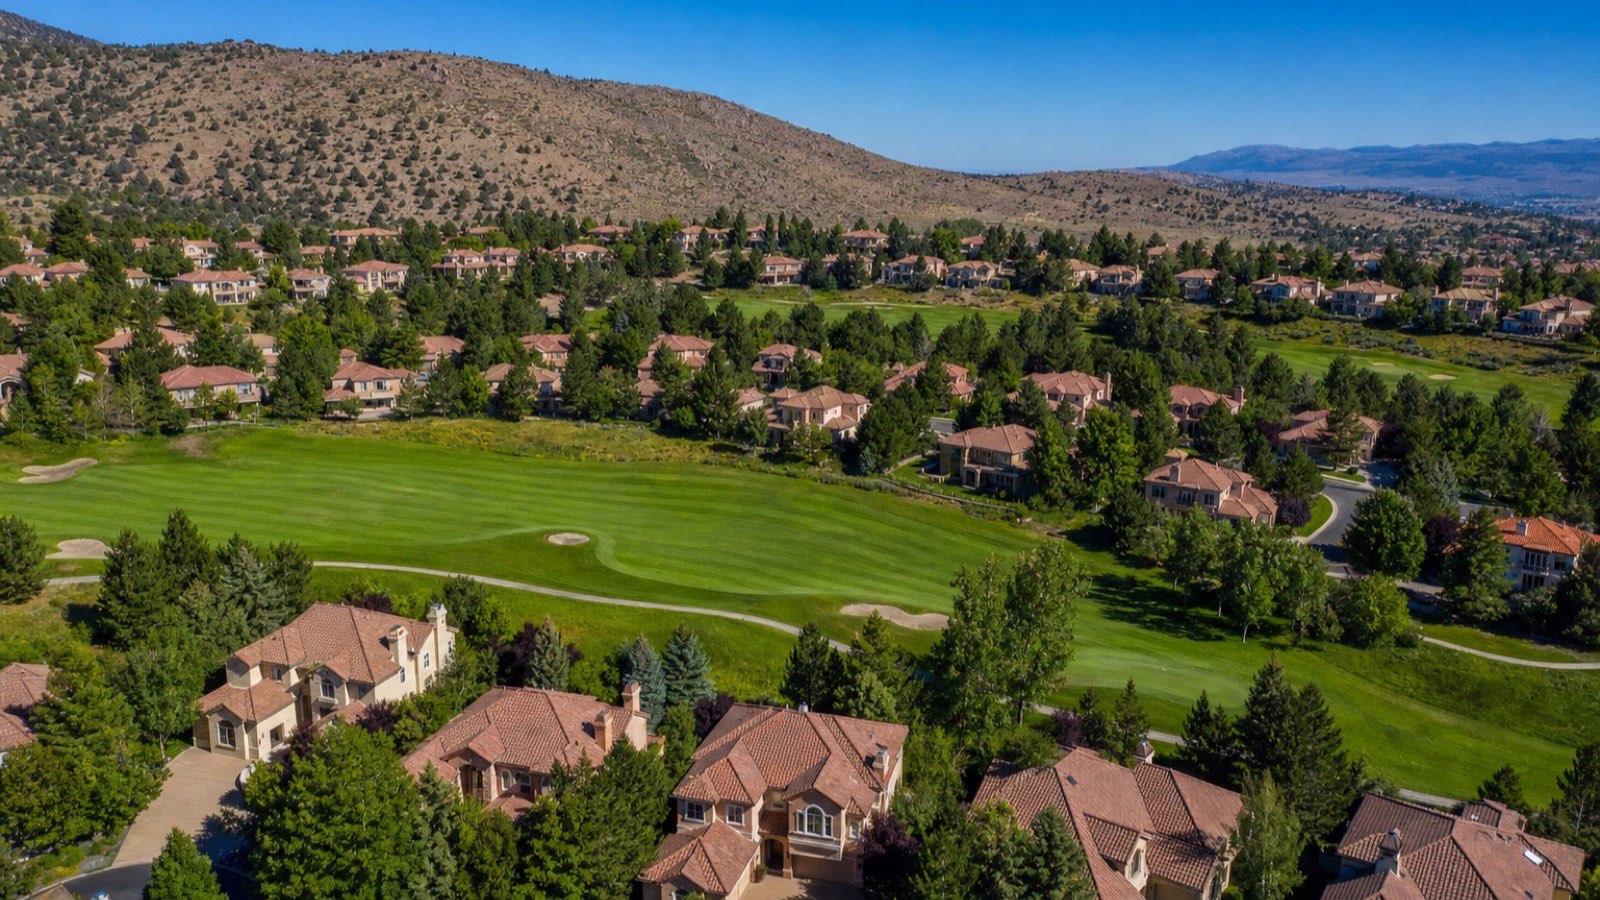
What Is Driving Reno Home Prices in 2026?
Supply is the first driver, and the board's numbers show it plainly. Even after rising since February, active Washoe single-family inventory in August 2026 was 21.3% below August 2025, and months of supply was 2.5. The Truckee Meadows is a bowl: the Sierra front to the west, public land to the north and east, and the Mount Rose foothills to the south limit how much new ground can be built on, and new homes arrive a subdivision at a time rather than in the flood a flat, unconstrained metro can produce. A market that cannot add supply quickly holds its prices through slower periods, which is what the 2026 medians have done.
Jobs are the second driver, and the honest read is steady rather than booming. According to the Bureau of Labor Statistics' Local Area Unemployment Statistics series for the Reno metro, the Reno area unemployment rate was 4.0% in July 2026, a preliminary, not seasonally adjusted figure, down from 4.4% in July 2025. The metro labor force was about 300,000 people in July 2026, close to its level a year earlier. The Tahoe-Reno Industrial Center east of Sparks, where Tesla's Gigafactory Nevada operates, remains the region's best-known employment anchor, and a stable labor market is what keeps buyers qualifying even as rates rise. A steady job base does not push prices up by itself, but it keeps the buyer pool from shrinking when payments climb.
Migration and taxes are the third driver. Reno sits within a few hours' drive of Sacramento and the Bay Area, and Nevada does not tax personal income. According to the Nevada Constitution, Article 10, Section 1, "No income tax shall be levied upon the wages or personal income of natural persons," and in our experience it comes up in most relocation conversations our Reno office has. In our experience, too, a household selling on the coast and buying a Reno single-family home near the $669,063 median often arrives with equity to spare, one reason well-priced homes still sell at full price with the mortgage rate above 7%. Our Reno relocation guide walks through the move neighborhood by neighborhood.
Rates are the fourth driver, and in 2026 they are working against prices rather than for them. The 30-year average climbed from 6.49% in early July to 7.03% on September 24, 2026, and every step up trims what a payment-limited buyer can offer. That pressure shows in the rising cut share and the slower pace to contract rather than in a falling median.
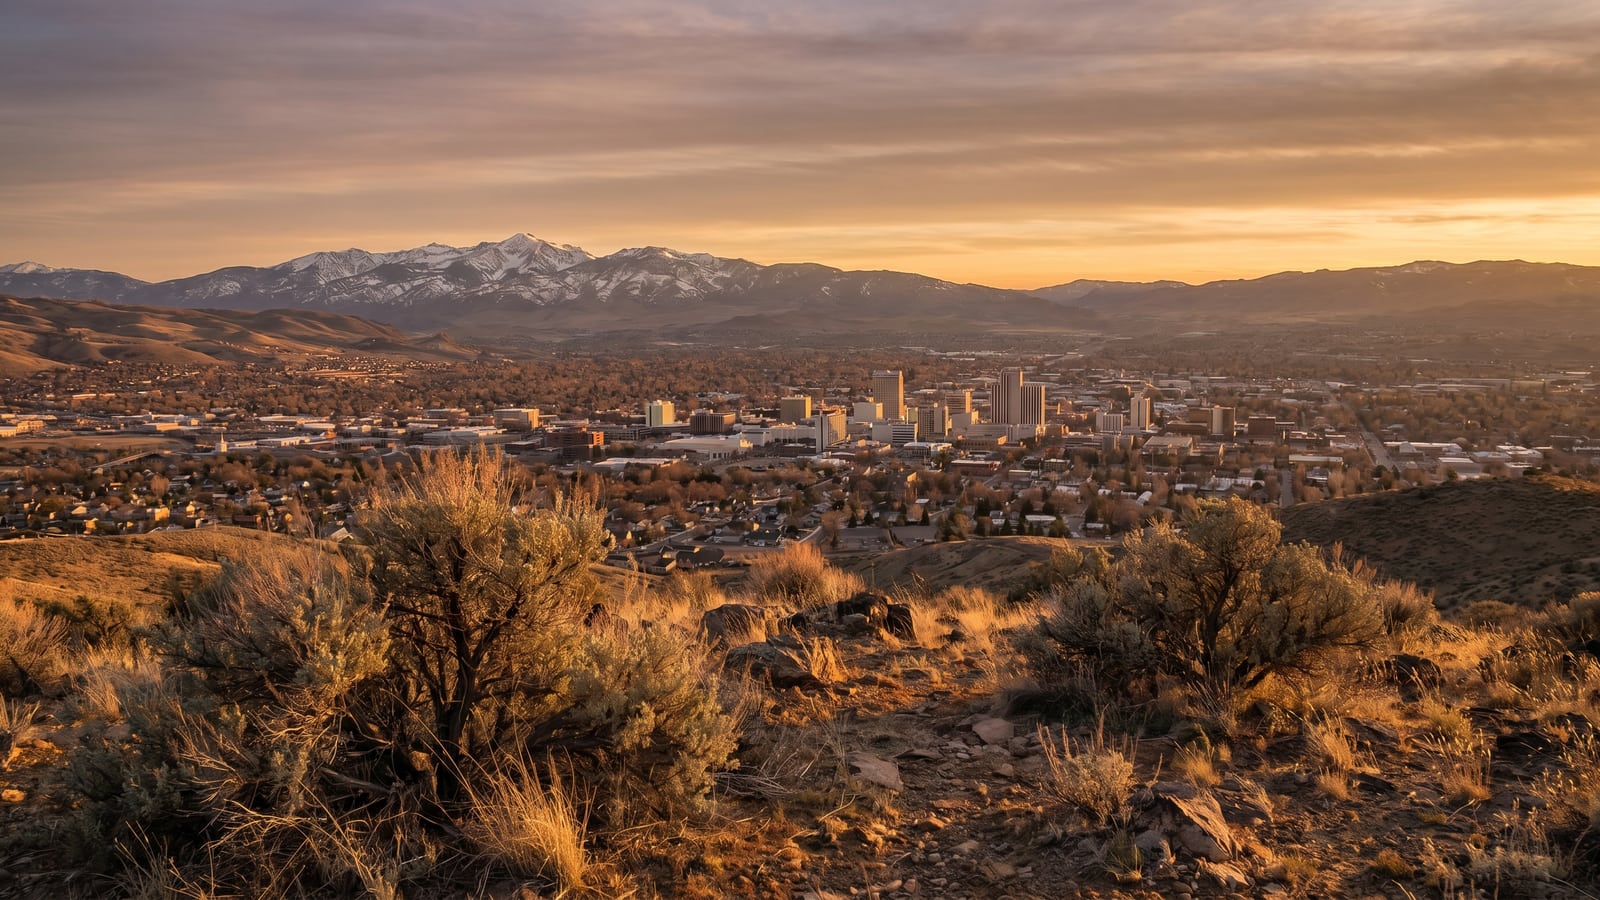
How Does Reno Fit Into the Northern Nevada Housing Market?
Washoe County, home to Reno, is the center of gravity for the Northern Nevada housing market, but it is not the most expensive county in the region. Sierra Nevada REALTORS' August 2026 release covers six counties, and according to that release Washoe accounted for 392 of the 672 closings the six reported for the month (Lyon's count includes manufactured homes). Douglas County, which takes in Minden, Gardnerville and the southeastern Lake Tahoe shore around Stateline, carried the highest median at $750,000. Lyon County, reported with single-family and manufactured homes combined, carried the lowest at $429,000.
| County | Median sold | Change vs August 2025 | Closed sales | Median days to contract | List price received | Active inventory | Months of supply |
|---|---|---|---|---|---|---|---|
| Washoe (Reno, Sparks) | $620,000 | +5.1% | 392 | 25 | 98.9% | 965 | 2.5 |
| Douglas | $750,000 | +14.5% | 91 | 29 | 98.0% | 217 | 2.4 |
| Carson City | $587,000 | +17.4% | 49 | 15 | 99.0% | 95 | 1.9 |
| Storey | $513,750 | +38.9% | 6 | 46 | 99.4% | 18 | 3.0 |
| Churchill | $450,000 | +12.5% | 27 | 33 | 96.9% | 50 | 1.9 |
| Lyon (single-family and manufactured) | $429,000 | +4.0% | 107 | 19 | 98.9% | 228 | 2.1 |
Read the smaller counties carefully. Storey closed 6 single-family homes in August and Churchill 27, so a single luxury sale or a single fixer can swing their medians by double digits; Storey's 38.9% year-over-year jump is a sample-size story, not a trend. Carson City's 17.4% gain rests on 49 sales, also a small monthly sample. Washoe, with nearly 400 closings, is the county where one month's median carries the most weight on its own, which is why I anchor this guide to it.
What the table does show clearly is that every county in the region was tight in August 2026: months of supply ran from 1.9 to 3.0, and list price received ran from 96.9% to 99.4%. For the capital city, our Carson City homes page and the Carson City market report carry the city-level detail. Buyers who want the lake rather than the valley should start with Incline Village, a separate market with its own pricing, and the full Northern Nevada communities directory covers every town in between.
Is Sparks or Carson City Cheaper Than Reno?
Yes, on the settled numbers both are cheaper than Reno, and the gap is large enough to change a search. On our July 2026 count, Sparks closed 146 homes at a $525,000 median, $62,000 below Reno's $587,000, and did it in a median 42.5 days from listing to closing, 8.5 days faster than Reno. Carson City closed 86 homes at $510,000, $77,000 below Reno, in a median 55 days. All three figures cover every property type inside each city's limits and come from the same September 15, 2026 sweep.
| Measure | Reno | Sparks | Carson City |
|---|---|---|---|
| Active listings | 1,121 | 372 | 260 |
| Share with a price cut | 43.3% | 48.7% | 40.0% |
| Median asking price | $569,900 | $599,448 | $665,000 |
| July closings | 343 | 146 | 86 |
| July median sold | $587,000 | $525,000 | $510,000 |
| July sale-to-list | 99.5% | 100.0% | 98.8% |
| July median days, listing to closing | 51 | 42.5 | 55 |
Notice the asking medians run the other way: Sparks and Carson City sellers are asking more than Reno sellers at the median, yet closing for less. That is a mix effect: 31.0% of Reno's active board sits under $400,000, mostly condos, townhomes and North Valleys listings, which pulls its asking median down, while each city's closing median reflects what buyers there actually paid. Sparks is the value twin with the shortest commute to the industrial center east of town, and it closes at a full 100% of list; Carson City closes at 98.8%, the only one of the three below 99%.
The practical read for a buyer: if your search is driven by price per square foot and a short drive to the industrial corridor, run the same search in Spanish Springs and the rest of Sparks before you pay Reno's premium. If you want Reno's west-side neighborhoods, the Old Southwest, or the foothill tier, Sparks does not offer a substitute. Our Reno versus Sparks comparison runs it neighborhood by neighborhood, and the September editions for Sparks and Carson City carry each city's full count. The live Sparks market report tracks the settled trend month by month.
How Is the Reno Luxury Market Performing?
The top of the Reno market is busier than a year ago and slower than the rest of the city. In MLS data pulled through Repliers on September 27, 2026, 651 Reno residential sales closed at $1 million or more in the 12 months ending July 2026, up from 573 in the 12 months before that, and they made up 15.9% of the 4,092 Reno residential closings in the same 12 months. The median sale in that group was $1,400,000, against $1,450,000 a year earlier, and the median home took 68 days from listing to closing, down from 77. Over those 12 months, the median $1 million-plus sale closed at 97.7% of its list price, against 99.5% for all Reno sales in July, so this is where most of Reno's at-the-table negotiation happens.
Supply at the top is looser. As of September 27, 2026, 196 Reno homes priced at $1 million or more were available (not under contract), at a $1,597,000 median asking price, which works out to about 3.6 months of supply for the $1 million-plus tier at the past year's sales pace. The pressure is concentrated at the very top: the $1.0 million to $1.5 million tier closed 364 homes in the 12 months ending July and had 83 available, about 2.7 months, while homes at $5 million and up closed 6 and had 12 available, about 24 months. The tiers in between run 3.9 months for $1.5 million to $2 million, 4.1 for $2 million to $3 million and 6.0 for $3 million to $5 million. On our September 15 count, the $1.5 million-plus band had 140 active listings, 45.0% of them cut, with a 76-day median time on market for those active listings.
By neighborhood, Montreux carried the highest median among $1 million-plus sales in the 12 months ending July 2026, $2,717,000 on 33 closings, and ArrowCreek closed 52 at a $1,850,000 median. Those medians describe only each community's sales of $1 million or more, not every sale inside the gates. In our experience, the foothill listings that sell are priced to the last six months of closed luxury comps rather than to a neighbor's asking price. Our Reno luxury real estate market guide breaks the tier down community by community, and the Reno luxury homes search shows the live inventory.
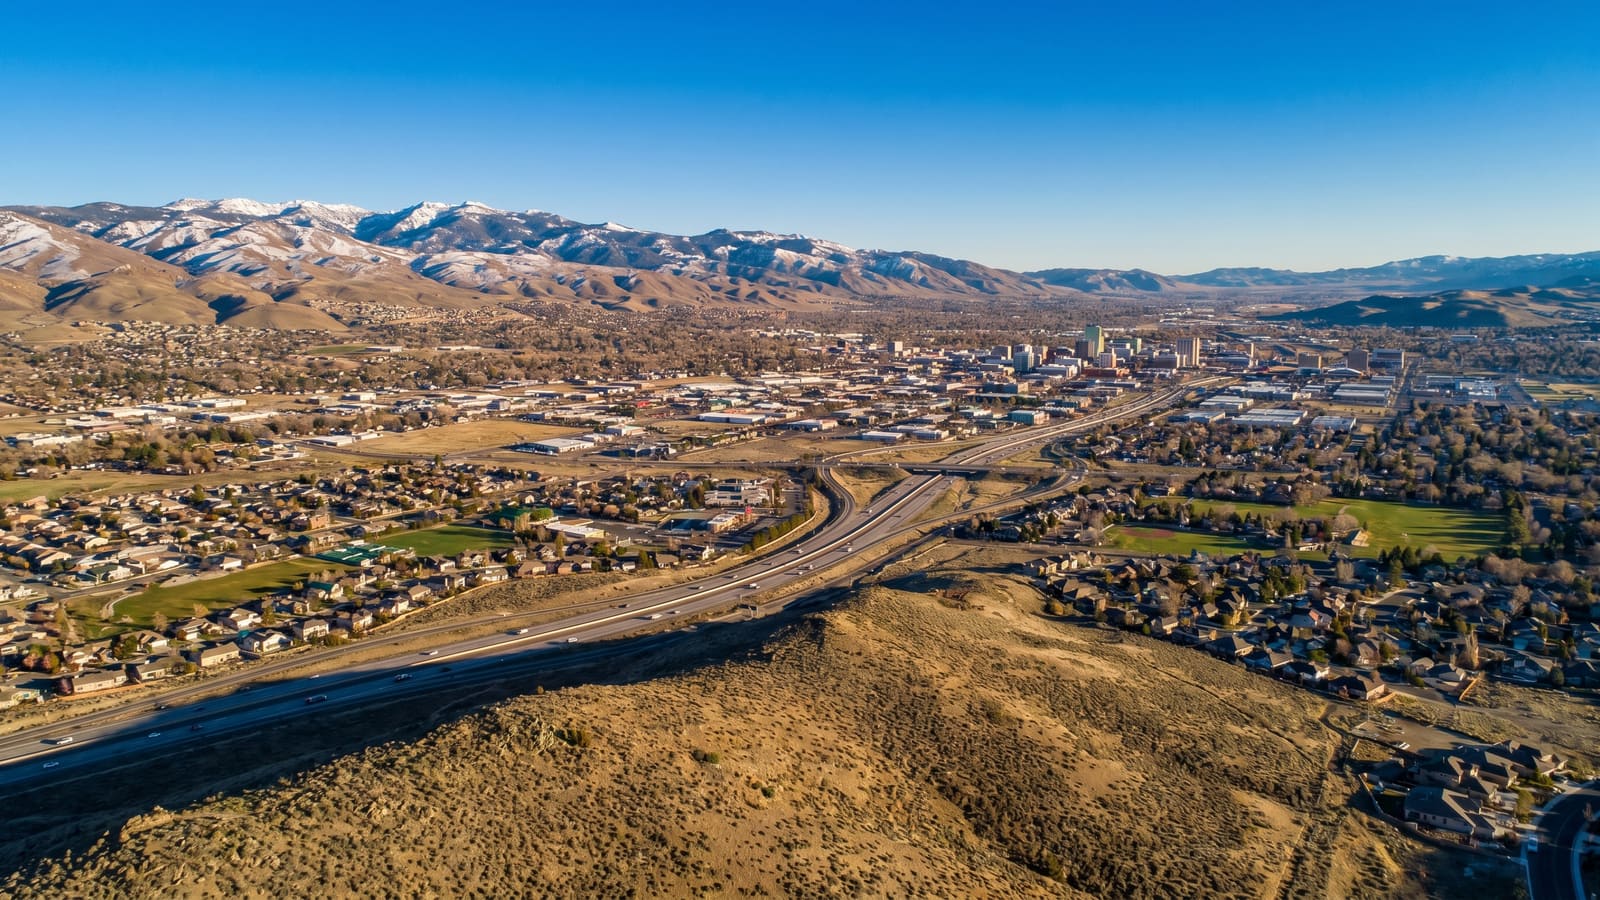
What Does the Median Reno Home Cost Per Month at Today's Rates?
According to Freddie Mac's Primary Mortgage Market Survey, the average 30-year fixed rate was 7.03% for the week of September 24, 2026. Applied to Reno's settled July medians, the principal-and-interest payment works out as shown below. Taxes, insurance, any HOA dues and mortgage insurance are additional, and these are illustrations, not loan quotes.
| Scenario | Price | Down payment | Loan amount | Monthly principal and interest |
|---|---|---|---|---|
| Single-family median, 10% down | $669,063 | $66,906 | $602,157 | $4,018 |
| Single-family median, 20% down | $669,063 | $133,813 | $535,250 | $3,572 |
| All-types median, 3.5% down | $587,000 | $20,545 | $566,455 | $3,780 |
| All-types median, 10% down | $587,000 | $58,700 | $528,300 | $3,525 |
| Condo and townhome median, 3.5% down | $350,000 | $12,250 | $337,750 | $2,254 |
Loan limits decide which of those paths is open. According to the Federal Housing Finance Agency, the 2026 baseline conforming limit for a one-unit home is $832,750, so every scenario above fits inside conventional financing. According to HUD's FHA mortgage limits lookup, the 2026 FHA limit for a one-unit home in Washoe County is $638,250. A 3.5%-down FHA loan works at the $587,000 all-types median, but at the $669,063 single-family median the base loan would be $645,646, above the county limit, so an FHA buyer is shopping below the single-family median. According to the U.S. Department of Veterans Affairs, a veteran with full entitlement has no VA loan limit, as long as the buyer can afford the loan and the appraisal supports the price.
Down payment help has its own caps. According to the Nevada Housing Division's Home Is Possible limits, active as of June 15, 2026, the Washoe County first-time homebuyer purchase-price cap is $667,808, with household income limits of $119,710 for two or fewer people and $137,666 for three or more; the settled single-family median sits $1,255 above that price cap. The program advertises up to 4% down payment assistance that can also go toward closing costs, and our Nevada down payment assistance guide compares the options.
Property tax is the line most buyers misjudge. Under NRS 361.4723, a single-family home that is the owner's primary residence qualifies for a partial abatement that caps the annual increase in the tax bill at 3% over the prior year's bill, but the new owner has to claim it; other property falls under the general cap in NRS 361.4722, which can run as high as 8%. The 3% cap also needs a prior-year valuation, so a new home's improvement value is not capped in its first year (NRS 361.4722(2) and 361.4723(2)(a)). Our Washoe County property tax guide covers the filing. According to the Consumer Financial Protection Bureau, comparing Loan Estimates detail by detail is how to decide which lender offers the best deal on the loan you have chosen, and our mortgage calculator lets you run the payment at any price and rate.
What Should Reno Buyers Do This Fall?
Start with the ZIP, not the house. In 89523, 89506 and 89519, the settled July sale-to-list ratio was a full 100%, so a well-priced listing there is a full-price purchase and a lowball loses to the next offer. In 89521 and 89509, July sales took longer or closed further below list, 69 days from listing to closing in 89521 and 98.6% of list in 89509, so in our experience a listing past 45 days with one price cut is where a buyer has real room to negotiate. Know which lane your target is in before you write, and ask your agent for every closing on the street since August 1; those individual records are in the MLS even when a month's aggregate has not settled.
Use the calendar. The board's 2026 series shows how much the season matters: in January the median Washoe single-family home took 41 days to go under contract and 282 closed, while in April it took 12 days and 453 closed. Slower months mean fewer competing buyers, and the September 2026 board, with 43.3% of listings already cut, fits that pattern. In our experience, if your timeline is flexible, the months after Thanksgiving are when a fully underwritten offer on an aged listing has the most leverage.
Price the payment, not just the house. At 7.03%, the settled $669,063 single-family median carries about $4,018 a month in principal and interest with 10% down, before taxes and insurance. A seller-funded rate buydown lowers the payment directly: on that 10%-down example, a rate one point lower, 6.03%, would bring principal and interest to about $3,622 a month. On Reno's slow-lane listings, the 43.3% of the board that has already cut once, asking for a credit is a normal part of the conversation. Have your lender price a buydown on your actual loan before you choose between a credit and a price reduction.
For a first purchase, the North Valleys and the condo and townhome market, where the July median closed at $350,000, are where a first budget goes furthest, well inside Washoe's $638,250 FHA limit and the $667,808 Home Is Possible price cap; our first-time buyer resources walk through both. New construction is worth pricing against resale too: builders' advertised incentives, often rate buydowns, should be compared with a resale on the same monthly-payment basis, and the Reno new construction page tracks current communities. And if you are relocating and unsure of the neighborhood, renting for a few months is a sound first step; our Reno rent guide covers what that costs.
What Should Reno Sellers Do Before Listing?
Start from the settled record, because it is the one buyers' agents pull. In July 2026, Reno single-family homes closed at a median $363 per square foot, and the bench shifts by ZIP: July closings ran $367 a foot in 89521, $357 in 89523, $297 in 89506 and $440 in 89511. A home that opens at its ZIP's bench, adjusted for condition, view and lot, is the kind that sells in the fast lane at or near full ask. A home that opens above it risks joining the 70.1% of 60-day-plus listings that have already cut, and paying something like the $28,000 median reduction plus the extra weeks of carrying costs.
Choose your concession before the buyer does. With the 30-year rate at 7.03% in the week of September 24, 2026, buyers are asking for rate-buydown credits, and in our experience a credit often closes a deal that a larger price cut was meant to attract, because it moves the monthly payment directly. Decide in advance how much you would give, in which form, and put it in the pricing plan rather than negotiating it under pressure in week six. A pre-listing inspection is worth considering too: every surprise a buyer's inspector finds after a price cut becomes a second negotiation.
Time the listing. The board's 2026 numbers show the spring pace, 12 to 13 days to contract from April through June, had already slowed to 25 days by August. Fall listings still sell, but they compete against a board where 38.9% of homes have been listed 60 days or longer, so presentation and pricing carry more weight than they did in May. A home listed now should be priced to sell before the holiday slowdown, not to test the market into winter.
Before you commit to a number, have an agent run your street's closed sales since spring and the active competition in your ZIP. Our home valuation request starts that analysis, the sellers resource walks through pricing to comps, and our seven-day listing agreement page explains how that option works. The one number I would not anchor to is a neighbor's asking price; in this market, the asks and the closings are telling different stories.
Frequently Asked Questions
What is the median home price in Reno?
On our count of the Northern Nevada Regional MLS, July 2026, the latest settled month, closed at a $587,000 median across 343 Reno sales of every property type, and $669,063 for single-family homes. Sierra Nevada REALTORS' official August 2026 median for Washoe County single-family homes was $620,000, up 5.1% from August 2025. The board's figure covers the whole county, including Sparks, and single-family homes only, which is why it differs from the city number. For a single-family home in Reno proper, the settled $669,063 median is the best single answer as of September 27, 2026.
Are Reno home prices going down?
Not on a year-over-year basis. The board's Washoe single-family median was higher than the prior year in every month from February through August 2026, and August's $620,000 was up 5.1%. It did ease month to month on first-published figures, from a $640,000 June peak to $635,000 in July and $620,000 in August, and price cuts are common: 43.3% of Reno listings had cut by September 15, 2026. That describes a market where sellers are negotiating, not one where closing prices are falling. I report the data as it settles and do not publish price predictions.
Is Reno a buyer's market or a seller's market right now?
It is somewhere in between, and it depends on the price band and ZIP. Months of supply for Washoe single-family homes was 2.5 in August 2026, which is still tight by the usual measure, and July's settled sale-to-list ratio in Reno was 99.5%. But 51.9% of July sales closed below asking, 43.3% of active listings had cut price as of September 15, 2026, and active listings in the $1.5 million-plus band had a 76-day median time on market. Well-priced homes in 89523 and 89506 still sell at full ask; aged listings in 89521, 89509 and the luxury tier give buyers real leverage.
How long does it take to sell a house in Reno?
It depends on which measure you use. On the board's Washoe single-family series, the median home went under contract in 25 days in August 2026, up from 12 to 13 days in the spring. On our count of Reno's settled July 2026 closings, the median home took 51 days from listing to closing, a longer measure because it includes escrow. On the active board as of September 15, 2026, 35.2% of listings were two weeks old or younger while 38.9% had passed 60 days. A home priced to its ZIP's recent closings sells in the first few weeks; an overpriced one sits and cuts.
How many homes are for sale in Reno?
Our sweep of the Northern Nevada Regional MLS counted 1,121 active residential listings inside the city of Reno on September 15, 2026, including 589 single-family homes at a $775,000 median asking price and 217 condos and townhomes at $349,000. Countywide, Sierra Nevada REALTORS reported 965 active single-family listings in Washoe County for August 2026, 21.3% fewer than a year earlier, or 2.5 months of supply. New listings roughly kept pace with sales, with 294 Reno listings arriving in the 30 days before September 15.
Is Sparks cheaper than Reno?
Yes. On our settled July 2026 count, Sparks closed 146 homes at a $525,000 median against Reno's $587,000, a $62,000 gap, and Sparks homes sold faster, a median 42.5 days from listing to closing against Reno's 51, at a full 100% of list. Carson City was cheaper still at $510,000 on 86 closings. Sparks is the value option with the shortest commute to the Tahoe-Reno Industrial Center; Reno buys the west-side neighborhoods, the Old Southwest and the foothill luxury tier that Sparks does not have. Compare both before you choose.
Why do Reno median price figures differ between sources?
Because they measure different homes over different windows. Sierra Nevada REALTORS reports single-family homes across all of Washoe County, including Sparks, and snapshots each month's data within days of month-end, then posts the PDF to its website weeks later. Our count covers the city of Reno only, includes condos and townhomes unless labeled single-family, and waits about 40 days for a month's closings to finish posting before we call it settled. National portals often use yet another geography and window. When two numbers conflict, check the geography, the property type and the date before deciding one is wrong.
How Can Our Northern Nevada Team Help With Your Reno Move?
A market report tells you what the typical home did; it cannot tell you what your home, or the one you want, will do. That takes the closed sales on your street, the active competition in your ZIP this week, and a realistic plan for pricing or negotiating around both. That is the work our Reno office does every day, from first-time buyers in the North Valleys to sellers in Montreux and ArrowCreek.
Nevada Real Estate Group is the #1 real estate team in Nevada, with 9,600+ closed transactions, $4.85 billion+ in total sales volume, a 150+ agent team and 16+ years in business, including 789 homes and $361.5 million+ in 2025 alone. Our clients have left 9,061+ verified five-star reviews. In our experience, the buyers and sellers who do best in a two-speed market like this one bring in an agent before the offer is written or the list price is set, not after the first price cut.
If you are buying, we will map your budget to the ZIPs where it wins, pull the aged listings where a seller has already started negotiating, and compare a buydown credit with a price reduction using your lender's quote. If you are selling, we will pull your ZIP's bench, show you the active competition, and build the concession plan before the first showing. Call or text our Northern Nevada team at (775) 277-2120, visit us at 1755 E Plumb Ln in Reno, or read more about our team. If you are still deciding who to trust with the transaction, our guide to finding a top Reno agent covers how to vet one.
Disclaimer: This article is for informational purposes only and is not financial, tax or legal advice. Market figures are dated where they appear, come from Sierra Nevada REALTORS' official releases or from Nevada Real Estate Group's counts of Northern Nevada Regional MLS data, and change daily. Payment figures are illustrations, not loan quotes. Chris Nevada is a licensed Nevada REALTOR, license S.181401, with Nevada Real Estate Group, brokered by LPT Realty.
Which Sources Inform This Reno Housing Market Guide?
- Sierra Nevada REALTORS, market reports: the board's monthly Market Review releases for January through August 2026, source of the Washoe County single-family series and release timing.
- Sierra Nevada REALTORS, August 2026 Market Review (PDF): the official August figures for Washoe, Carson City, Douglas, Lyon, Storey and Churchill counties, data updated September 2, 2026.
- Sierra Nevada REALTORS, July 2026 Market Review (PDF): the official July Washoe single-family median of $635,000.
- Nevada Real Estate Group counts of Northern Nevada Regional MLS data via Repliers: every active Reno listing as of September 15, 2026 and every settled July 2026 closing, published in our Reno market report; the $1 million-plus figures are MLS data pulled through Repliers on September 27, 2026.
- Freddie Mac Primary Mortgage Market Survey: the 7.03% average 30-year fixed rate for the week of September 24, 2026; the earlier weekly rates come from Freddie Mac's PMMS history file.
- Bureau of Labor Statistics, Reno metro unemployment rate series: the 4.0% preliminary July 2026 rate and the 4.4% July 2025 rate.
- Federal Housing Finance Agency, 2026 conforming loan limits: the $832,750 baseline one-unit limit.
- HUD FHA mortgage limits lookup: the 2026 Washoe County one-unit FHA limit of $638,250.
- U.S. Department of Veterans Affairs, VA loan limits: no loan limit for veterans with full entitlement.
- Nevada Housing Division, Home Is Possible income and purchase-price limits: the Washoe County caps active as of June 15, 2026.
- Nevada Legislature, NRS Chapter 361: the 3% primary-residence abatement in NRS 361.4723 and the general cap in NRS 361.4722.
- Nevada Constitution, Article 10: the prohibition on a personal income tax.
- Consumer Financial Protection Bureau, comparing Loan Estimates: the lender comparison framework.
Prices, inventory and rates change daily; every figure above is as of the date stated beside it. This guide is market analysis, not a valuation of any specific property.