
"Is Carson City safe?" has a short official answer at the city level and no official answer at the street level. This guide reports what the Carson City Sheriff's Office, the State of Nevada and the FBI published for 2025, explains what each number counts, and tells you who to ask about a specific address.
You won't find a list of preferred streets here. With only a few hundred offenses a year, Carson City's numbers can't support one, and fair housing guidance asks agents to give every client the same objective facts and send detailed questions to the agency.
Updated October 31, 2026: We rebuilt this guide on 2025 FBI and state records and changed its title. Earlier versions named preferred neighborhoods and corridors and gave comparisons without a figure behind them. Those are gone.
Updated November 2, 2026: We re-read this guide's sources. The FBI's agency tables wouldn't load, so we rebuilt the rates on Nevada's portal and Census population figures and took out the FBI county counts, group averages and staffing figures. That includes the burglary gap between the FBI and state totals that an earlier version described, which we can't currently confirm.
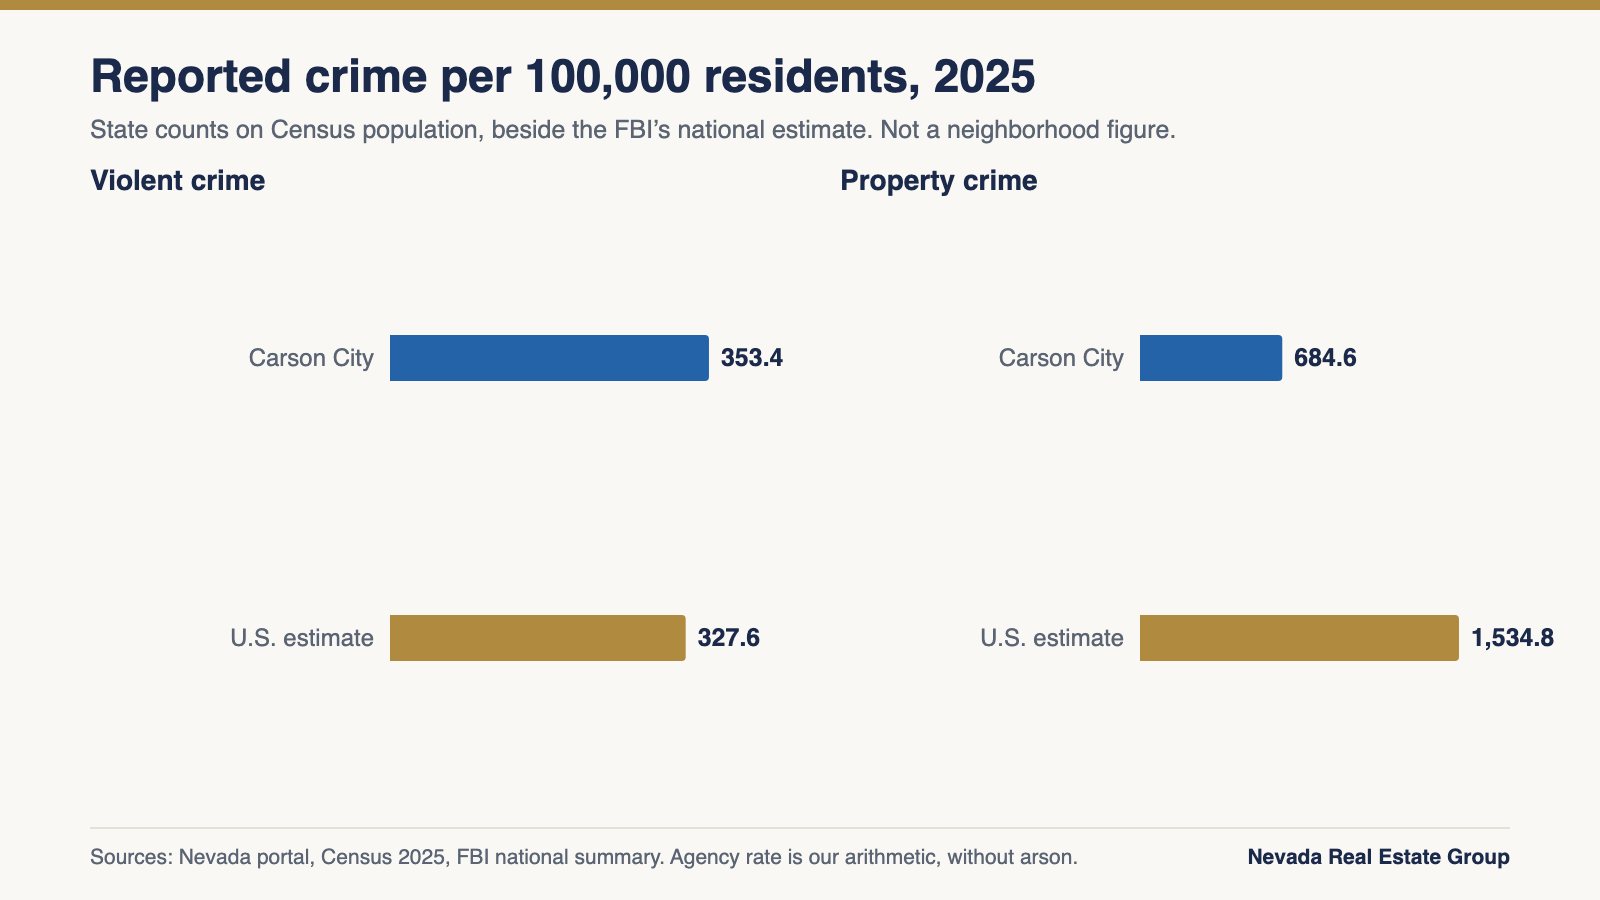
On Nevada's crime portal, the Carson City Sheriff's Office recorded 207 violent and 406 property crimes in 2025, about 353 and 685 per 100,000 residents using the Census estimate of 58,571 and leaving arson out to match the FBI's definition. The FBI's national estimates were 327.6 and 1,534.8. These totals cover the whole consolidated city, not a street, so ask the Sheriff's Office about an address.
- The state portal shows 207 violent and 406 property crimes for the Carson City Sheriff's Office in 2025.
- On a 58,571 population, that works out to about 353 violent and 685 property crimes per 100,000.
- State portal counts show violent crime up 11.89% in 2025 and property crime down 18.31%.
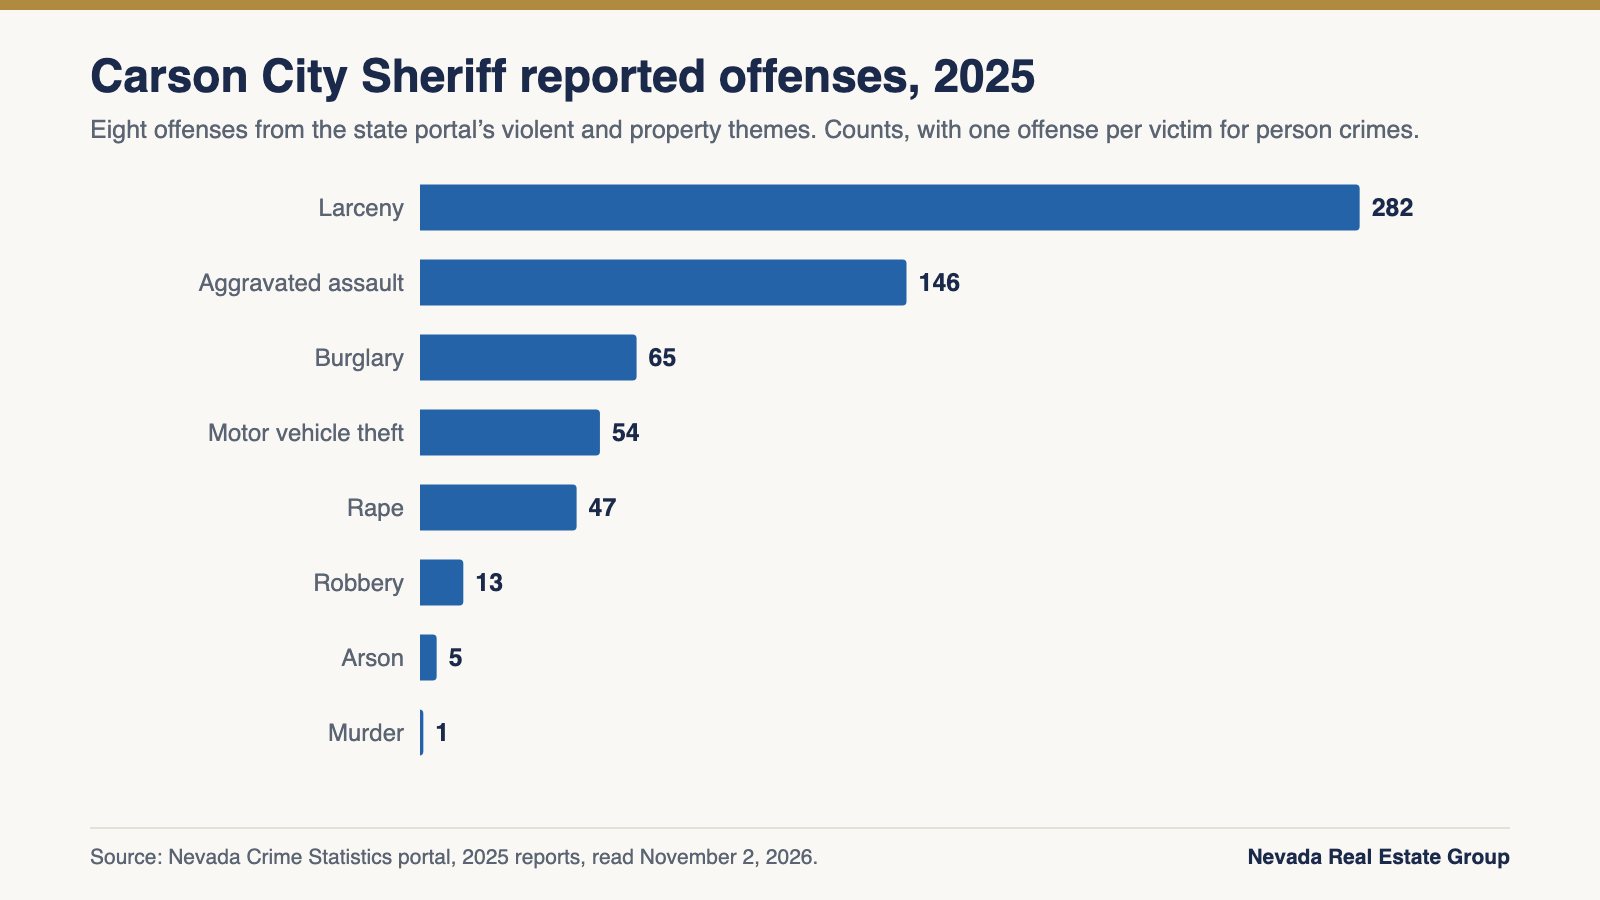
- Aggravated assault made up 146 of the 207 violent crimes in the state's 2025 report.
- Small counts swing easily, so read Carson City's percentages next to the counts behind them.
Is Carson City, Nevada actually safe?
Official records can't give a yes or no for a household, but they can give you the numbers. Nevada's crime statistics portal shows 207 violent and 406 property crimes for the Carson City Sheriff's Office in 2025.
The Census Bureau's 2025 estimate for Carson City is 58,571. On that figure, the state's counts work out to about 353.4 violent and 684.6 property crimes per 100,000 residents. That leaves out the 5 arsons, because the FBI's property estimate doesn't count arson, and the arithmetic is ours.
Compare those with the FBI's national summary, which estimates 327.6 violent and 1,534.8 property crimes per 100,000. So Carson City's violent rate sits slightly above the national estimate and its property rate well below it.
These are whole-city figures from one year. Carson City's small size means a modest change in count moves a rate more than it would in a large city, as later sections show. For the rest of the decision, including housing, costs and commutes, our moving to Carson City guide and Carson City page go further than crime data can.
How does Carson City's crime rate compare to Reno and the national average?
Using one method for each, state portal counts over Census population, the numbers look like this. Reno Police's figures work out to about 557.4 violent and 2,437.8 property crimes per 100,000 residents, so Carson City's rates are lower than Reno's on both. Compared with the national estimates, Carson City's violent rate is slightly higher and its property rate under half.
| Geography | Population used | Violent rate | Property rate |
|---|---|---|---|
| Carson City Sheriff's Office | 58,571 | 353.4 | 684.6 |
| Reno Police Department | 283,621 | 557.4 | 2,437.8 |
| Sparks Police Department | 111,902 | 366.4 | 2,235.9 |
| United States estimate | FBI estimate | 327.6 | 1,534.8 |
This table isn't a ranking, and the groups aren't quite alike. Carson City is a consolidated city and county of under 60,000 residents, Reno and Sparks are cities in a larger county, and Reno has a casino and visitor economy on a different scale. The FBI's caution against ranking says such comparisons "provide no insight into the many variables that mold the crime" in a place, and lists factors such as population density and the transience of the population.
Our Reno guide and Sparks guide read those agencies, and our Reno and Sparks pages cover the housing side.
Why might the FBI and the state show different Carson City totals?
The FBI publishes its own agency tables on its Crime Data Explorer, but that page wouldn't load when we checked on November 2, 2026, so we don't quote them here. An earlier version of this guide did, and it described a burglary gap between the two sources that we can't currently confirm.
Expect the two to differ. The state's property theme includes arson and the FBI's total doesn't, and the FBI's summary gives a data cutoff of April 2, 2026, while the portal can change. If you are quoting a Carson City figure, name the source and date. If one line matters to your decision, ask the Sheriff's Office which figure reflects its current records.
This is also a good general habit for a small agency. With only a few hundred offenses a year, a difference that would be a rounding error in Las Vegas becomes a large share of the total.
How has Carson City's reported crime changed since 2021?
On the state portal, property crime has fallen four years in a row, from 653 in 2021 to 406 in 2025. Violent crime fell to 161 in 2023, then rose to 185 and 207, which is close to its 2021 level of 220.
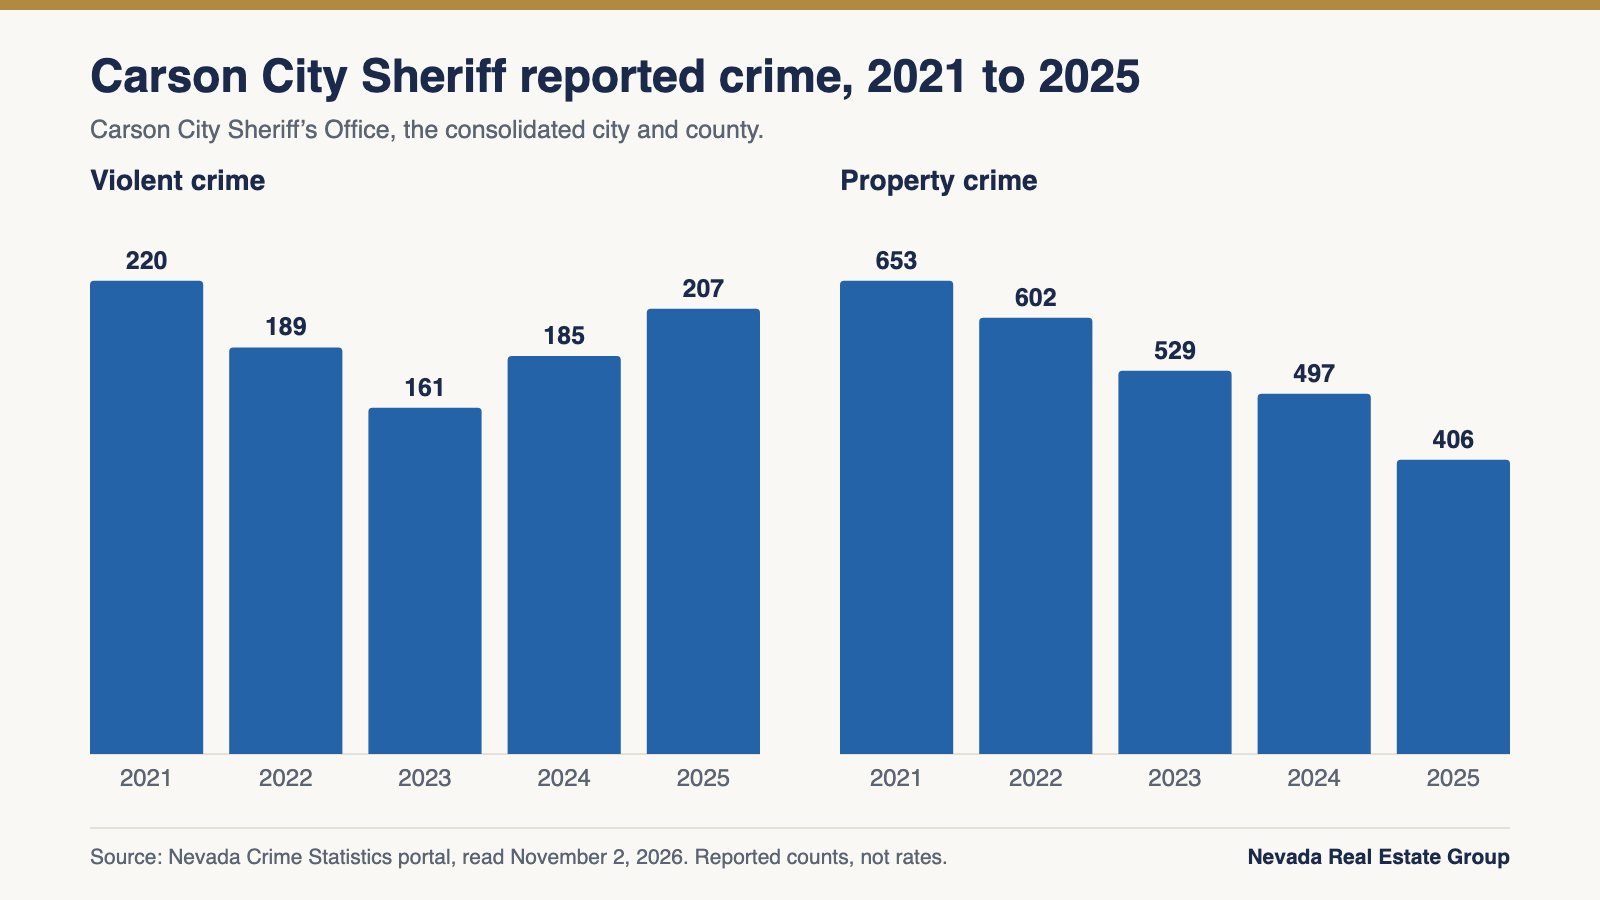
The 2025 changes went opposite ways: violent crime up 11.89% from 185 to 207, and property crime down 18.31% from 497 to 406. Nationally, the FBI estimated a 9.3% fall in violent crime and 12.4% in property crime. So Carson City's property change ran in the same direction as the country and its violent change didn't.
In raw numbers, that violent increase is 22 offenses across a city of about 58,000. Aggravated assault went from 129 to 146, robbery from 7 to 13, and murder from none to one, while rape fell from 49 to 47. That's a real change in the count, and it's also small enough that one more year could reverse it. The Census Bureau's estimates show the population almost flat, 58,300 in 2024 and 58,571 in 2025, so growth doesn't explain it.
The portal reports counts, not causes, and we won't guess at them. Reporting practices matter too: a fall can reflect less crime or fewer reports, and a rise can reflect more of either. Stick to 2021 and later, the years under the national incident-based system, and use a single source for any comparison.
For the portal's 2026 pages, we'd wait. They showed partial-year counts on November 2, and a partial year can't be set beside a full one.
What is inside Carson City's violent and property totals?
Aggravated assault dominates the violent theme, at 146 of 207 offenses, about 71%. Larceny dominates the property theme, at 282 of 406, about 69%. The portal counts one crime per victim for murder, rape and aggravated assault, one per incident for robbery, and every offense in a property incident, so these lines aren't counts of incidents or households.
| Offense | 2024 | 2025 | Change | Cleared, 2025 |
|---|---|---|---|---|
| Murder | 0 | 1 | n/a | 100.00% |
| Rape | 49 | 47 | -4.08% | 29.79% |
| Robbery | 7 | 13 | 85.71% | 53.85% |
| Aggravated assault | 129 | 146 | 13.18% | 71.23% |
| Burglary | 77 | 65 | -15.58% | 33.85% |
| Larceny | 363 | 282 | -22.31% | 20.92% |
| Motor vehicle theft | 55 | 54 | -1.82% | 16.67% |
| Arson | 2 | 5 | 150.00% | 0.00% |
The percentages here need more care than in a big city. Robbery's 85.71% jump is six more offenses. Arson's 150% rise is three. Murder's clearance rate of 100% is one case. Those figures are accurate and tell you almost nothing about a trend. Read the count first, then the percentage, and be wary of any headline built on one small line.
Clearance rates are the share of offenses the agency reported as cleared, and the portal shows 60.87% for violent crime and 22.17% for property crime overall. They describe the agency's cases, not the chance of a crime near a home.
How does the Carson City Sheriff's Office cover the city?
Carson City is a consolidated city and county, so one agency, the Sheriff's Office, reports for all of it. That makes the geography simpler than in Reno or Las Vegas. In Washoe County, Reno, Sparks and the county Sheriff's Office each report their own figures, so a reader first has to work out which one applies. If an address is in Carson City, the Sheriff's Office figures apply. The state portal lists it as the Carson City Sheriff's Office.
One thing doesn't apply: nearby addresses outside Carson City's limits are in other counties with their own sheriffs. Our Carson Valley and Reno pages cover areas that report through different agencies, so check the county first.
Does Carson City's capital-city status change the numbers?
The public records we read don't show that it does, in either direction. The state portal doesn't report offenses by employer or industry. You may read that state jobs or a settled population keep crime down. We found no study behind that for Carson City, so we can't repeat it. The FBI's caution lists many factors that shape crime from place to place, and a single figure can't separate them.
What the capital does change is who reports. The state portal lists separate reporters such as the Nevada Highway Patrol's Northwestern Command and the Nevada Gaming Control Board's Carson office. An incident handled by one of them would be counted under that agency, not the Sheriff's Office, so the Sheriff's total isn't necessarily every incident inside the city's boundaries. If a question involves a highway, a state building or a gaming matter, ask which agency took the report.
It can also affect the denominator. A per-resident rate counts people who live in the city. The FBI lists commuting patterns and transient factors among the things that shape crime from place to place, and a city with state offices may draw daytime workers who aren't in the 58,571. We don't have a count of them, so we can't adjust for it, but it's a reason to read the rate as an approximation rather than a precise figure.

Can you find crime rates for a Carson City neighborhood?
Not from an official annual report. The FBI and state stop at the agency, so no public report gives a figure for the West Side, Lakeview, Silver Oak or any other part of the city. No record we could read places any neighborhood above or below the citywide level, or shows which corridors have the most crime, so this guide doesn't name any.
We also looked for an address-level tool. We could not open the Sheriff's Office pages directly on October 31, because the city's site blocked automated access. Its listing for a Crime in Our Area page appears in search results, so start there. We couldn't confirm that CrimeMapping.com covers Carson City, so we don't recommend relying on it unless the Sheriff's Office points you to it.
That leaves a simple route that works for any address:
- Ask the Sheriff's Office what incident information it can release for a location and period.
- Use the same radius and dates for every home you are comparing.
- Ask what's included and what's held back, so a blank doesn't read as "nothing happened."
- Note the date of your request and what you received.
With a few hundred offenses a year across the city, a small area will show very few records, so a short window can look quiet or busy by chance. A full year, or the same months across two years, tells you more. Our Carson City neighborhoods guide covers housing and prices, and it isn't a measure of crime.
What can buyers do to evaluate a Carson City address?
Work from the address outward, and treat every home the same way. First confirm the property is inside Carson City, since addresses near the edges may fall in Douglas, Lyon, Storey or Washoe County, each with its own sheriff. Then gather the same set of facts for each home.
| Step | Where | What to note |
|---|---|---|
| Confirm the agency | City or county staff; the deed or tax record | Carson City or a neighboring county |
| Read the citywide totals | State portal | Full years; no neighborhood detail |
| Ask for local records | Carson City Sheriff's Office | What can be released for a location and period |
| Visit | Weekday, evening and weekend | Lighting, traffic, noise, parking and nearby commercial uses |
| Read HOA documents, if any | Resale package under NRS 116.4109 | Rules, budget and any security contracts |
Keep what you observe separate from what you conclude. "The side gate doesn't latch" is something you can fix or negotiate. "This street feels off" is hard to check, and it can lean on impressions of people rather than facts about the property. Price is no shortcut either, because a price reflects age, lot, views and condition at once.
If a gate or an HOA service matters to you, confirm it in writing, including the hours and what the contract covers. Our buyer resources explain how due diligence works, and the home search shows current listings.
What can't a crime number tell you about a Carson City home?
A count only includes what reaches the Sheriff's Office. In a national survey, the Bureau of Justice Statistics' Criminal Victimization, 2024, people told police about fewer than half of violent victimizations (47.9%) and under a third of property crimes (30.5%). In a small city, a change in reporting habits can move a total noticeably.
Nevada law keeps a good deal of this out of the seller's paperwork. NRS 40.770 says a past homicide, suicide or felony at a property, other than one involving methamphetamine manufacturing, "is not material to the transaction." It also says a seller or agent has no duty to disclose that a sex offender lives in the community. And NRS 179B.270 restricts using the state's notification website for anything related to "housing or accommodations," unless a specific statute allows it. If that matters to you, talk to a Nevada attorney.
Claims about what makes a place calm aren't data either. Describing residents isn't a way to describe crime, and the records count incidents, not people.
Our rule here follows the National Association of REALTORS' fair housing FAQ: the same sources for every part of the city, stated objectively, and no advice about who should live where. That FAQ cites a HUD letter of April 24, 2026 allowing crime-rate information to be shared "consistently and without discriminatory intent."
To compare specific homes, browse Carson City homes for sale, call (775) 277-2120 or contact Nevada Real Estate Group. We can help you request the same records for each address, and the choice of where to live is yours. If you're selling, our seller resources cover that side.
Frequently Asked Questions
What is the crime rate in Carson City?
State portal counts of 207 violent and 406 property crimes for 2025 work out to about 353 and 685 per 100,000 residents, using the Census estimate of 58,571 and leaving out arson. The FBI's national estimates were 327.6 and 1,534.8.
Is Carson City safer than Reno?
Carson City's 2025 rates are lower than Reno's on both measures: about 353 and 685 per 100,000 residents against about 557 and 2,438. Those are agency-wide figures for very different places, and the FBI cautions against ranking them. They don't describe any particular street in either city.
Is crime going up in Carson City?
It depends on the category. On the state portal, violent crime rose 11.89% in 2025, from 185 to 207, and property crime fell 18.31%, from 497 to 406. Property crime has fallen four years in a row. These are small counts, so a single year can swing either way.
Does Carson City have its own police department?
Carson City is a consolidated city and county, so the Carson City Sheriff's Office serves as its police agency. The state portal reports its figures under that name.
Which parts of Carson City have the most crime?
No official source publishes Carson City crime by neighborhood, and we don't rank areas. The FBI and state stop at the agency level. Ask the Sheriff's Office what it can release for a specific location and period, and treat each address you are considering the same way.
Why might FBI and Nevada figures differ for Carson City?
They're separate publications. Nevada's property theme includes arson and the FBI's property total doesn't, and the FBI's summary gives a data cutoff of April 2, 2026, while the portal can change. Name the source and date when you quote either figure, and ask the Sheriff's Office if one line matters to your decision.
How do I check a specific Carson City address?
First confirm the address is inside Carson City, then ask the Sheriff's Office what it can release for that location and period. Use the same radius and dates for every home, visit at different times of day, and keep notes of what was and wasn't available.
Which Sources Inform This Carson City Safety Guide?
We read these on November 2, 2026, except where noted. Rates per 100,000 are our arithmetic from state portal counts and Census populations.
- UCR Summary of Reported Crimes in the Nation, 2025: national estimates, the FBI's property crime definition and the April 2, 2026 data cutoff.
- Nevada Crime Statistics portal: Carson City Sheriff's Office violent and property reports, 2021 to 2025, plus Reno and Sparks.
- Census Bureau 2025 population estimates for Nevada: Carson City, Reno and Sparks populations.
- FBI caution against ranking, from Crime in the United States, 2011, and BJS, Criminal Victimization, 2024: limits of the data and shares of crime reported to police.
- NRS 40.770, NRS 179B.270, NRS 116.4109 and the NAR fair housing FAQ: disclosure, registry use, resale packages and the April 24, 2026 HUD letter.
- The city's Crime in Our Area page could not be opened on October 31, because the site blocked automated access. Confirm its current contents with the Sheriff's Office.
- The FBI's agency tables couldn't be read on November 2, 2026, so nothing above relies on them.
Agency tools, windows and figures change. Check the date on every number you use, and confirm the current version with the agency before you rely on it. All services are offered in compliance with the Fair Housing Act.