
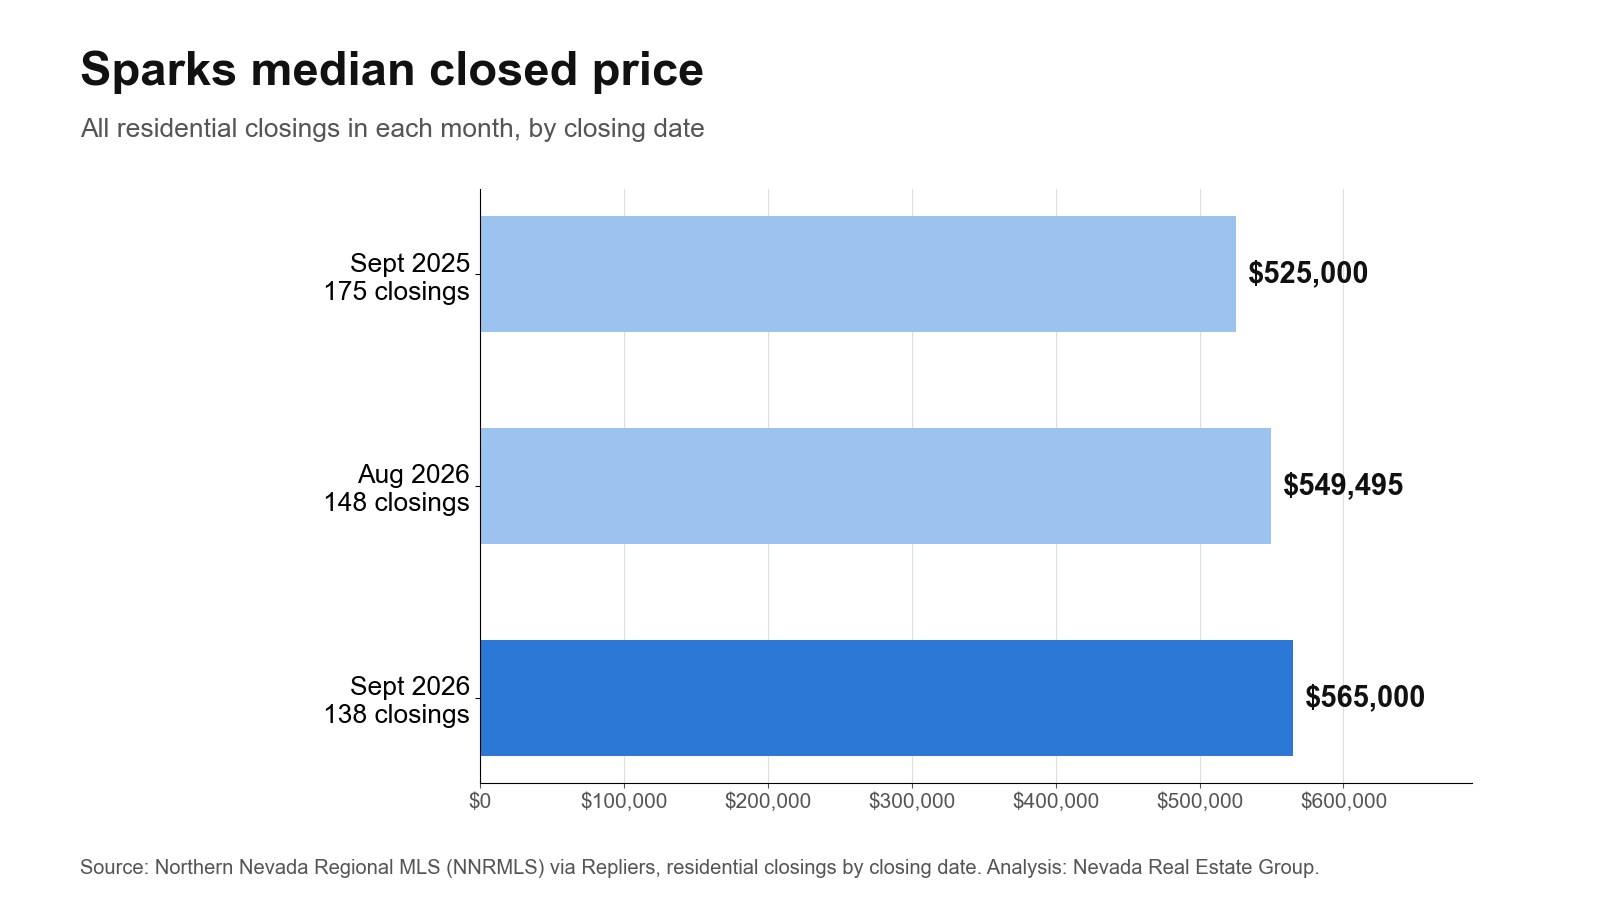
Sparks closed at $565,000 in September 2026, $67,514 under Reno, and it did so with less give: 42.0% of 138 closings came in below list against 59.3% in Reno. One ZIP does much of the work, with 89436 (Spanish Springs and Wingfield) accounting for 71 of those sales.
Sparks's median closed price was $565,000 in September 2026, per the Northern Nevada Regional MLS (NNRMLS) via Repliers, 138 closings. 42.0% closed under list and 25.4% over, yet 54.6% of 324 listings had cut by November 11. Well-priced homes still sell near asking, so separate those from the aged listings before you offer.
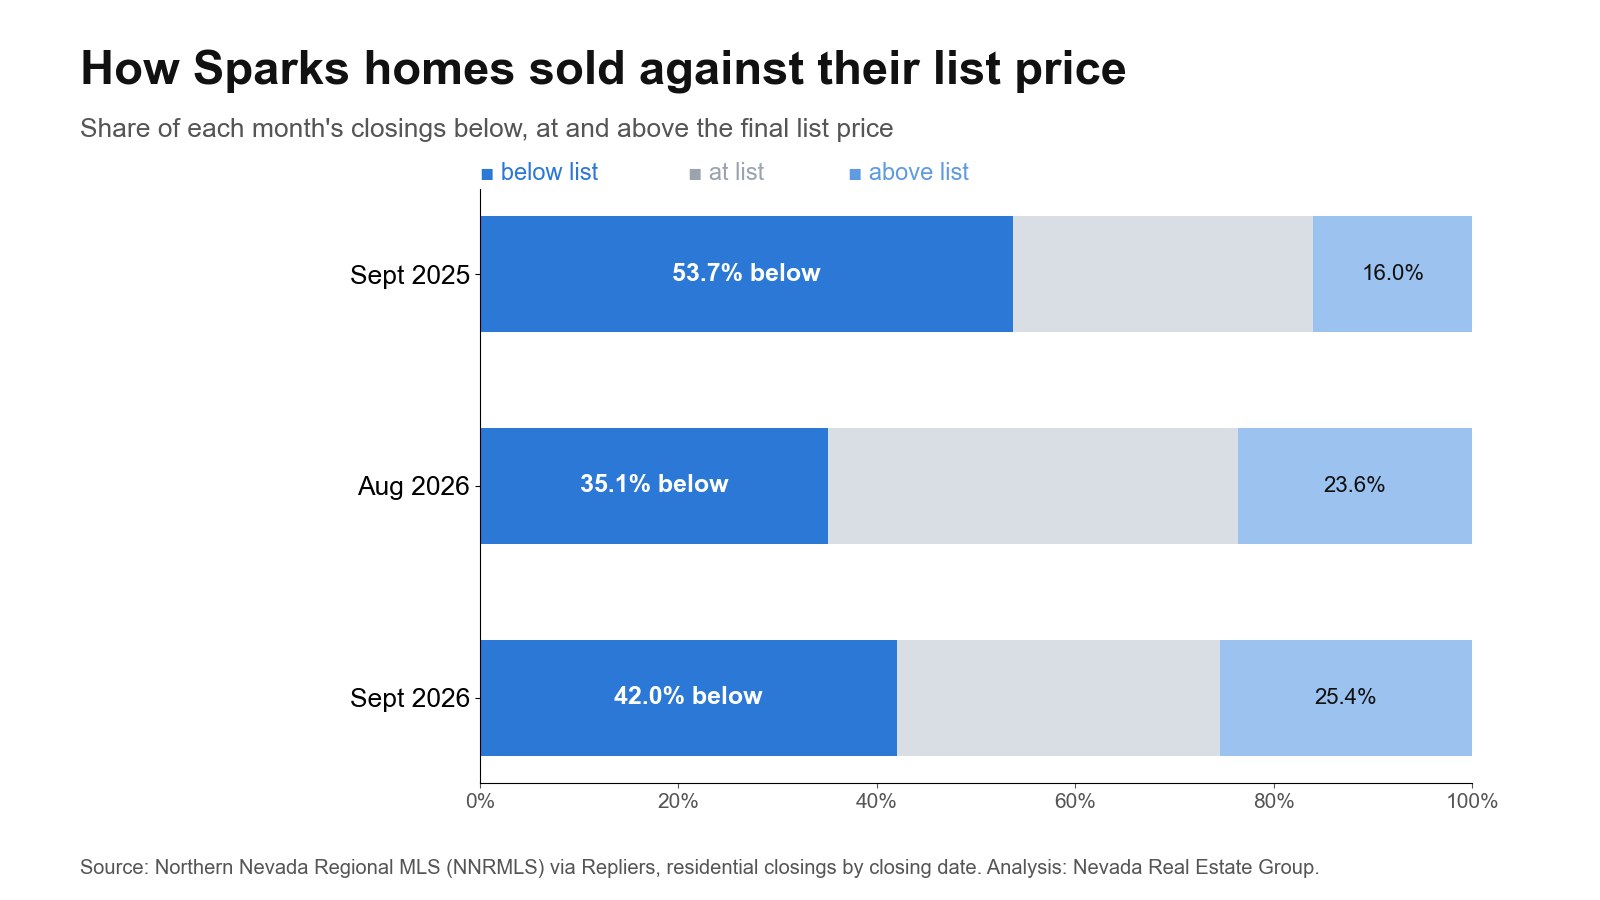
- 42.0% of Sparks closings landed below list, against 59.3% in Reno the same month.
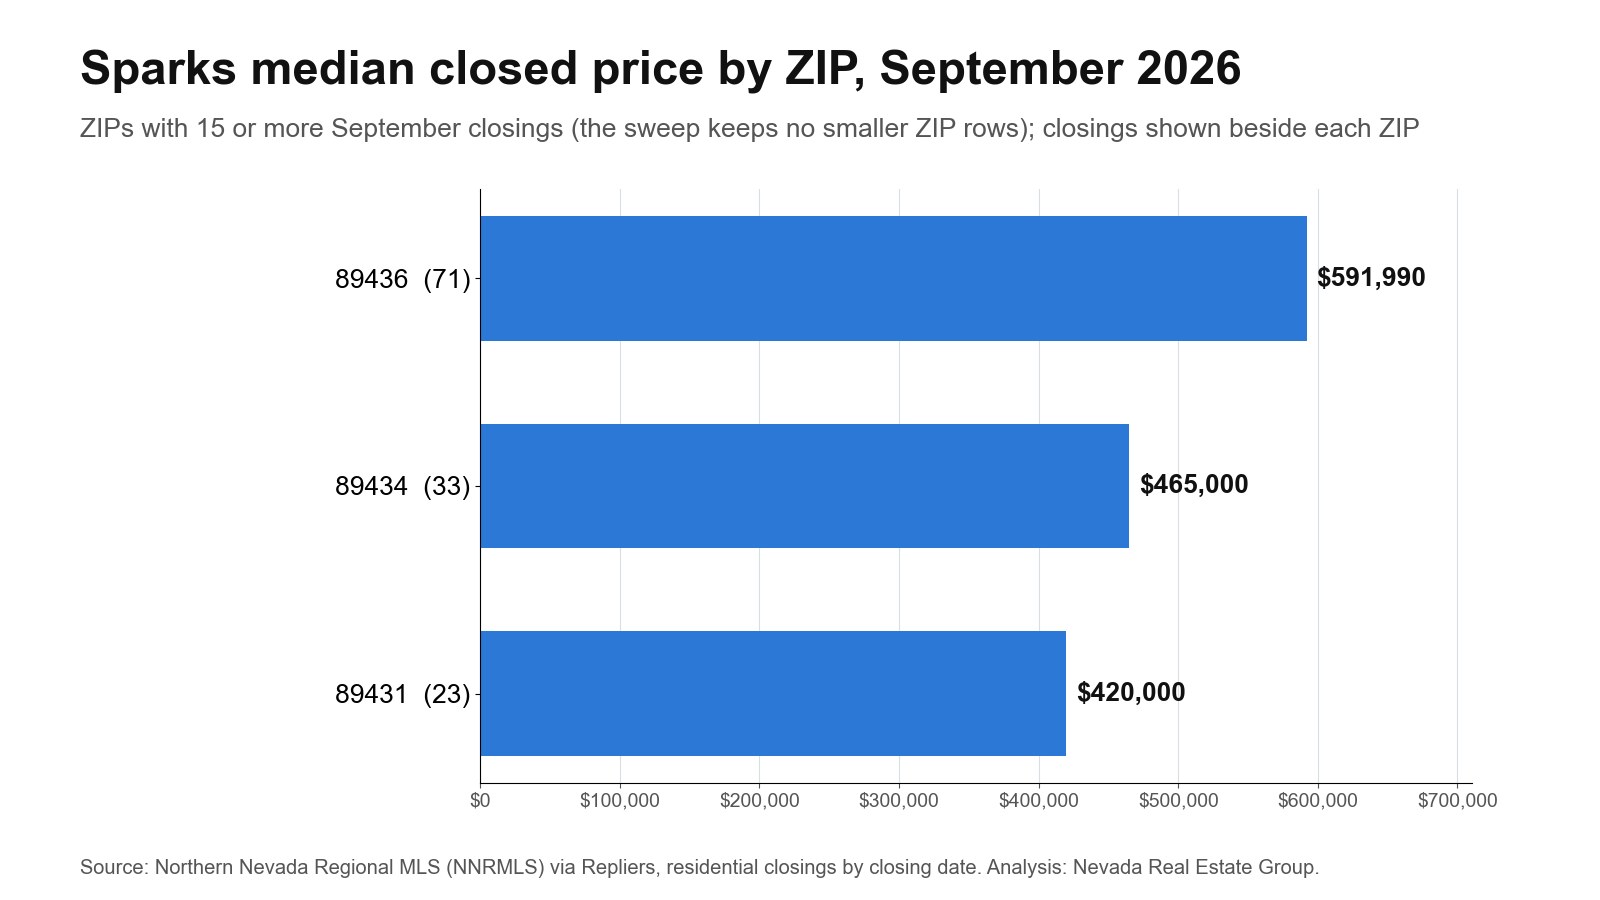
- 89436 led Sparks with 71 closings in September, at a $591,990 median.
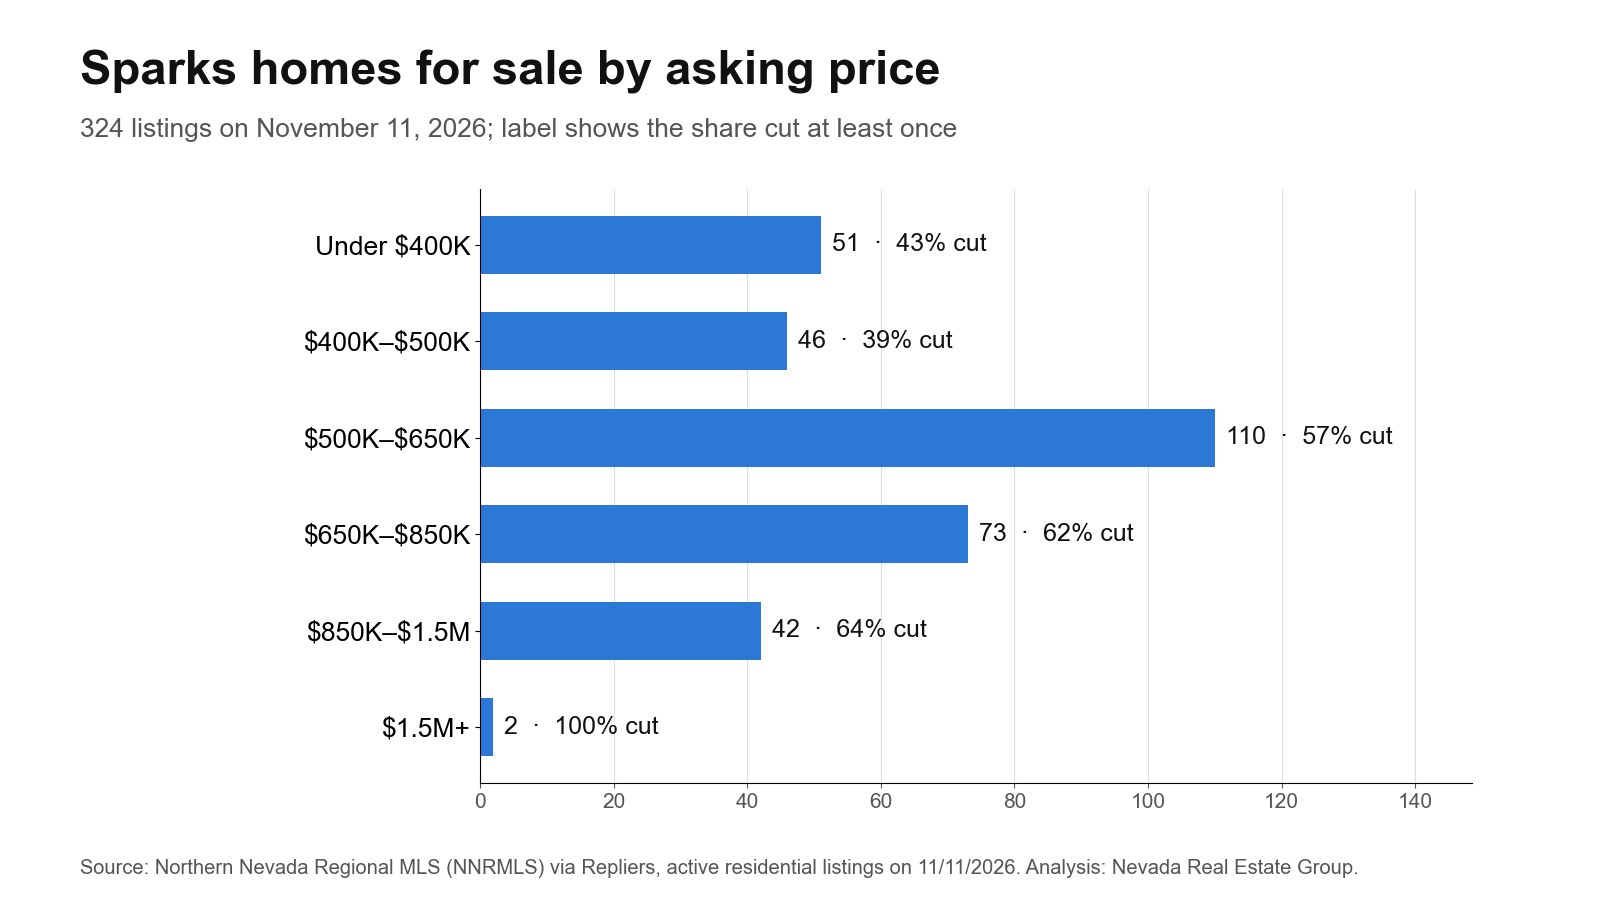
- $500K–$650K is the largest price band, with 110 homes or 34.0% of the list.
- 42.0% of September sales closed below list, and 46.4% had already been reduced first.
- 138 homes closed in September, against 148 in August; recent counts can still rise.
What Do the November 2026 Numbers Say About Sparks?
| Measure | Figure |
|---|---|
| Listings with a cut | 54.6% |
| Closed above list | 25.4% |
| Closed below list | 42.0% |
| Listed 60 days or more | 49.7% |
| Sale-to-list | 100.0% |
| September median closed | $565,000 |
| Median ask | $582,000 |
| Active listings | 324 |
| Houses | $583,250 |
| Condos and townhomes | $327,000 |
| Closed per square foot | $302 |
| Median days, listing to closing | 58 |
The figures follow the MLS city field for Sparks. 89436 (Spanish Springs and Wingfield) produced 51.4% of the month's closings, so the citywide median is close to a reading of that one ZIP. Anyone buying or selling outside it should look at the ZIP row, not the headline. The attached market is small here, with 32 condos and townhomes listed against 269 houses, so nearly every comparison in this report is a comparison of houses, at a $619,000 median ask.
All of these figures come from the Northern Nevada Regional MLS (NNRMLS) via Repliers. See the Sparks market page for the settled months behind these numbers. That page groups sales by the MLS sold date, which on this feed is the contract date, so its monthly figures will not match this report's closing-date counts. It is the quickest way to tell a one-month change from a real shift in the market.
Are More Sparks Homes Closing Than in August?
| Month | Closings | Houses |
|---|---|---|
| August | 148 | 131 |
| September | 138 | 120 |
| September 2025 | 175 | 147 |
No. 138 homes closed in September against 148 in August, 10 fewer. The same month last year had 175, so the count is behind 2025 by 37.
Counts in a recent month can still rise a little as late closings post, so a small change is not a trend. What a count does tell you is how much evidence sits behind the median. 138 closings is about 32 a week, enough that recent comparable sales exist for most ordinary homes. For the longer view, the Sparks housing guide has the context behind these monthly counts. 117 October closings are in the feed so far, a provisional count that may still rise.
Volume is worth reading alongside price, because the two can tell different stories. A falling count with steady prices can mean sellers are holding out, and a rising count with steady prices can mean deals are getting done at the current level. The $565,000 median and the 138 count belong together: read either one alone and you have half the picture. Next month's edition will show whether this count held once late closings posted.
Is Sparks Building More Apartments or More Houses?
| Type | 2026 | 2025 |
|---|---|---|
| Single-family units | 229 | 306 |
| Units in buildings of five or more | 656 | 192 |
Through September, Sparks permitted 229 single-family units and 656 units in buildings of five or more, according to the Census Building Permits Survey. A year earlier those figures were 306 and 192.
A heavy apartment pipeline matters to anyone buying a rental or weighing rent against a mortgage, because new apartments compete for the same tenants. Here the multifamily count is larger than the single-family count. Not every permit gets built on schedule, and a single large project can swing a year's figure, so treat this as a direction. For an owner thinking about renting a home out, look at asking rents nearby before relying on any pro forma. For what is on the ground today, see our new homes page.
For the newer month, Northern Nevada Regional MLS figures for October 2026, as updated November 8 and summarized by the Kinney and Renwick team on November 9, put Reno's single-family median at $667,500, up 4.4% from a year earlier, and Sparks at $625,000, up 10.6%, with 2.4 and 2.8 months of supply. Those are early figures from another brokerage's summary, not this report's own count.
Single-family permits and apartment permits answer different questions. The first affects how many homes a resale seller will compete with, and the second affects rents and, through them, the math on buying versus renting. Keep them apart when someone tells you the city is building too much or too little, and ask which kind of housing they mean.
Where in Sparks Did the Most Homes Actually Sell?
| ZIP | Closings | Active | Median closed |
|---|---|---|---|
| 89436 (Spanish Springs and Wingfield) | 71 | 175 | $591,990 |
| 89434 | 33 | n/a | $465,000 |
| 89431 (Old Sparks) | 23 | n/a | $420,000 |
Three ZIPs produced 127 of Sparks's 138 closings, or 92.0%: 89436 (Spanish Springs and Wingfield) with 71, 89434 with 33, 89431 (Old Sparks) with 23. 89436 (Spanish Springs and Wingfield) also had 175 homes listed on November 11, about 2.5 times its monthly sales.
Busy ZIPs are the easiest places to price a home, because recent closings exist to compare. Further down this table the evidence thins out, and a pricing opinion needs a wider date range to be worth anything. If your home sits in a low-count ZIP, ask to see the sales behind any number you are given, and how old they are. A sale from nine months ago is a weaker comparison than one from last month. The ZIP report index carries the same figures for each ZIP.
The busiest ZIPs in September, one line each:
- 89436 (Spanish Springs and Wingfield): 71 closings at $591,990, 100.0% of list, 175 listed with 58.3% cut.
- 89434: 33 closings at $465,000, 100.0% of list.
- 89431 (Old Sparks): 23 closings at $420,000, 100.0% of list.
Where Is Most of Sparks's Inventory Priced?
| Band | Listings | Share of list |
|---|---|---|
| $500K–$650K | 110 | 34.0% |
| $650K–$850K | 73 | 22.5% |
| Under $400K | 51 | 15.7% |
| $400K–$500K | 46 | 14.2% |
| $850K–$1.5M | 42 | 13.0% |
| $1.5M+ | 2 | 0.6% |
$500K–$650K is the largest group, 110 homes or 34.0% of everything for sale, followed by $650K–$850K at 22.5%. Together those two bands hold 56.5% of the choice a Sparks buyer has today.
The median ask of $582,000 is one point in that range, but nobody shops a median. Find your band, then look at how long homes in it have been listed: the typical home in $500K–$650K has been up 59 days. The more homes in your band, the less pressure to accept a weak deal, and the thinner the band, the more a good listing is worth moving on. Sellers should read it the same way, since a home in a crowded band has to be chosen over more alternatives. If you are shopping that band, current Sparks listings show what those days look like in practice.
A long band is good news for a buyer and a warning for a seller. Compare what 138 closings a month means against the number of homes in your band, and you will see how long the current list would take to clear at this pace.
How Close to Asking Did Sparks Homes Close in September?
| Type | Sale-to-list | Below list | Above list |
|---|---|---|---|
| All homes | 100.0% | 42.0% | 25.4% |
| Single Family Residence | 100.0% | 43.3% | 24.2% |
| Condo / Townhouse | 100.0% | 37.5% | 37.5% |
The median Sparks home closed at 100.0% of its final list price, tied with two other markets for the highest of the eight in this series. Split it out and 42.0% of sales came in below list, 32.6% at list and 25.4% above.
That ratio flatters sellers a little, because it is measured against the last price and not the first. 46.4% of these homes had already been reduced before they went under contract, so the real distance from the opening ask is wider than the ratio shows.
On a $565,000 home, each point of sale-to-list is $5,650, and that is the size of the number to argue about once an offer is on the table. A quarter of sales finished at or below 99.3% of list, so that is where the softer deals begin.
A seller can use that as a pricing test. If you expect to receive 100.0% of list, work back from the net you need to the list price that gets you there. A buyer can use it the other way, with the median sale as the fair starting point and the softer quarter of deals, at 99.3% of list or less, as a guide to how far some sellers have gone.
Which Nearby Market Is Closest to Sparks on Price?
| Market | Median closed | Gap to Sparks | Closings |
|---|---|---|---|
| Reno | $632,514 | +$67,514 | 324 |
| Sparks | $565,000 | n/a | 138 |
| Carson City | $525,000 | -$40,000 | 97 |
Carson City is the nearest on price, $40,000 below Sparks at a $525,000 median, and closed at $305 a square foot against $302 here. Reno, the neighbor across the city line, sits $67,514 above at $632,514. The deals differ too: 59.3% of Reno closings and 46.4% of Carson City closings landed below list, against 42.0% in Sparks, and Reno closed at $343 a square foot.
A buyer choosing between Sparks and Reno is choosing on more than price, so the decision comes down to location, the homes themselves and how the deal is likely to go. A median also hides different mixes, so check what each one's closings were made of before calling them equal. Follow the links in the table for each market's live page, then compare a real home in each one.
The line between Sparks and Reno matters most to anyone shopping near it. If your search covers both, a citywide median says little about two homes a few blocks apart, so use home age, lot size and association dues to decide. A seller near the boundary should expect buyers to tour both sides and should check recent closings across the line, not just within Sparks. The 138 closings here are the bigger or smaller sample depending on which row you are comparing, so give the larger one more weight.
What Should Sparks Buyers Offer Right Now?
Start from closings, not asks. The median September home went for 100.0% of list and 42.0% closed below it, so an offer under asking is a harder ask in Sparks than in most of this series. It is not always a winning one: 25.4% of sales finished above list.
Then narrow it to the street. In 89436 (Spanish Springs and Wingfield), where 71 homes closed, the median was $591,990 at 100.0% of list. Pull the three closest sales, adjust for size and condition, and set your number there. If the home has been listed past 116 days, ask what offers it has seen and why they failed.
Most of what closes here is in 89436 (Spanish Springs and Wingfield), so that ZIP is where you will find the comparisons. Elsewhere in Sparks, expect fewer of them. Start with current Sparks listings and our buyer guide.
One more check before you sign: ask for the sold date and the closing price of each comparable, and how long it took to sell. A comparison from this September carries more weight than one from last spring, and a sale at 100.0% of list says something different if that list price had already been cut. Your offer should be something you can explain in one sentence, using those sales.
How Should Sparks Sellers Prepare the Home?
Spend where a buyer will see it or an inspector will find it. September closings ran $302 a square foot at the median, and the homes above that figure are the ones to learn from: look at what they had that yours does not. Walk your comparables, or have your agent send the photos, before you pay for anything.
Deal with safety and function first, such as the roof, the air conditioning and anything that leaks, since those are what a buyer's inspection will raise. Then look at the cheap, visible things: paint, light fixtures, yard, and a clear-out. Big remodels are harder to justify just before a sale, because you would be paying for someone else's taste, so get a local opinion on what a project would add before you start.
If your home is in 89431 (Old Sparks), which closed only 23 in September, pricing it off the citywide median means pricing it off someone else's ZIP.
With 54.6% of the Sparks list carrying a price cut, a home that is clean, repaired and fairly priced has a clearer path than one asking a buyer to do the work. Call or text (775) 277-2120 for a walk-through, or see our sellers page.
Keep your receipts for anything recent, since a buyer will ask what was done, when and by whom. A short list of completed work with dates reassures a buyer and an inspector more than a claim that the home has been well kept.
Can Sparks Keep Closing This Close to List?
Sparks closed at 100.0% of list in September, against 98.9% in Reno, with 54.6% of the list already cut. That combination says the homes that sell are priced well, and the rest are waiting to get there. Whether it lasts depends on how many of the 324 current listings can reach a price buyers will pay.
The first sign of change would be in 89436 (Spanish Springs and Wingfield), which produced 71 of the month's 138 closings. If its sale-to-list of 100.0% slips, the citywide figure is likely to follow. The other thing to watch is the price gap to Reno, because a smaller gap can send buyers back across the line. The Sparks market page carries the settled series, and the Sparks housing guide has the local background. Sellers outside the busiest ZIP should not assume the citywide ratio applies to them, and buyers there should ask for the closest sales rather than the headline. With 32 attached listings against 269 houses, watch the house figures first, since they will set the tone for the rest of the city, and they carry most of the sample every month.
Frequently Asked Questions
What is the median home price in Sparks?
$565,000 for closings in September 2026, the latest settled month, on 138 sales. Houses alone were $583,250, and the median ask on November 11, 2026 was $582,000.
Is Sparks a buyer's market?
It is roughly balanced: 42.0% of September closings landed below list, and 54.6% of listings have cut.
Is Sparks inventory high right now?
324 homes were listed on November 11, 2026 against 138 closings in September. This report does not calculate months of supply; the October board figures summarized by Kinney and Renwick put Sparks single-family homes at 2.8 months.
How long does it take to sell a home in Sparks?
The median September closing took 58 days from listing to closing. Homes still for sale on November 11, 2026 had been listed a median 58.5 days.
Are Sparks home prices going up or down?
Year over year, the September median rose $40,000 (7.6%) to $565,000 from $525,000. One month is a thin read, so use the live market page for the longer trend.
What does a Sparks home cost at today's rate?
At Freddie Mac's 7.18% 30-year fixed average for the week of 2026-11-05, $583,250 with 20% down carries $3,161 a month in principal and interest.
Which Sources Inform This Sparks Report?
- Northern Nevada Regional MLS (NNRMLS) via Repliers: counted November 11, 2026.
- Freddie Mac PMMS: week of 2026-11-05.
- Census permits through September 2026 and the prior year.
- Northern Nevada Regional MLS October 2026 figures, summarized by Kinney and Renwick: the board's October 2026 figures.
- Our September 2026 report.
- More on Sparks: area guide, homes for sale, new homes, housing guide, market page, ZIP reports, buying, payments, down payment help, selling.
Listings are counted one by one on the sweep date, residential only. Closings are counted by MLS closing date, and a month counts as settled once its last day is 40 days old; a younger month appears only as provisional. Listing age runs from the list date. This is market analysis, not a valuation of any specific property.
The latest citable figures, with method, sample size and a downloadable chart, are on our Reno market data page. Based on information from the Northern Nevada Regional Multiple Listing Service® for the period September 1, 2025 through November 11, 2026.
Thinking of selling in Sparks? See how November’s numbers apply to your home